Nasdaq Dead Cat Bounce or Real Recovery? What 47 Drops Show

After 47 Nasdaq drops of 13% or more since 1986, a Nasdaq dead cat bounce was followed by a further 5% fall within a month 57.4% of the time, so here is how to tell relief from recovery.
By John Zadeh -
Orange ball mid-bounce before a Nasdaq V-shaped chart, illustrating the nasdaq dead cat bounce and 47 drops since 1986
  • The Nasdaq has fallen 13% within 22 trading days 47 times since 1986, and in 57.4% of those episodes it dropped another 5% or more within the following month.
  • The edge from oversold bounces fades fast: the average one-week return is +1.47% with 66% positive, but the three-month average is only +1.77% with just 53.2% positive.
  • A big early rally says little about direction: only 10 of 47 episodes produced a 5%+ Nasdaq-100 rebound within three sessions, and five of the seven with three-month data still fell another 5% within a month.
  • The current rebound is concentrated in semiconductors and AI infrastructure, with AMD up 11% and the SOX up 4.2% after a 12% fall, while the AI valuation, data-centre financing and GPU demand concerns remain open.
  • The V-shaped label needs semiconductors participating, the index reclaiming its breakdown area while holding the September and October lows, and the catalyst resolved; April 2025 recovered on a resolved tariff catalyst, while 2008 rallies faded until March 2009.
Summarise with AI:

The Nasdaq has bounced hard from a 13% slide over 22 trading sessions. Even so, at one point in the rebound it still sat roughly 9% below its early-October peak. Many investors read a rally that sharp as proof the worst has passed, but the history of the Nasdaq’s dead cat bounce episodes is less generous than that.

The selloff peaked on 5 November 2026, when the Nasdaq-100 suffered its worst day since March 2020. The partial recovery since then has been fast, loud and concentrated in the same technology names that led the fall.

That matters because mistaking an oversold bounce for a genuine recovery is how investors end up adding risk just before the next leg down.

Here is a data-driven framework for telling a relief rally from a durable recovery. It covers the historical base rate, the specific signals that separate the two patterns, and the levels worth checking this week.

What do 47 Nasdaq drops since 1986 say about the days and months after a sharp fall?

The study at the centre of this debate uses a strict test. It looks for every time the Nasdaq fell at least 13% within 22 trading days. Since 1986, that has happened 47 times.

The first week looks encouraging. The average one-week return across those episodes was +1.47%, and the index finished higher 66% of the time.

Then the edge fades.

Stretch the window to three months and the average return barely improves, to +1.77%. The median is 1.37%, and only 53.2% of episodes were positive. That is close to a coin flip.

Horizon Average return Median return Share positive
One week +1.47% Not reported 66%
Three months +1.77% 1.37% 53.2%

The figure that most undercuts the optimism is the one about further damage.

Further declines are the norm, not the exception In 57.4% of the 47 episodes, the Nasdaq fell another 5% or more within the following month.
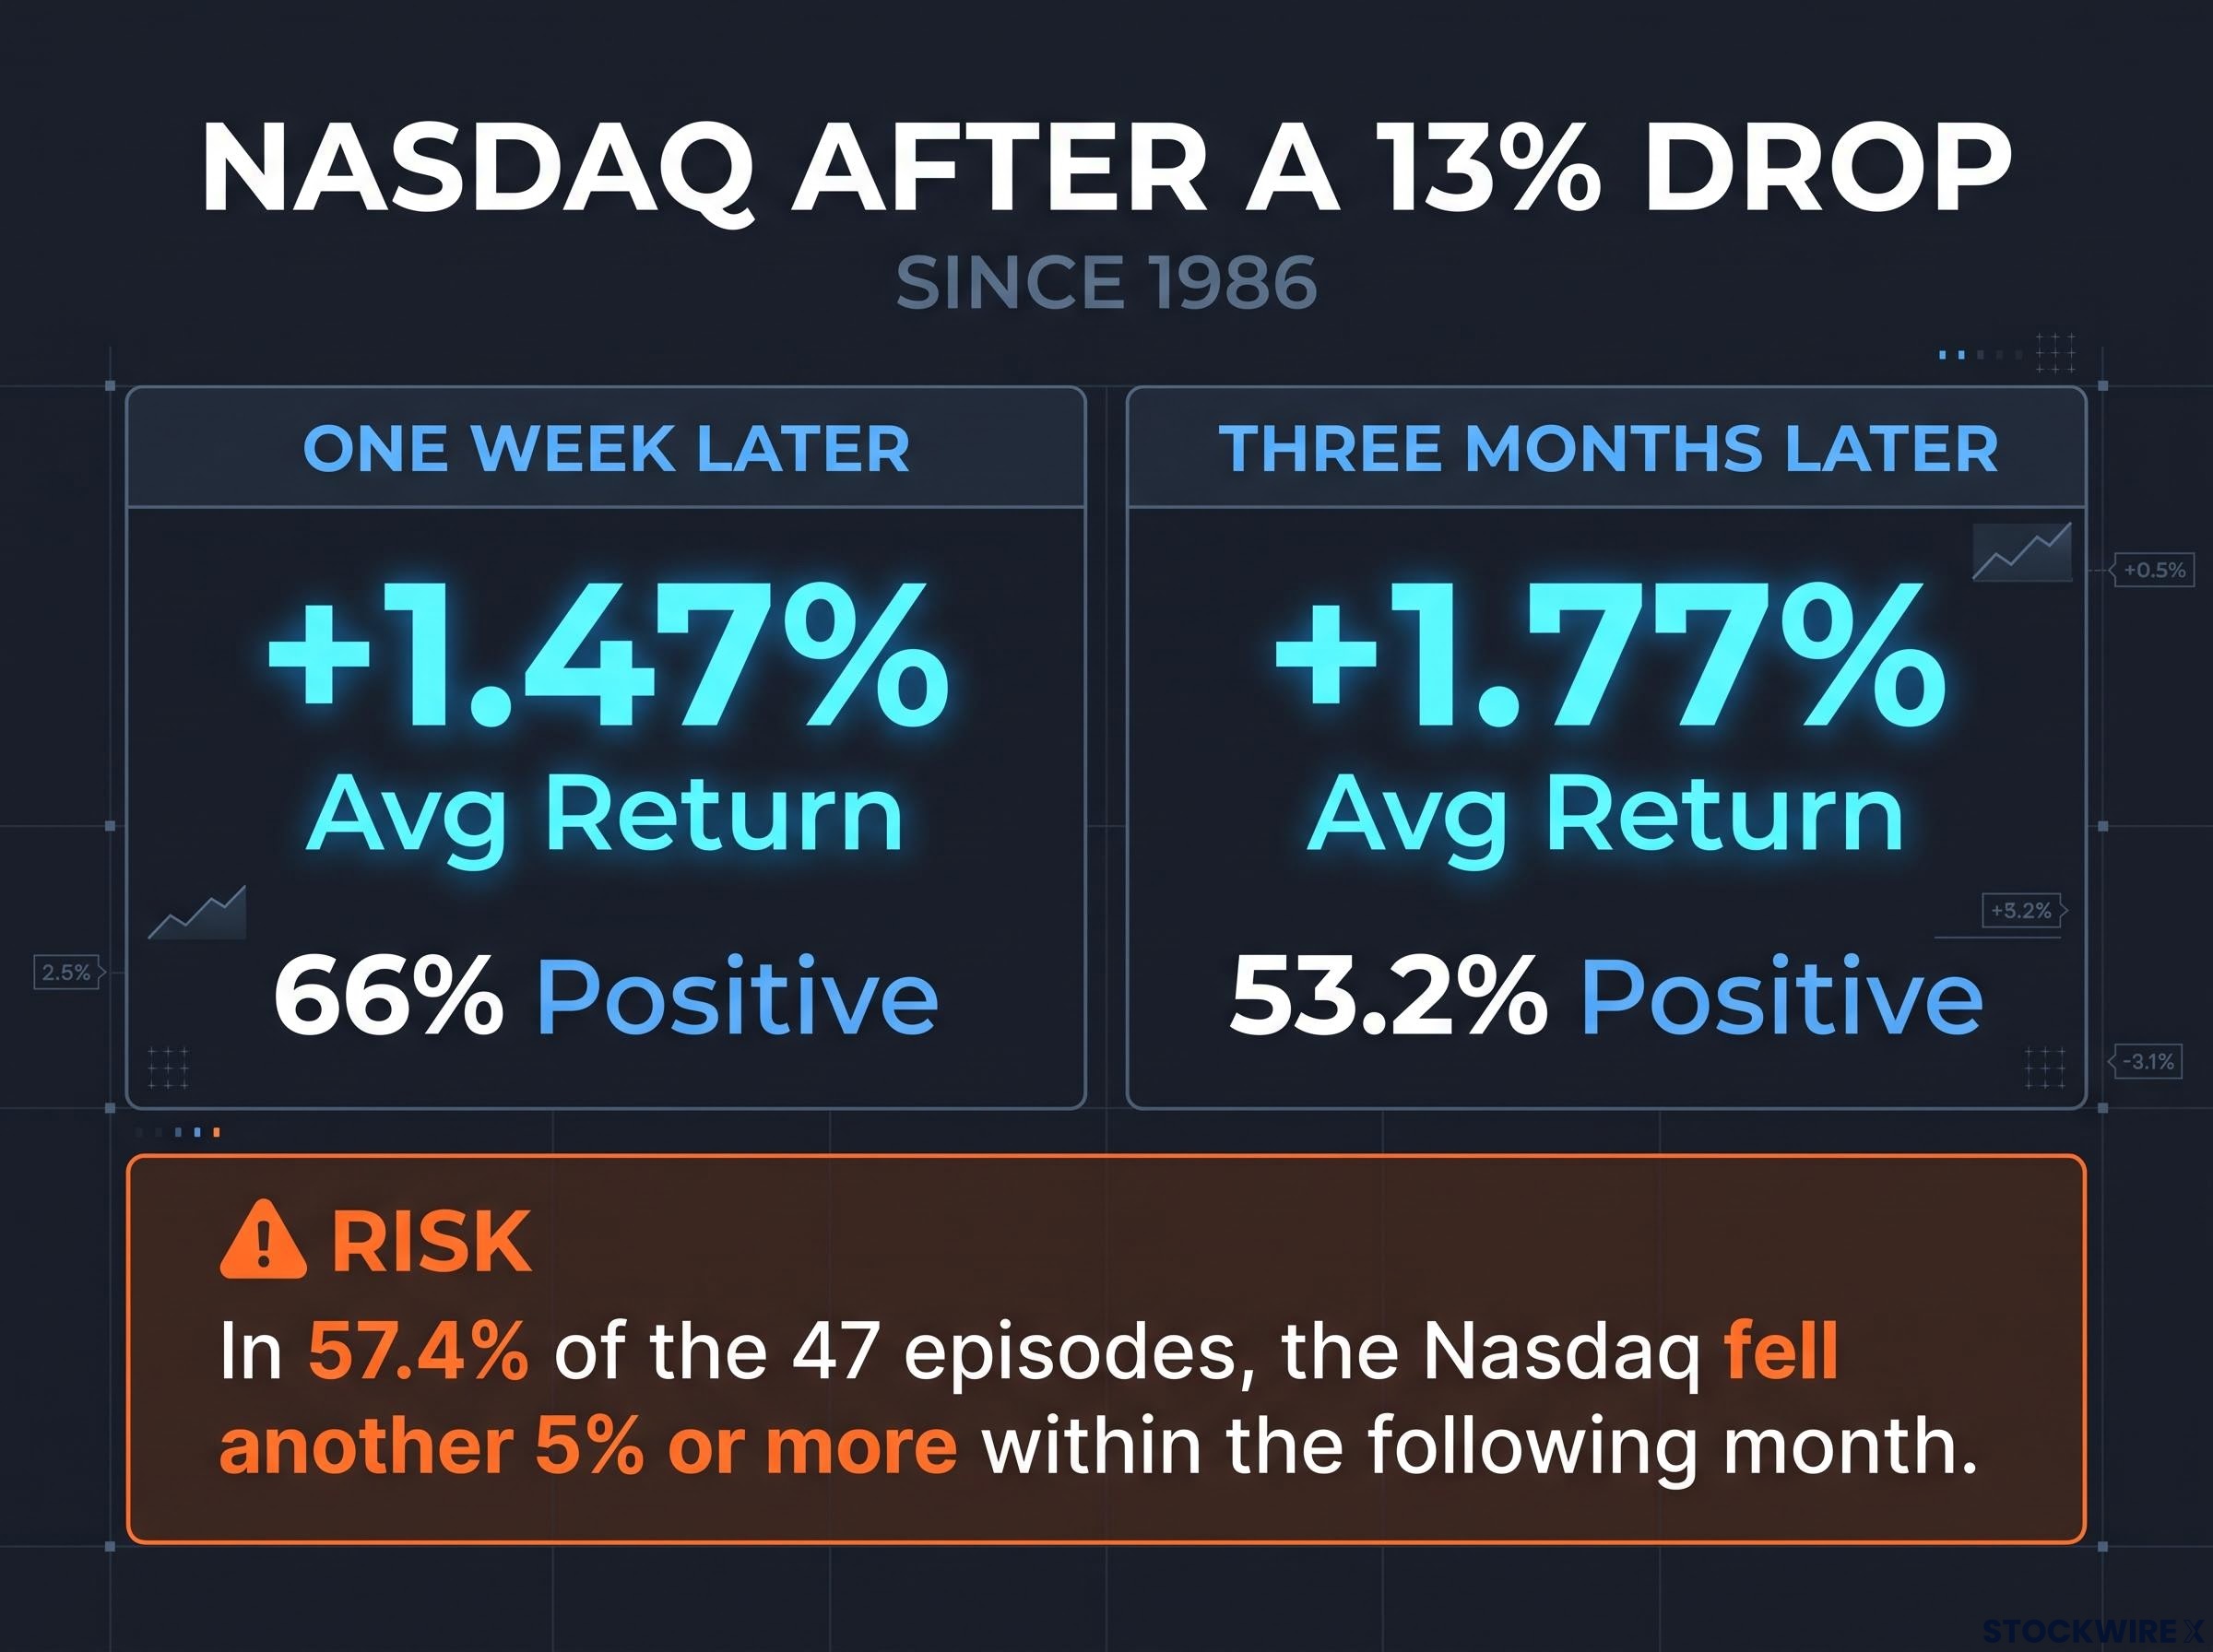
Comparative data of 47 Nasdaq drops since 1986: one-week average return +1.47% vs three-month average return +1.77% with 57.4% falling 5% more.

After 47 drops of 13% since 1986, the Nasdaq averages a +1.47% return in one week, but 57.4% of the time it falls another 5% or more in the next month.

A Reuters analysis published on 2 November 2026 looks more upbeat. After a decline of about 2.9% over 20 sessions, the Nasdaq was higher 20 sessions later in 36 of 54 cases since 2007 (67%), with a median gain of 3.9%. That is a much milder test than a 13% collapse, so it corroborates the short-term tendency rather than the scenario at hand.

Both samples are small, and the results shift depending on whether a decline is measured over 20 or 22 sessions. The lesson for you still holds: oversold conditions favour a quick pop, but over three months they offer little more than even odds. A bounce on its own is not a reason to add risk.

Cause matters as much as size when buying the Nasdaq dip: pullbacks outside crises have historically produced far stronger three-month results than those inside them, which is why the resolved-versus-unresolved catalyst question carries so much weight.

Dead-cat bounce or V-shaped recovery: how do you tell them apart?

If the base rate is a coin flip, the next question is how to tell which side of the coin you are on. That starts with two definitions.

A dead-cat bounce is a short-lived rise in a falling market. Prices recover briefly, then resume their decline. A V-shaped recovery is a sharp fall followed by an equally sharp and lasting climb back toward previous highs.

In the first few days, the two look identical. Both are usually driven by the same mechanics:

  • Forced selling is finished: leveraged and risk-controlled funds have already cut their positions.
  • Short covering: traders who bet against stocks buy them back to close those bets, pushing prices up.
  • Thin liquidity: with fewer sellers left, modest buying moves prices sharply.
  • Options-hedging feedback: dealers and systematic strategies adjust hedges as volatility falls, adding fuel to the move.
  • Narrative relief: a policy clarification, softer rate expectations or a company update gives buyers a reason to step in.

None of these tells you what comes next. The divergence shows up later, in breadth (how many stocks join the rally), price levels and fundamentals.

Every historical episode passed through the same first 10% of decline, so depth alone cannot settle the correction or bear market question; trend line breaks and trailing-stop tools offer a sturdier test of what the bounce means.

Dead-cat bounce warning signs V-shaped recovery confirmation
Narrow breadth Improving advance-decline breadth
Weak volume confirmation Index reclaims the breakdown area
Renewed semiconductor underperformance Semiconductors and AI infrastructure participate, not just bounce
Lower highs Successive higher highs and higher lows
Retest of the recent low Credit and volatility stabilise; earnings and capex expectations hold

Why a strong early bounce is ambiguous

You might expect a powerful first rebound to signal strength. The data does not support that. Only 10 of the 47 episodes produced a 5%+ Nasdaq-100 rebound within three sessions of the signal.

Seven of those had three-month data available. Five of the seven still suffered another decline of at least 5% within a month.

With fewer than 30 cases, that subset is too thin to support firm conclusions. What it does show is that a big early rally tells you very little about direction, so judge this one by what happens after the bounce, not by how large it was.

What is driving the current Nasdaq rally, and how broad is it?

Apply that lens to the current move, and the headline rebound starts to look less reassuring.

The Nasdaq Composite peaked at 27,599.79 on 6 October 2026. On 5 November, it closed at 24,315.00, down 5.52% on the day, while the Nasdaq-100 fell 6.4% and Reuters reported a drawdown of as much as 14% from the all-time high. The Composite added 1.09% the next day and closed at 25,466.19 yesterday.
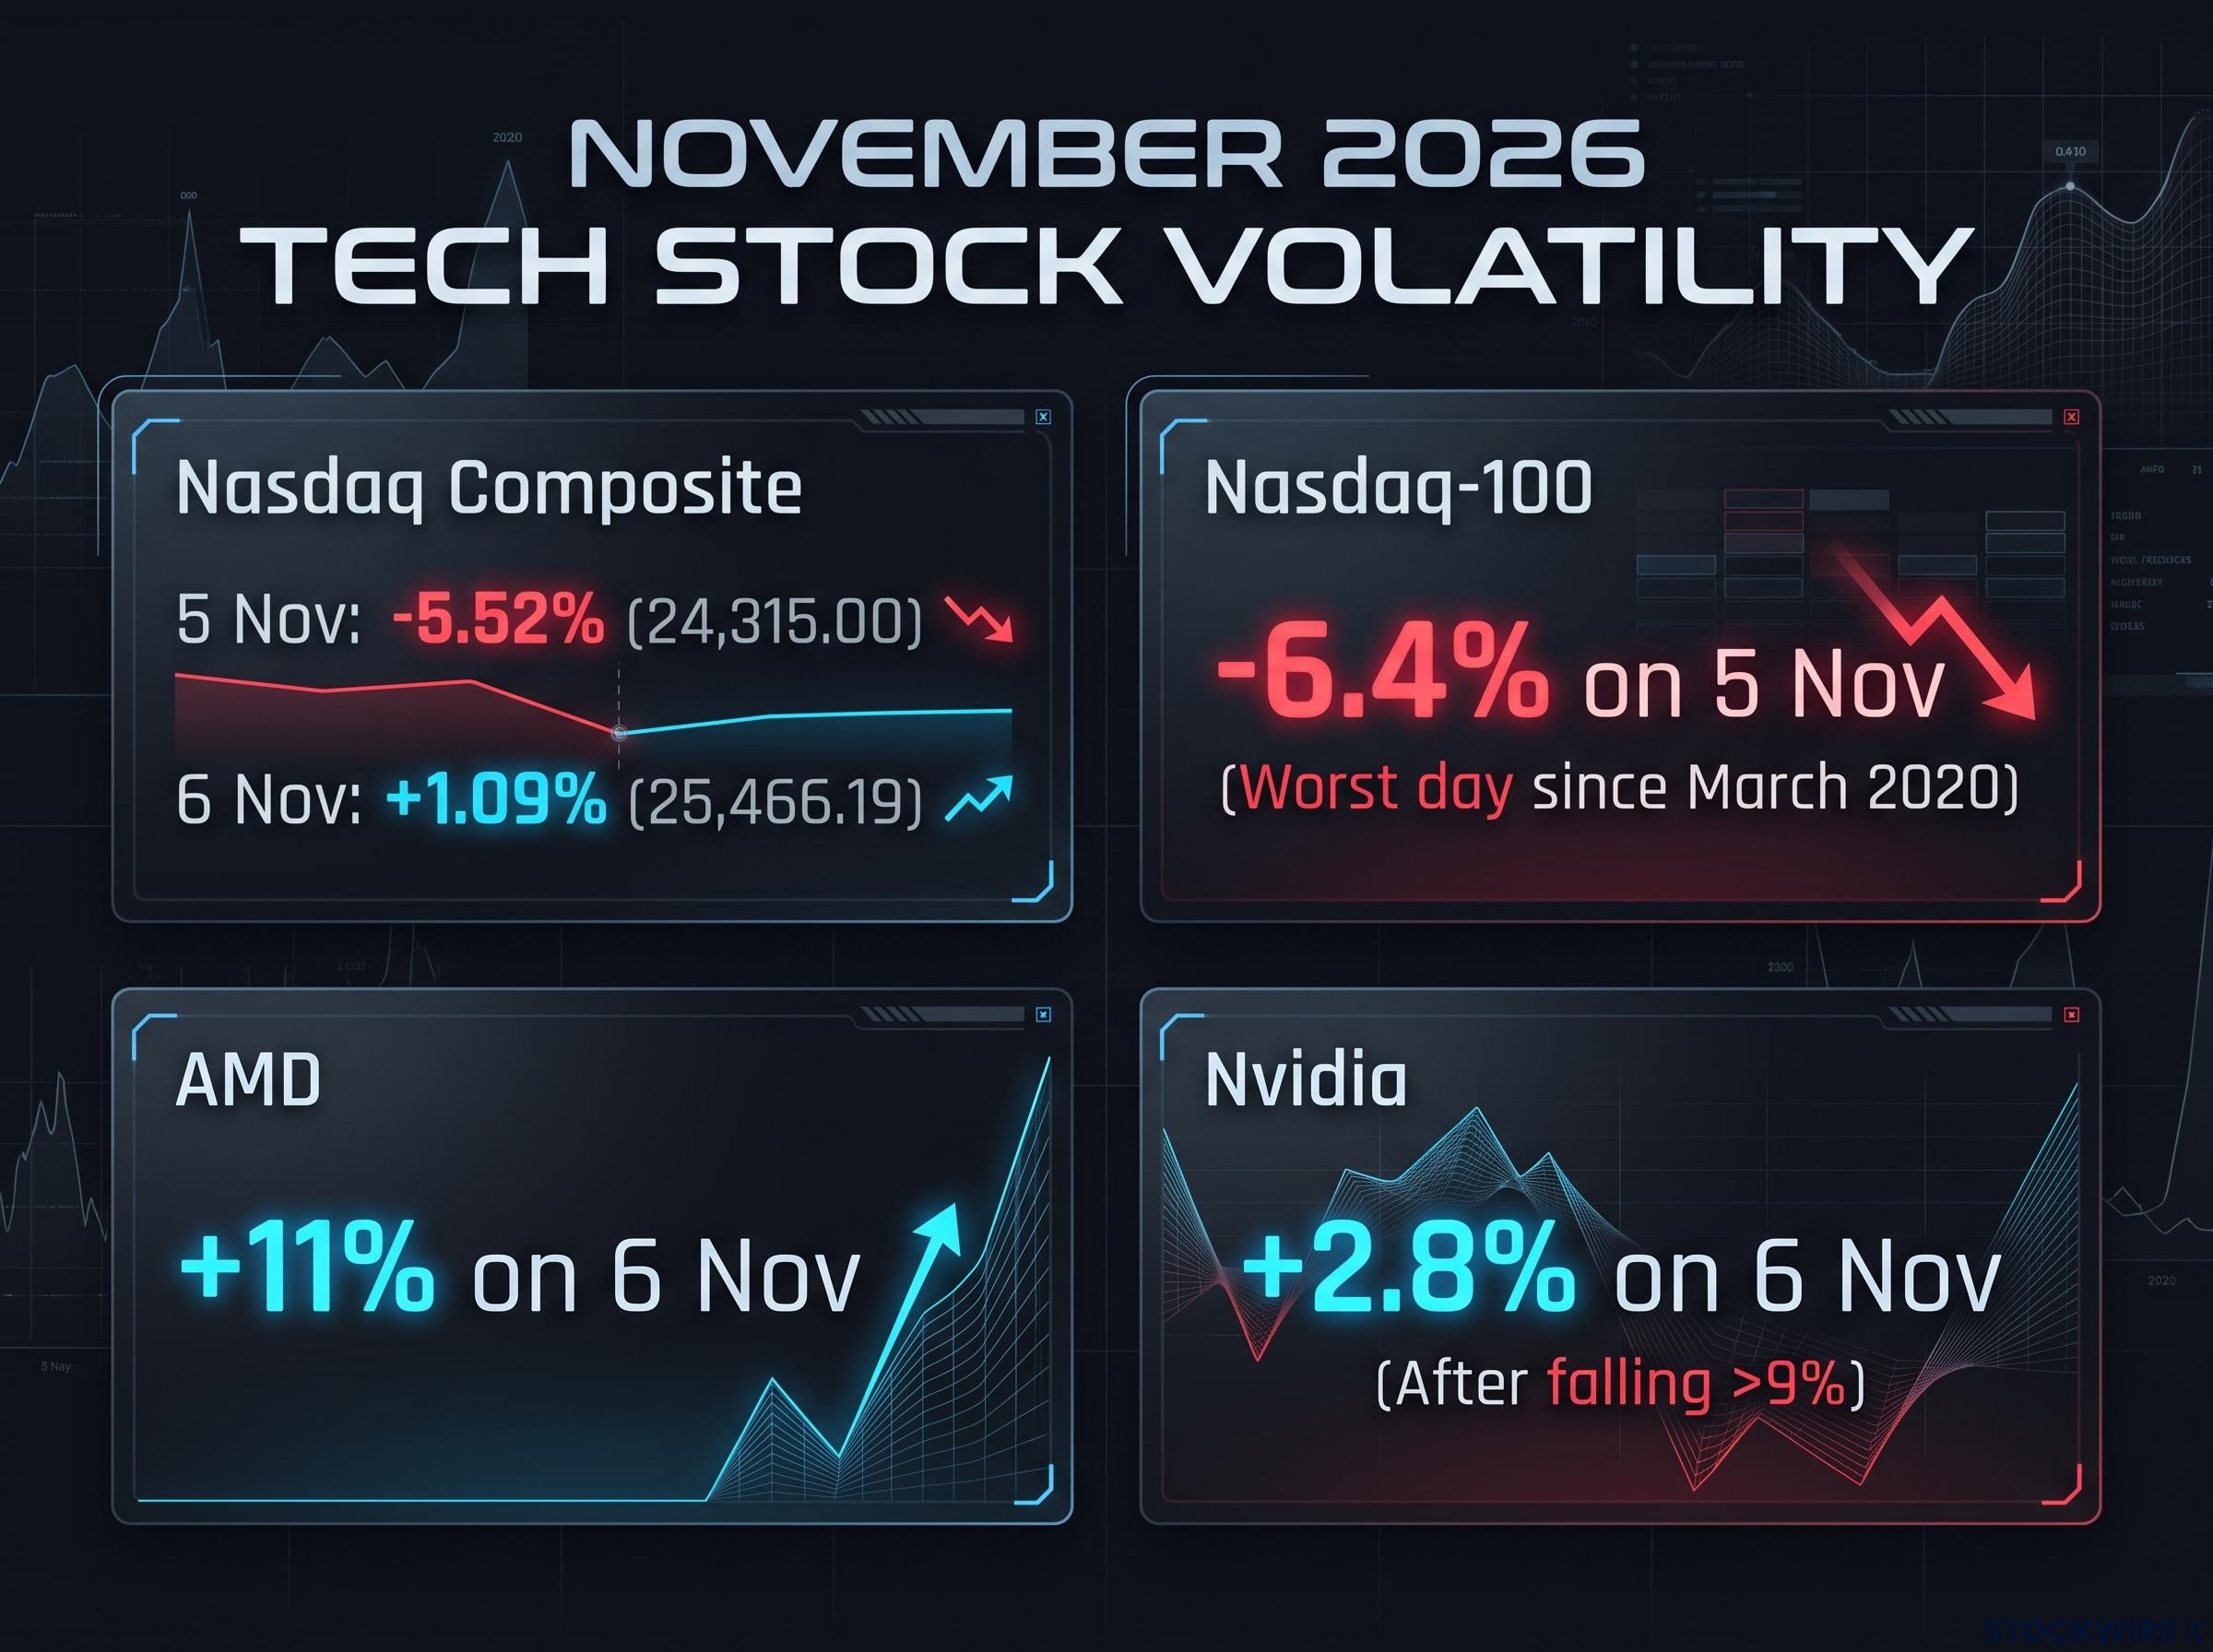
Dashboard of Nov 5-6 2026 tech volatility: Nasdaq Composite -5.52% then +1.09%, Nasdaq-100 -6.4%, AMD +11%, and Nvidia +2.8% after ></a>9% drop.”></p>
<p><em>The November 5-6 volatility saw the Nasdaq Composite swing from a 5.52% drop to a 1.09% gain, with massive rebounds in AMD (+11%) and Nvidia (+2.8%).</em></p>
<div class=

Measure Date Move Context
Nasdaq Composite 5 Nov 2026 -5.52% Closed at 24,315.00
Nasdaq-100 5 Nov 2026 -6.4% Worst day since March 2020
Philadelphia Semiconductor Index (SOX) 5-6 Nov 2026 Fell more than 12%, then +4.2% Lowest level in more than six months on the fall
Nvidia 6 Nov 2026 +2.8% After falling more than 9%
AMD 6 Nov 2026 +11% Led the rebound

One detail needs flagging. The original market discussion cited a gain of about 2.8% on its day of recording, while closing data show the Composite up 1.09% on 6 November. The two may refer to different sessions or indices, and the gap remains unresolved.

The pattern beneath the numbers is the uncomfortable part. The rally is strongest in semiconductors and AI infrastructure, the high-beta groups that fell hardest. Reuters described tech gains as “broadly shared”, but no full advance-decline count supports that.

The chip stocks rebound has been split by fundamentals: AMD’s record data centre revenue supported the AI demand case, while Apple’s memory cost warning showed that chip scarcity is a direct expense for hardware makers.

Commentators are split on what comes next.

“The market is oversold but first has to find a floor,” was the view of Keith Lerner of Truist, who also described a “buyers’ strike” and warned the downside could stretch further.

Morgan Stanley and UBS took the other side, calling the AI selloff overdone. Morgan Stanley argued regulation might push some data-centre projects from 2028 to 2029 rather than derail the capex cycle.

Meanwhile, the concerns that triggered the fall remain open as of today:

  • AI valuations and the cash-flow consequences of the AI trade
  • Data-centre financing pressure on neocloud firms such as CoreWeave and Nebius
  • The risk that a Democratic-controlled Congress slows data-centre construction
  • The timing of GPU and memory demand

For you, that means this bounce is better read as short covering and relief than as evidence of broad risk appetite.

What would confirm a recovery, and what do past rebounds teach?

If the rally’s quality is the question, the answer lies in a handful of signals you can check this week.

  1. Semiconductor participation: chip ETFs such as SMH should keep rising alongside the index, not just bounce once.
  2. Neocloud strength: a sustained rally in providers like CoreWeave would ease fears about GPU and memory demand.
  3. Support holds: the index should stay above its 16 September and mid-October lows.
  4. Reclaiming the breakdown area: a series of higher highs and higher lows, not another lower high.
  5. Fundamentals holding: stable credit and volatility, with earnings and capex estimates intact.

For perspective, the 2026 low sits at 20,794.64, set on 30 March.

Lessons from 2008 and April 2025

On 9 April 2025, the Nasdaq Composite jumped 12.16% to 17,124.97 after a 90-day tariff pause, its biggest one-day gain since January 2001. It followed more than 12% of losses after the 2 April tariff announcement. That was a policy-driven repricing, where the catalyst itself was removed.

In 2008, the outcome was different. A roughly 12% rally on 13 October and a strong bounce around Thanksgiving both faded, and the market did not bottom until March 2009.

Episode What happened Lesson
2000-2002 dot-com bust Large rallies inside a prolonged valuation unwind Big up days can occur in long downtrends
2008 financial crisis Strong bounces faded; bottom in March 2009 Extreme rebounds can coexist with systemic stress
2020 pandemic Benchmark for the 5 Nov 2026 volatility A volatility comparison, not a fundamental one
April 2025 tariff shock +12.16% day after a policy reversal Relief tied to a resolved catalyst

The difference between the two is whether the cause of the fall was resolved. Small samples, shifting definitions and selection bias all limit these comparisons, so treat confirmation as something earned over weeks: let your conviction rise with each signal met, not with one strong day.

Readers weighing the dot-com parallel can use our deep-dive into the semiconductor supercycle debate, which tests whether record earnings justify the earlier run-up.

What the bounce proves, and the signals that will settle it

The history supports a positive short-term tendency after sharp Nasdaq falls, not a reliable forecast. On current evidence, this rebound reads as a high-conviction oversold relief rally.

It earns the V-shaped label only if three things happen. Semiconductors must keep participating, the index must reclaim its breakdown area while holding the September and October lows, and the financing and capex concerns must be resolved rather than postponed.

Until then, patience is the stance the data supports.

Past performance does not guarantee future results. Financial projections are subject to market conditions and various risk factors.

This article is for informational purposes only and should not be considered financial advice. Investors should conduct their own research and consult with financial professionals before making investment decisions.

Frequently Asked Questions

What is a dead cat bounce in the Nasdaq?

A dead cat bounce is a short-lived rise in a falling market where prices recover briefly, then resume their decline. A V-shaped recovery, by contrast, is a sharp fall followed by an equally sharp and lasting climb back toward previous highs.

How often does the Nasdaq keep falling after a 13% drop in 22 trading days?

Since 1986 the Nasdaq has fallen 13% within 22 trading days 47 times, and in 57.4% of those cases it dropped another 5% or more within the following month. Three months on, only 53.2% of episodes were positive, close to a coin flip.

How can you tell a dead cat bounce from a real recovery?

Check breadth, volume, semiconductor participation and price structure: a real recovery shows improving advance-decline breadth, higher highs and higher lows, and a reclaim of the breakdown area. Narrow breadth, weak volume and lower highs point to a dead cat bounce.

Why is the November 2026 Nasdaq rebound being questioned?

The rally is concentrated in semiconductors and AI infrastructure, the high-beta groups that fell hardest, and no full advance-decline count confirms broad participation. The AI valuation, data-centre financing and GPU demand concerns that triggered the selloff also remain unresolved.

What signals would confirm the Nasdaq recovery is durable?

Confirmation needs semiconductor ETFs such as SMH to keep rising, sustained strength in neocloud names like CoreWeave, and the index holding above its 16 September and mid-October lows. It also needs higher highs and higher lows, with stable credit, volatility, earnings and capex estimates.

John Zadeh
By John Zadeh
Founder & CEO
John Zadeh is an investor and media entrepreneur with over a decade in financial markets. As Founder and CEO of StockWire X and Discovery Alert, Australia's largest mining news site, he's built an independent financial publishing group serving investors across the globe.
Learn More

Breaking ASX Alerts Direct to Your Inbox

Join +20,000 subscribers receiving alerts.

Join thousands of investors who rely on StockWire X for timely, accurate market intelligence.

About the Publisher