Canada’s headline inflation is running at 3.1%, and the Bank of Canada has just raised rates for the first time since 2023. On paper, that should be lifting the Canadian dollar. Instead, USD/CAD is holding near 1.4250, and the forecast for the pair still leans higher.
The reason is that several things changed within days of each other. US inflation for October came in hot, and markets now treat a December Federal Reserve hike as close to certain. Canada’s October jobs report missed badly. Oil has slid sharply as Middle East tensions cooled.
Here is which of those forces is doing the most work, how the major banks read them, and what would have to change for the pair to turn lower.
Why is the Fed pulling USD/CAD higher?
It started with the US consumer price index (CPI), the main measure of how fast consumer prices are rising. Headline CPI rose 0.4% in October against a 0.3% consensus. Core CPI, which strips out volatile food and energy, rose 0.3% against 0.2% expected.
Traders responded by lifting their bets on a December rate hike. CME FedWatch, a tool that converts futures prices into rate probabilities, showed 90.5% odds of a 25 basis point hike in December (as of 12 November), according to Cboe. A basis point is one hundredth of a percentage point, so 25 bp equals 0.25%.
Fed Governor Christopher Waller had already set out the terms earlier in the week.
Waller’s conditional stance Waller said the Fed should raise rates by at least 25 bp in December even if October inflation cooled, and should consider 50 bp if core CPI held around 0.3% or higher.
Core then printed exactly 0.3%. You might expect the odds of a bigger move to jump. They fell.
| December Fed outcome | 10 November | 12 November |
|---|---|---|
| 25 bp hike | 85.3% | 90.5% |
| 50 bp hike | 14.7% | 9.5% |
What this tells you is that the market is not bracing for a Fed shock. It is pricing a near-certain, orthodox hike. Much of the US dollar’s support is therefore already in the price, and further upside needs fresh hawkish information rather than more of the same.
December Fed hike odds were also lifted by a strong US payrolls print, and with energy-led supply inflation behind much of the price pressure, a December hold would now be the bigger surprise.
When big ASX news breaks, our subscribers know first
Can Canada’s inflation and the Bank of Canada hold the line?
Inflation and the October hike
The Canadian side looks supportive at first glance. Annual inflation rose to 3.1% in September from 3.0% in August, and the Bank of Canada (BoC) lifted its overnight rate 25 bp to 2.50% on 28 October.
Look underneath and the picture changes. Gasoline prices were up 27.8% year on year. Strip them out and inflation was 2.2%. The BoC’s preferred core measures, CPI-trim and CPI-median, which filter out the most extreme price moves, sat at 1.8% and 1.9%. Both are inside the bank’s 1-3% target range.
The jobs miss
Then came the October Labour Force Survey on 6 November. Canada lost 4,700 jobs against a forecast gain of 15,000, and unemployment rose to 6.7% from 6.5%.
| Measure | Latest reading | What it signals |
|---|---|---|
| Headline CPI (Sept) | 3.1% | Above target, energy-driven |
| CPI ex gasoline | 2.2% | Near target |
| CPI-trim / CPI-median | 1.8% / 1.9% | Below 2% |
| Unemployment (Oct) | 6.7% | Rising |
| Wage growth (Oct) | 2.2% y/y | Slowing |
The detail was weaker still: full-time jobs fell 18,100 and private-sector employment dropped 52,500. TD Securities argues that rising unemployment and slowing wages weaken the case for further BoC tightening, leaving the Canadian dollar vulnerable and USD/CAD supported above 1.40.
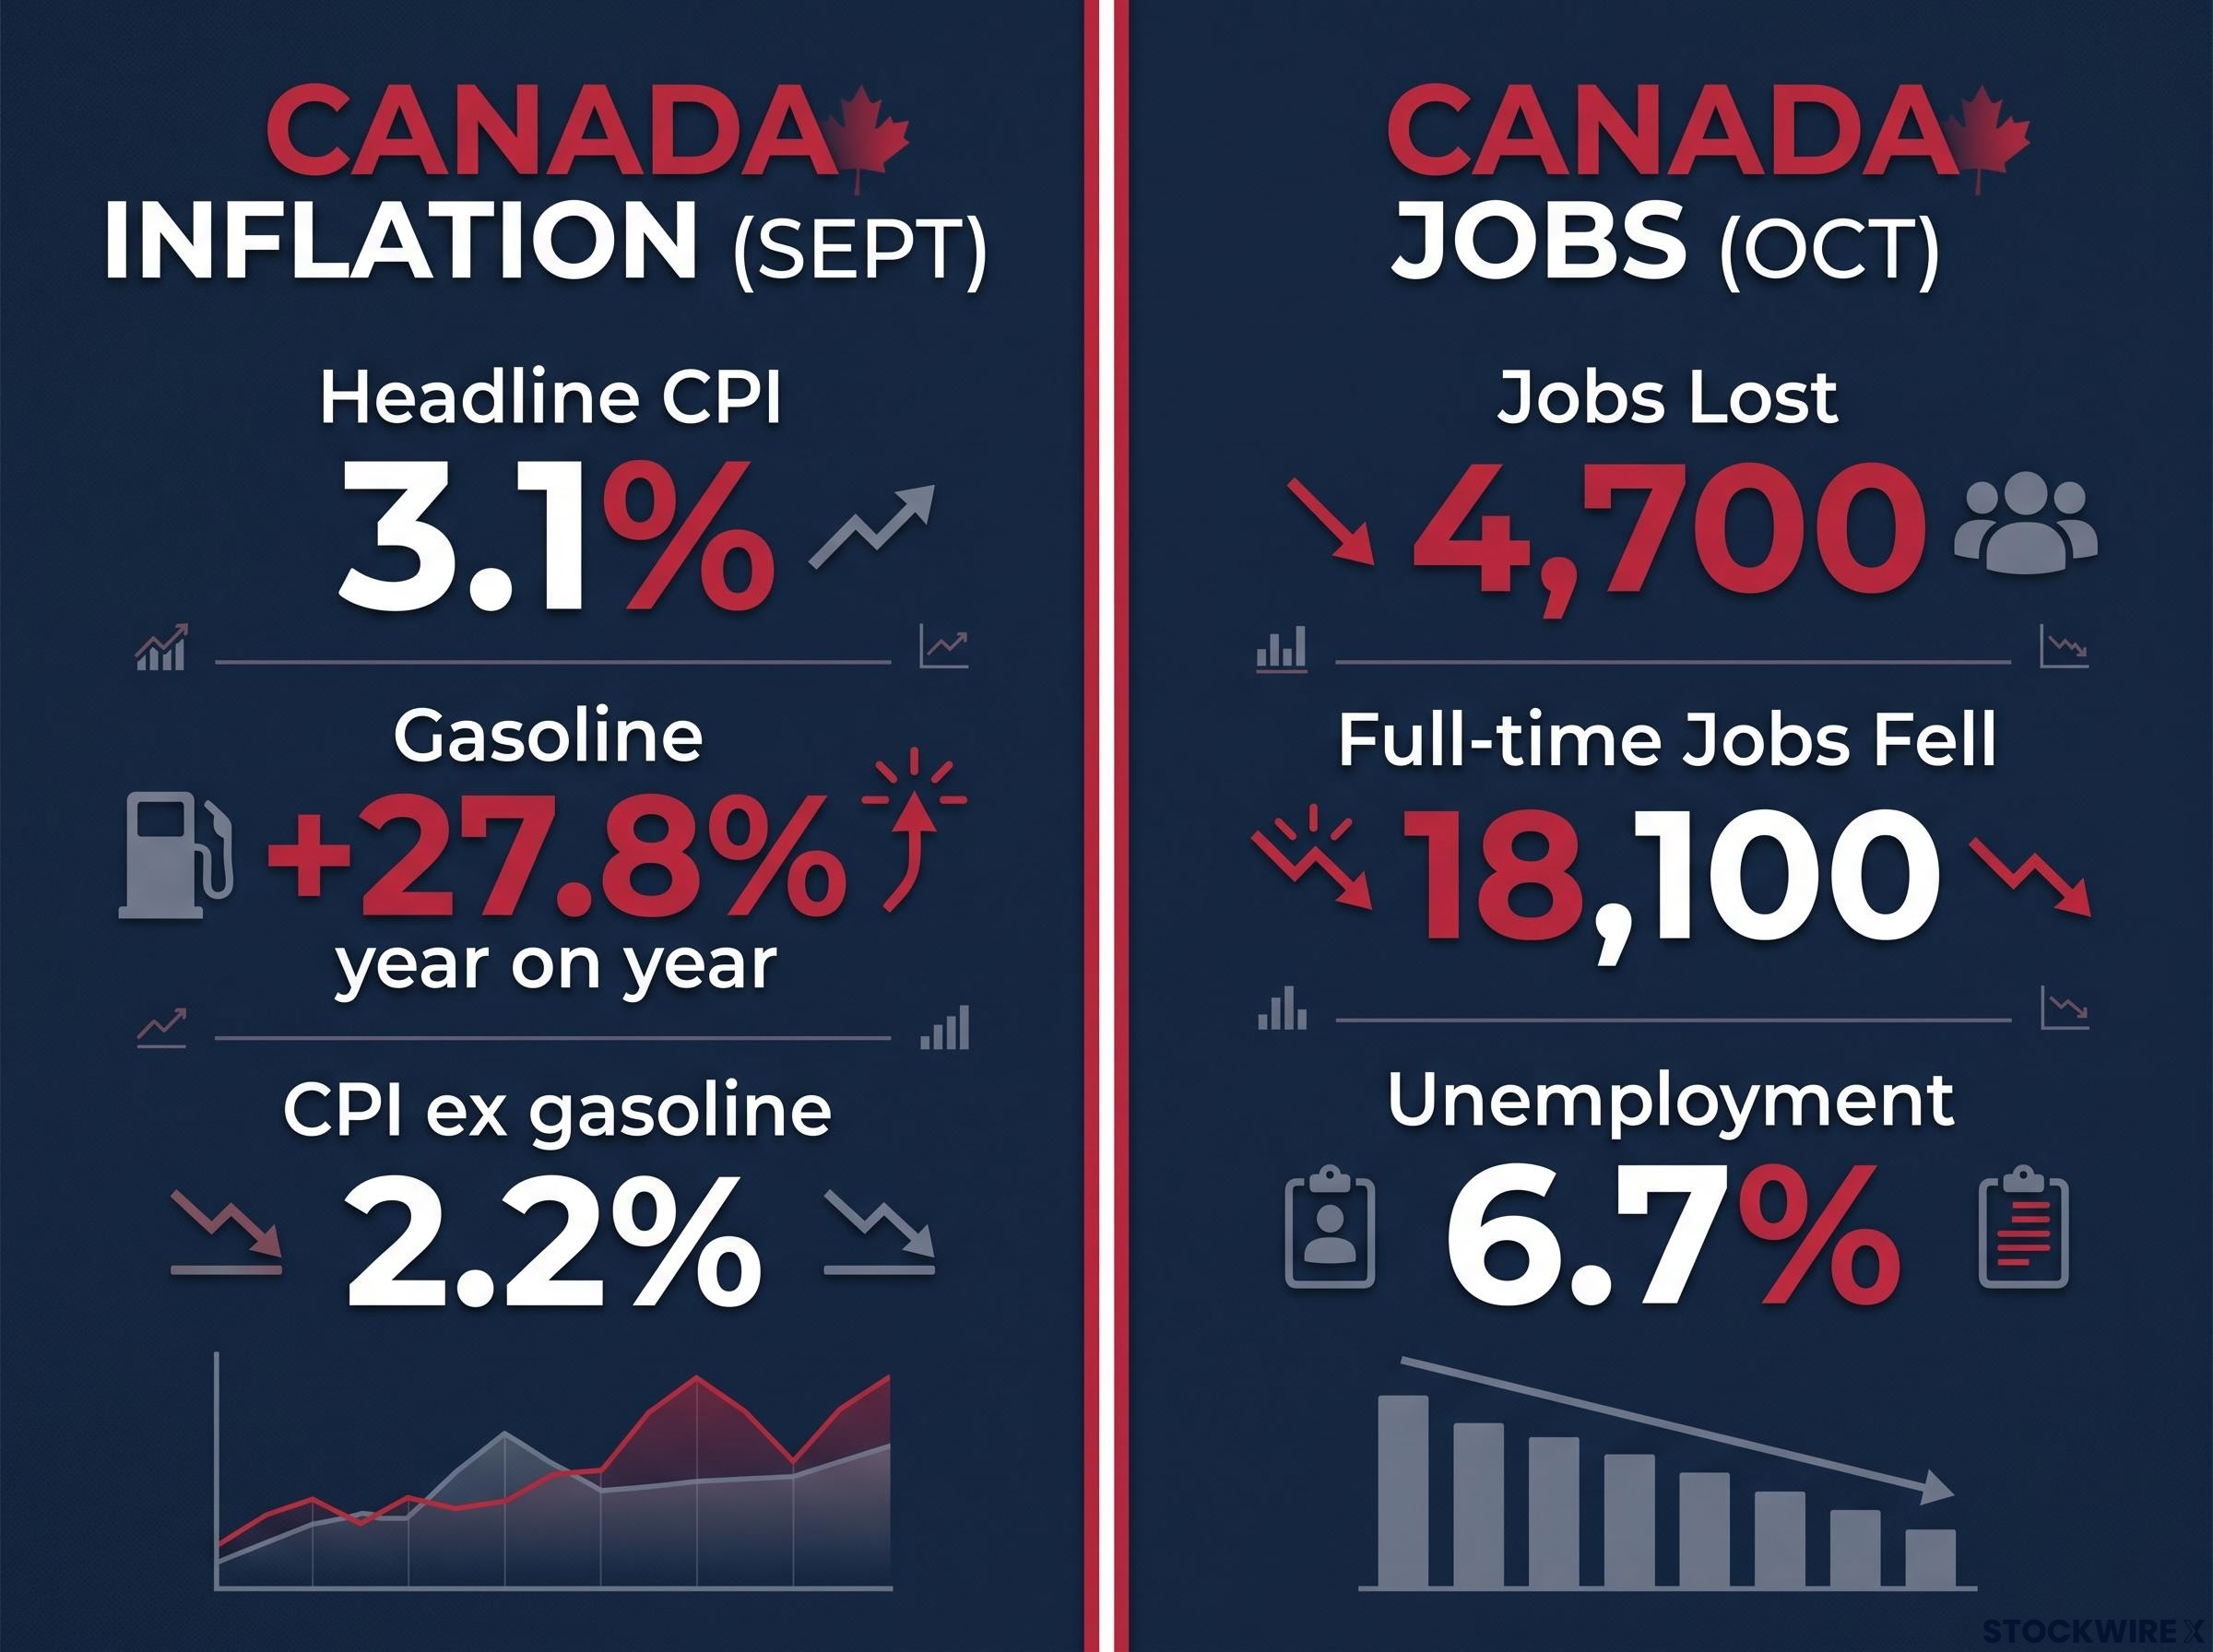
Despite headline CPI sitting at 3.1% driven by a 27.8% year on year gasoline increase, the loss of 4,700 jobs and 6.7% unemployment complicate BoC policy.
For you, the read is that Canada’s inflation support is largely an energy artefact. A hawkish BoC is not a safe assumption, and the rate gap with the Fed could widen rather than narrow.
How is falling oil weighing on the Canadian dollar?
Oil is Canada’s largest export, so crude prices feed directly into demand for its currency. And crude has fallen hard.
The November slide West Texas Intermediate (WTI) crude fell about 18% in November through 10 November, as the US and Iran stepped back from further escalation.
That unwound much of the war-risk premium, the extra price traders pay for crude when supply might be disrupted. Current spot levels for Brent and WTI were not available at the time of writing.
The supply side is adding pressure. The OPEC Monthly Oil Market Report, published on 11 November, showed:
- OPEC+ crude output of 41.23 million barrels per day (mb/d) in October
- A monthly increase of 2.04 mb/d
- Saudi output of 10.563 mb/d, up 2.191 mb/d from 8.372 mb/d
The Saudi figure comes from direct reporting to OPEC; secondary-source estimates put it nearer 9.19 mb/d, a different measurement series. Some bank commentary suggests a sustained 10% fall in crude has historically lined up with roughly 2-3% USD/CAD upside, though treat that as a loose rule of thumb, not a certainty.
The takeaway is that oil is working alongside the Fed, not against it. An oil rebound is the single most plausible brake on further USD/CAD gains.
OPEC’s declining pricing power, with the cartel now controlling only about 27-28% of global crude supply, limits how far coordinated output decisions can steer prices and so how reliably oil can brake further USD/CAD gains.
Where do the banks disagree on the USD/CAD forecast?
End-2026 targets span roughly 1.34 to 1.43, and the cross-bank December median sits near 1.36. The pair, near 1.4250, is already well above that middle.
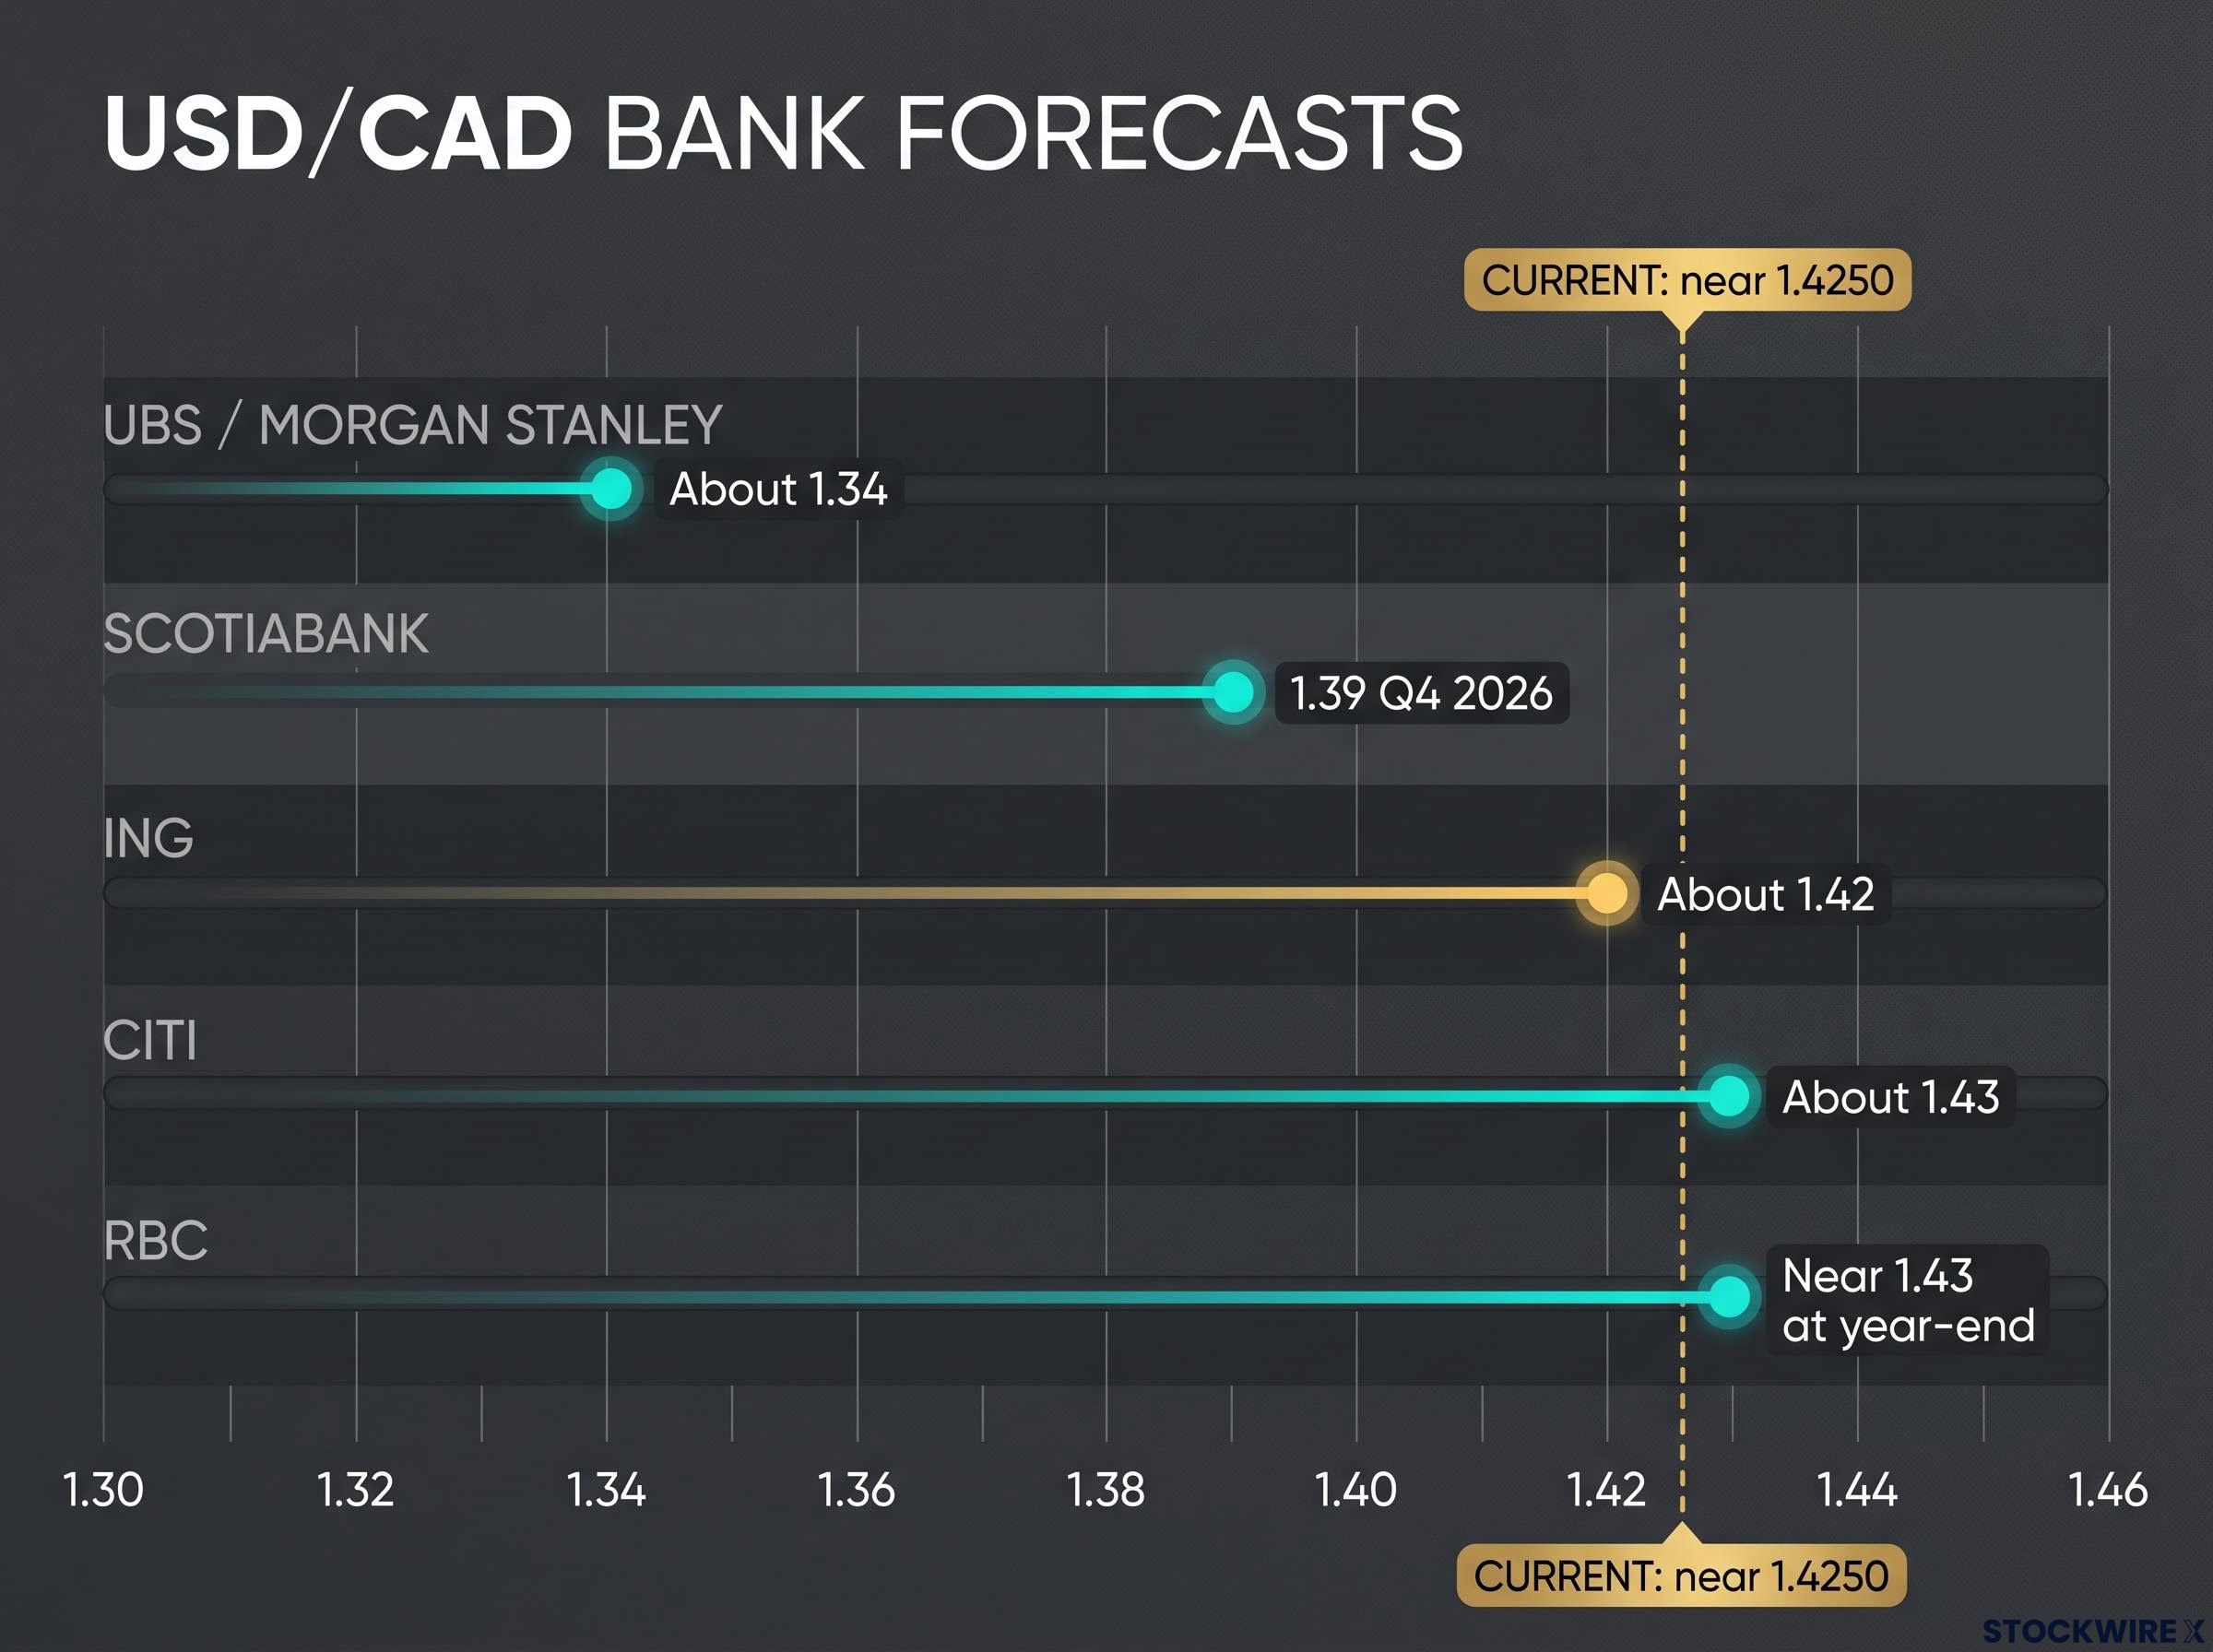
With the current rate near 1.4250, bank forecasts diverge widely from RBC near 1.43 at year-end down to UBS and Morgan Stanley at about 1.34.
| Institution | View | Reasoning |
|---|---|---|
| TD Securities | Supported above 1.40 | Diverging labour data, lower BoC hike pricing |
| RBC | Near 1.43 at year-end | Fed hikes in December and March 2027 |
| Citi | About 1.43 | Wide policy gap, weak CAD recovery |
| ING | About 1.42 | Limited near-term CAD recovery |
| MUFG | 1.42 Q4 2026, 1.36 Q3 2027 | USD strength first, then a less hawkish Fed |
| Scotiabank | 1.39 Q4 2026, 1.34 Q4 2027 | Hawkish BoC, improving trade talks |
| BMO | Faster CAD recovery than RBC | Quicker Canadian dollar rebound |
| UBS / Morgan Stanley | About 1.34 | Policy and trade normalisation |
Not every primary note is public, so some positions rely on published commentary or secondary reporting. Read closely, though, and the split is about timing. TD, RBC, ING and Citi focus on the immediate hit from hot US inflation and weak Canadian jobs. Scotiabank, MUFG, BMO, UBS and Morgan Stanley look further out, to the end of the Fed cycle.
With the pair above the median, the market already leans toward the near-term camp. Rather than assuming continuation, watch the five triggers that could shift it:
- Dovish Fed surprise: a 25 bp hike with no further moves signalled, or softer US data.
- Oil rebound: renewed Middle East disruption, stronger demand or reversed OPEC+ supply.
- Hawkish BoC pivot: gasoline effects spreading into core inflation.
- Trade improvement: a US-Canada agreement or lower tariff uncertainty.
- Crowded positioning: heavy long-USD bets unwinding quickly.
Past performance does not guarantee future results. Financial projections are subject to market conditions and various risk factors.
What drives the Canadian dollar? A framework for reading future moves
No single factor sets USD/CAD. A handful of drivers push and pull, and the strongest moves come when they line up.
Cyclical drivers
The biggest is relative interest rates. When US rates rise while Canada’s hold, the yield spread (the gap between the two countries’ bond returns) widens, and capital tends to flow toward US dollar assets. Oil, economic data such as GDP, employment and purchasing managers’ indexes, and inflation all feed into that rate outlook. Risk sentiment matters too: the Canadian dollar usually does better when investors are confident.
| Driver | CAD-positive when | CAD-negative when | Current signal |
|---|---|---|---|
| Fed policy | Fed eases or pauses | Fed hikes | Hawkish |
| BoC policy | BoC tightens | BoC holds or eases | Cautious |
| Oil prices | Crude rises | Crude falls | Falling |
| Canadian data | Jobs and growth strong | Jobs and growth weak | Weak |
| US-Canada trade | Tariff risk eases | Restrictions grow | Tone improving, per Scotiabank |
Structural drivers
Beneath the cycle sit slower forces: Canada’s tight integration with the US, its largest trading partner, a resource-heavy export base and the bilateral trade relationship. These keep the currency sensitive to US demand and energy prices regardless of the month’s data.
US oil dominance means higher crude prices now recirculate income through the domestic economy rather than abroad, a structural shift that sits beside Canada’s resource-heavy export base in shaping how the two currencies respond to energy.
The 2022 episode shows how the layers interact. After Russia invaded Ukraine, WTI briefly reached about US$130, yet the Canadian dollar gained little because aggressive Fed tightening lifted the US dollar. Oil does not automatically beat a large rate advantage.
Today is close to the reverse of 2022’s best case for Canada: oil falling, the Fed hiking and Canadian jobs weakening. When most drivers point the same way, as now, moves tend to run further, and the reversal triggers matter more.
Reading the next move: what would confirm or break the bullish bias
The near-term evidence lines up behind a bullish bias near 1.4250: hot US inflation, 90.5% pricing for a 25 bp December hike, a weak Canadian labour market and falling crude. Most medium-term forecasts still point toward a Canadian dollar recovery.
Your watch list is short:
- The December FOMC decision and its guidance on further hikes
- Canada’s next jobs and inflation releases, especially core measures
- Oil prices and OPEC+ output
- US-Canada trade headlines
The near-term and medium-term camps can both be right. They disagree on timing, not direction, so the question for you is which of these signals arrives first.
With Chair Kevin Warsh scrapping forward guidance, repricing risk concentrates in single speeches and inflation prints, so the 2-year Treasury yield and the next data release carry more weight than any Fed signal.
This article is for informational purposes only and should not be considered financial advice. Investors should conduct their own research and consult with financial professionals before making investment decisions.