Brent crude fell nearly 3.89% in a single session on 25-26 August 2026, breaking below $90 per barrel on diplomatic signals out of the Persian Gulf. That is a large, fast move for a commodity that underpins global inflation, shipping costs, and energy budgets across every major economy.
The price drop reflects a rational but potentially premature removal of geopolitical risk premium from crude. Talks involving Iran, Oman, and Pakistan raised hopes that tanker traffic through the Strait of Hormuz could normalise. Markets moved quickly. The structural obstacles that actually determine whether more Iranian oil reaches global buyers, namely US sanctions and contested throughput figures, moved not at all.
Here is what the price move reflects, why three compounding constraints limit its durability, and which specific indicators will tell you whether the decline holds or reverses. The data dispute at the centre of this story is especially consequential: if the market assumed the wrong baseline for Hormuz flows, the supply upside it just priced in may not exist.
How a diplomatic signal removed $3.50 from the barrel price
Geopolitical risk premium is the additional cost embedded in commodity prices to account for the probability that a supply disruption will worsen. In the weeks before 25 August, that premium had been elevated by a specific set of threats around the Strait of Hormuz: vessel attacks near the chokepoint, rhetoric about closure, and the absence of any credible diplomatic framework to de-escalate.
ING analysts Warren Patterson and Ewa Manthey had previously noted that Middle East tensions and Hormuz attacks were a primary reason Brent was trading near or just below $90 prior to the diplomatic signals.
Then the signals arrived. Regional reports described emerging understandings between Iran and Oman on new shipping arrangements and a partial reopening of the strait, with Pakistan also involved in broader discussions. Traders responded by reassigning lower probability to the tail-risk scenarios that had justified the premium:
- Full blockade of the strait: Previously a low-probability but high-impact scenario; diplomatic progress made it less plausible.
- Extended shutdown of transit routes: The emerging shipping arrangements suggested at least partial reopening, reducing the perceived likelihood of a prolonged halt.
- Further vessel strikes: Ongoing talks implied a de-escalation of hostilities, lowering the near-term probability of additional attacks on tankers.
By the close of the session, ICE Brent had shed 3.89%, finishing beneath the $90 per barrel mark. The selling extended through early Asian trading on 26 August, a distinct feature of how commodity markets process geopolitical news: the initial repricing triggers algorithmic and momentum-following flows that extend the move beyond what the headline alone would justify.
The speed and size of this decline tells you something specific about market structure. A commodity that had pre-loaded significant risk premium was always going to produce a sharp, fast unwind on a credible headline, regardless of whether the underlying problem was resolved. The move reflects sentiment repricing, not a physical change in supply.
Sanction credibility pricing has become a distinct market dynamic in 2026: the 25 August session itself saw Brent fall 2.4% after Treasury Secretary Bessent’s ‘economic D-Day’ declaration, as traders discounted the absence of named entities, enforcement timelines, or specific targeted volumes rather than the severity of the rhetoric.
Academic research on geopolitical risk and oil price dynamics shows that commodity markets systematically embed forward-looking probability distributions into price levels, meaning a credible de-escalation headline can produce an outsized and sometimes overshooting repricing even before physical supply conditions change.
When big ASX news breaks, our subscribers know first
Why regional diplomacy cannot unlock Iranian oil on its own
The diplomatic signals were genuine. Iran and Oman discussed new shipping arrangements and partial strait reopening. Pakistan was part of the broader conversation. Markets treated this as the beginning of normalisation.
What the talks represent, however, is narrower than what the price move implied. Bilateral and trilateral agreements between regional actors can address maritime signalling, shipping protocols, and local de-escalation. They cannot override the legal and financial architecture of US sanctions on Iranian oil exports, which remains the primary determinant of whether Iranian crude can flow to global buyers at scale.
ING analysis makes this distinction explicitly: local diplomacy is a necessary but insufficient condition. Without Washington relaxing sanctions and lifting effective restrictions on Iranian terminals, the financial barriers limiting Iran’s export capacity remain intact. Market commentary describes participants as “pinning hopes on a deal between the US and Iran,” meaning the regional understandings, however promising, cannot unlock full volumes on their own.
The Iran sanctions architecture that makes regional diplomacy insufficient operates through a mechanism that extends well beyond US-headquartered firms: the dollar-clearing system converts Washington’s designations into a global compliance mandate, meaning non-US banks, shipowners, and insurers must voluntarily comply or lose access to the US financial system entirely.
The timing compounds the constraint. Even as regional talks advanced in late August 2026, reporting noted stepped-up US economic pressure on Iran running concurrently, with no indication that Washington was preparing sanctions relief or endorsing a broader Gulf energy framework.
The three conditions that headline coverage missed
For Iranian exports to materially increase, three conditions would need to be met:
- US sanctions relief or formal easing. The legal prohibitions on purchasing Iranian crude and using Iranian port infrastructure would need to be relaxed through executive action, a waiver programme, or a negotiated agreement. Regional diplomacy cannot substitute for this.
- Port restrictions lifted or modified. Even with sanctions relief, the operational restrictions on Iranian loading terminals would need adjustment to allow tanker access at pre-disruption volumes.
- US endorsement or non-objection to a broader Gulf energy framework. Any new shipping arrangements negotiated regionally would require at least tacit US acceptance to be commercially viable, since buyers and insurers will not participate without clarity on sanctions compliance.
None of these conditions has been signalled, announced, or visibly negotiated. The price move discounted a future event that has not materialised, meaning the relief below $90 is built on an assumption rather than a confirmed policy shift.
The throughput data dispute that changes what “normalisation” actually means
Beyond the sanctions question, there is a more immediate analytical problem: how much oil is actually moving through Hormuz right now? The answer depends on who you ask, and the gap between official and independent estimates is large enough to change the entire price thesis.
According to US Energy Secretary Chris Wright, Gulf oil transiting the Strait of Hormuz runs at roughly 8-9 million barrels per day, a figure drawn from military escort operations and official tracking data. Seven-day averages cited by US authorities approach 9 million barrels per day, with a further 5-7 million barrels per day attributed to pipelines and alternative export routes, putting total regional outflows at around 13-15 million barrels per day. US officials acknowledge the 8-9 million barrels per day level may only be sustained over short windows, a caveat that significantly narrows the confidence one should place in the headline number.
Independent tracking companies tell a materially different story. Kpler, LSEG, and other tanker analytics providers put Hormuz throughput in a range that spans roughly 2 to 6 million barrels per day, with methodology and measurement window accounting for much of the variation. Certain analyses place strait volumes as low as approximately 1.7-4 million barrels per day, with the balance of Gulf exports routed through pipelines that circumvent Hormuz altogether.
Pre-disruption Hormuz flows were typically around 20 million barrels per day, roughly one-fifth of global oil trade. Current levels, at even the most optimistic independent tracker estimates, remain well below that historical benchmark.
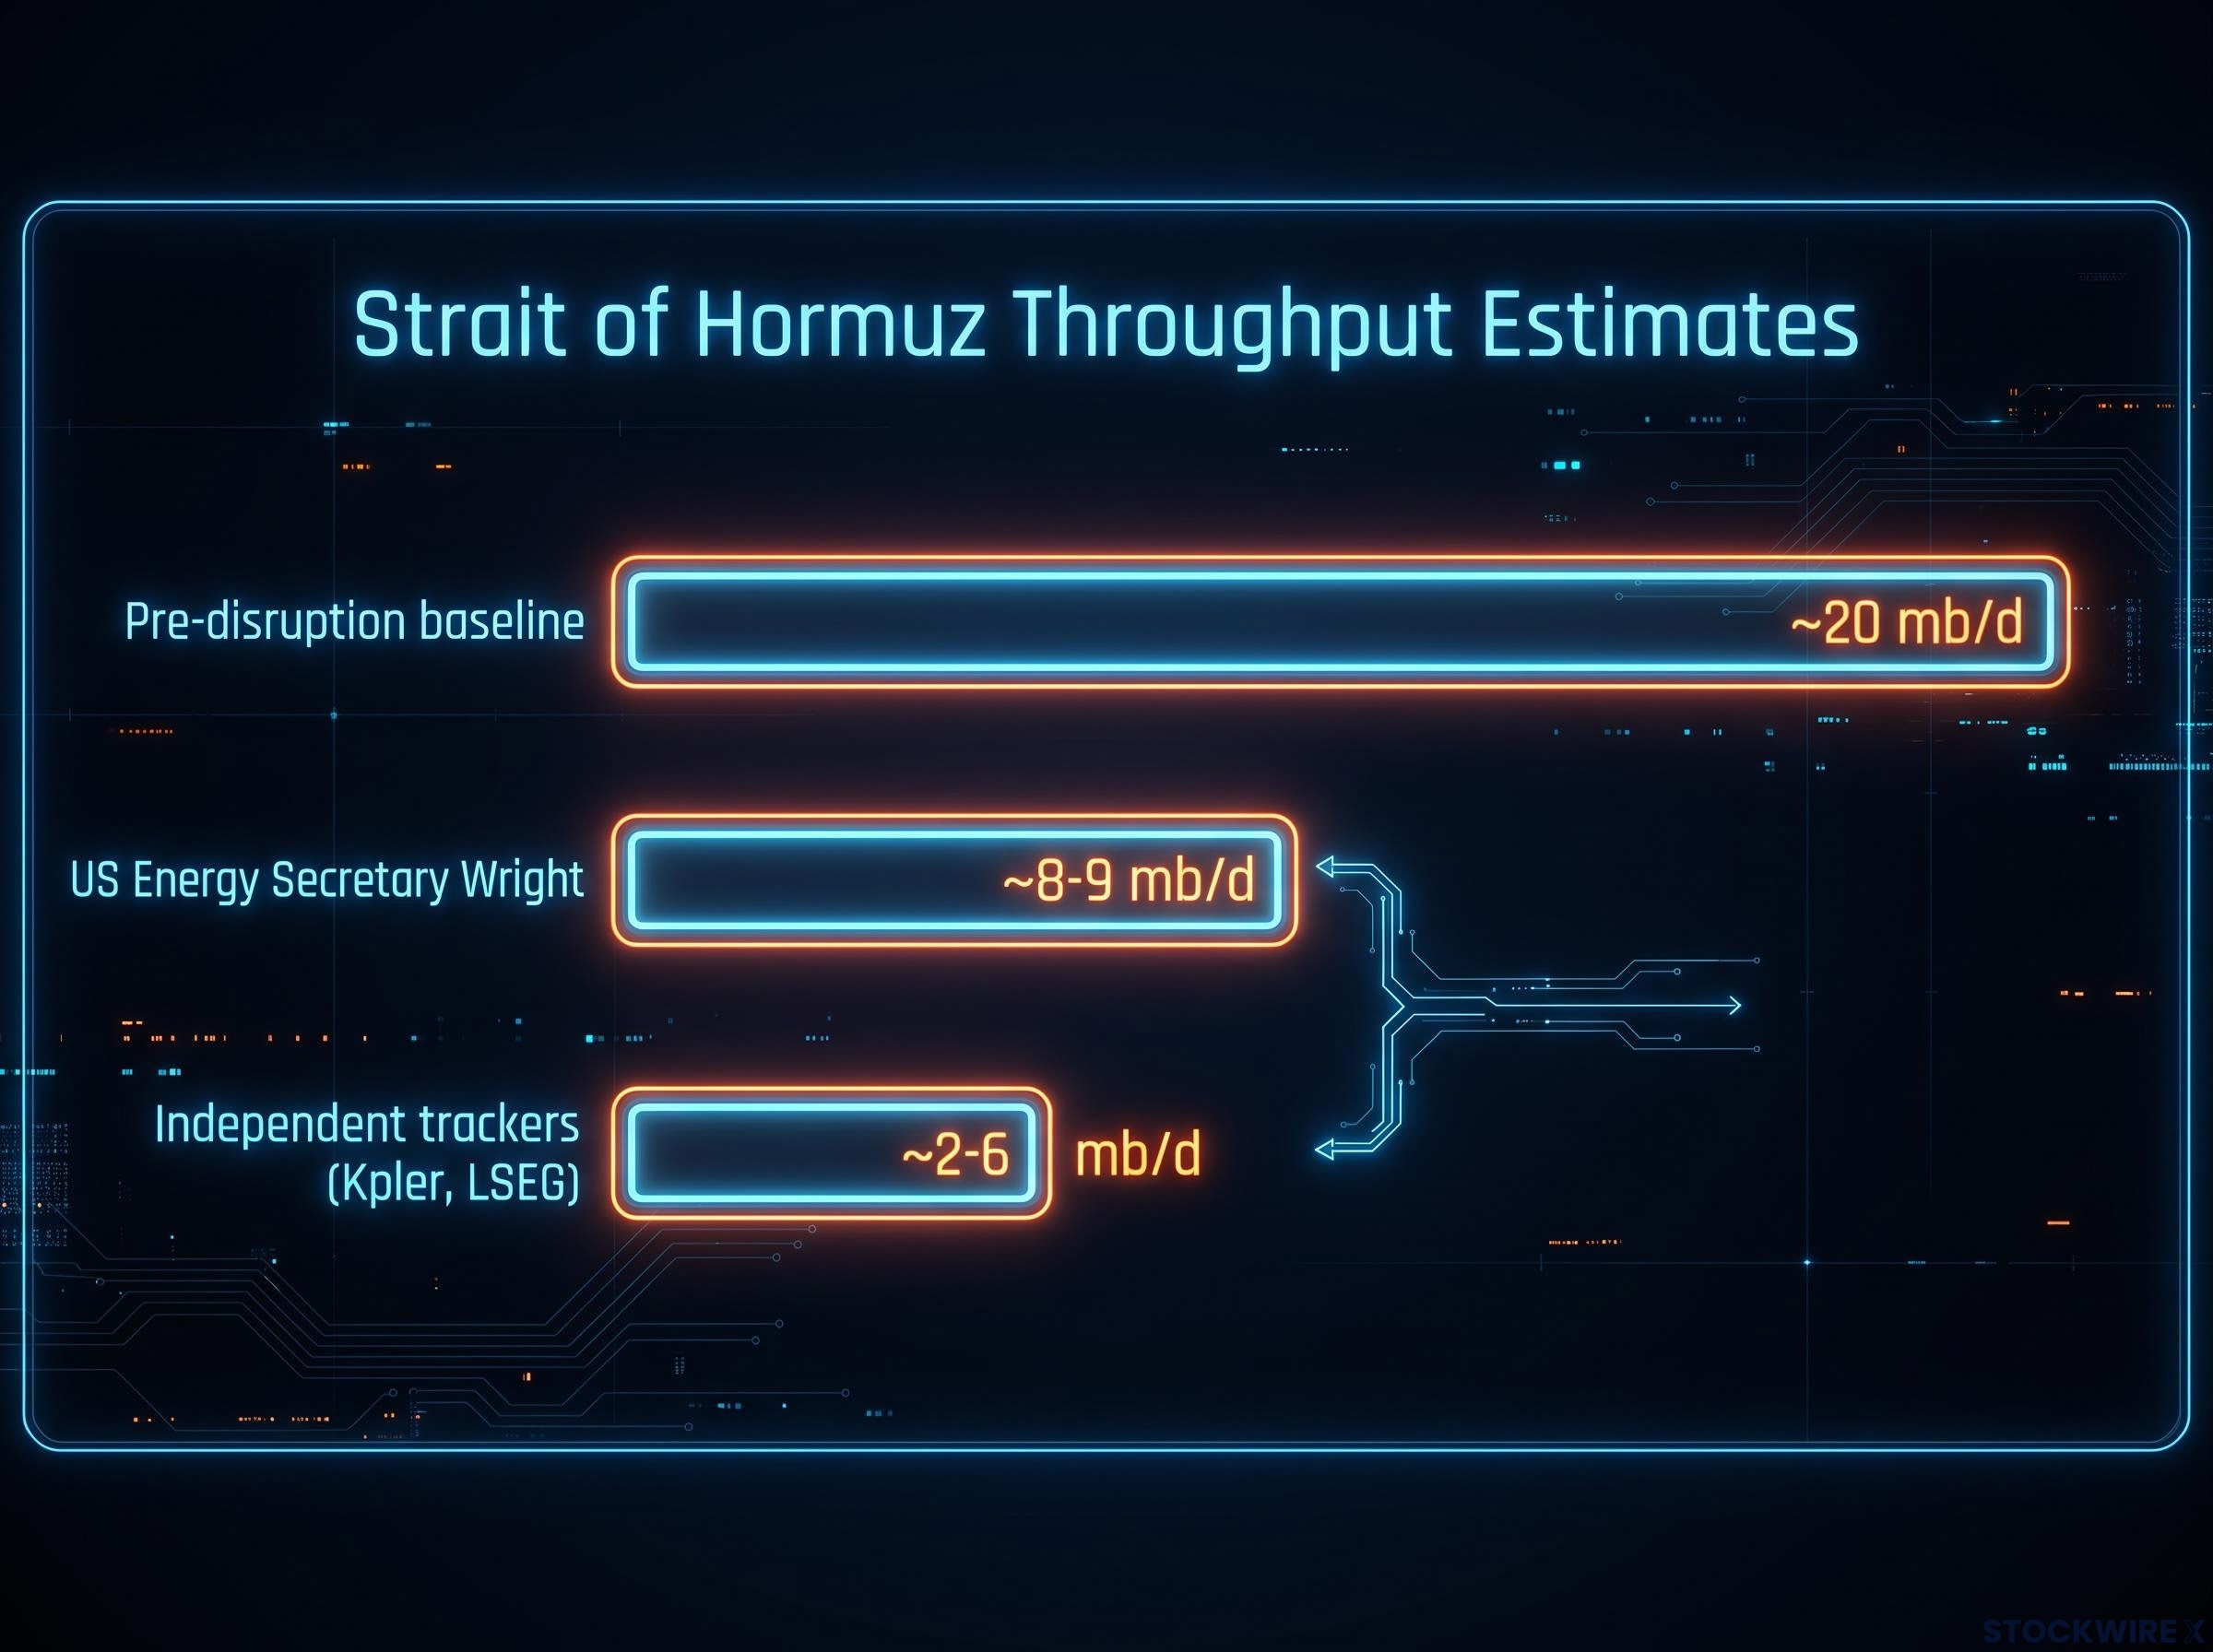
| Source | Hormuz throughput estimate | Pipeline / alt routes | Total regional outflow |
|---|---|---|---|
| US Energy Secretary Wright | ~8-9 mb/d | ~5-7 mb/d | ~13-15 mb/d |
| Independent trackers (Kpler, LSEG) | ~2-6 mb/d (sometimes 1.7-4 mb/d) | Not specified separately | Below US total |
| Pre-disruption historical baseline | ~20 mb/d | Included in total | ~20 mb/d |
| Implied gap (US claim vs tracker midpoint) | ~4-5 mb/d | Not directly comparable | Significant |
The gap matters directly for price. If traders implicitly priced the diplomatic headlines as solving a disruption to 8-9 million barrels per day of transit, but the tracker-based reality is closer to 2-6 million barrels per day, then the potential upside in supply from normalisation is substantially smaller than the 3.89% decline assumed. Part of that selloff may need to retrace when physical reality asserts itself through actual loading and discharge data in the coming weeks.
Alternative bypass routes, including Saudi Arabia’s East-West Pipeline at near full capacity and the UAE’s Habshan-Fujairah pipeline delivering approximately 1.8 million barrels per day, set a practical ceiling on how much volume can reach global buyers even if Hormuz diplomatic progress advances, because the infrastructure gap versus the strait’s 20 million barrels per day pre-war capacity remains structurally unbridgeable.
What the diplomatic situation has looked like before, and how fast it can reverse
This is not the first time diplomatic signals around Hormuz have produced a sharp price move. ING’s documented analysis of prior de-escalation episodes carries a consistent finding: ceasefire and pause arrangements in this region have historically proven fragile, and renewed tensions or vessel attacks rapidly re-inflated the risk premium that had just been removed.
That pattern matters because it establishes a base rate. If prior Hormuz-related diplomatic progress has reversed before, the default assumption should be that the current episode requires active confirmation of durability, not a passive assumption that the problem is solved.
The prior de-escalation episode on 26 July 2026 follows the same structural pattern: Brent fell 5.5% to $91.44 after a US-Iran mutual stand-down, with no additional barrels reaching market and no tanker routes secured, and the risk asymmetry in that episode, upside surprise from re-escalation materially larger than downside from full resolution, applies directly to the August move.
ING analysts have highlighted a specific scenario in which this matters most: if flows do not genuinely normalise later in 2026, tightening inventories combined with strong seasonal demand could send Brent back toward well above $100. That scenario underscores how much of the current relief below $90 is contingent on sustained follow-through rather than headline momentum.
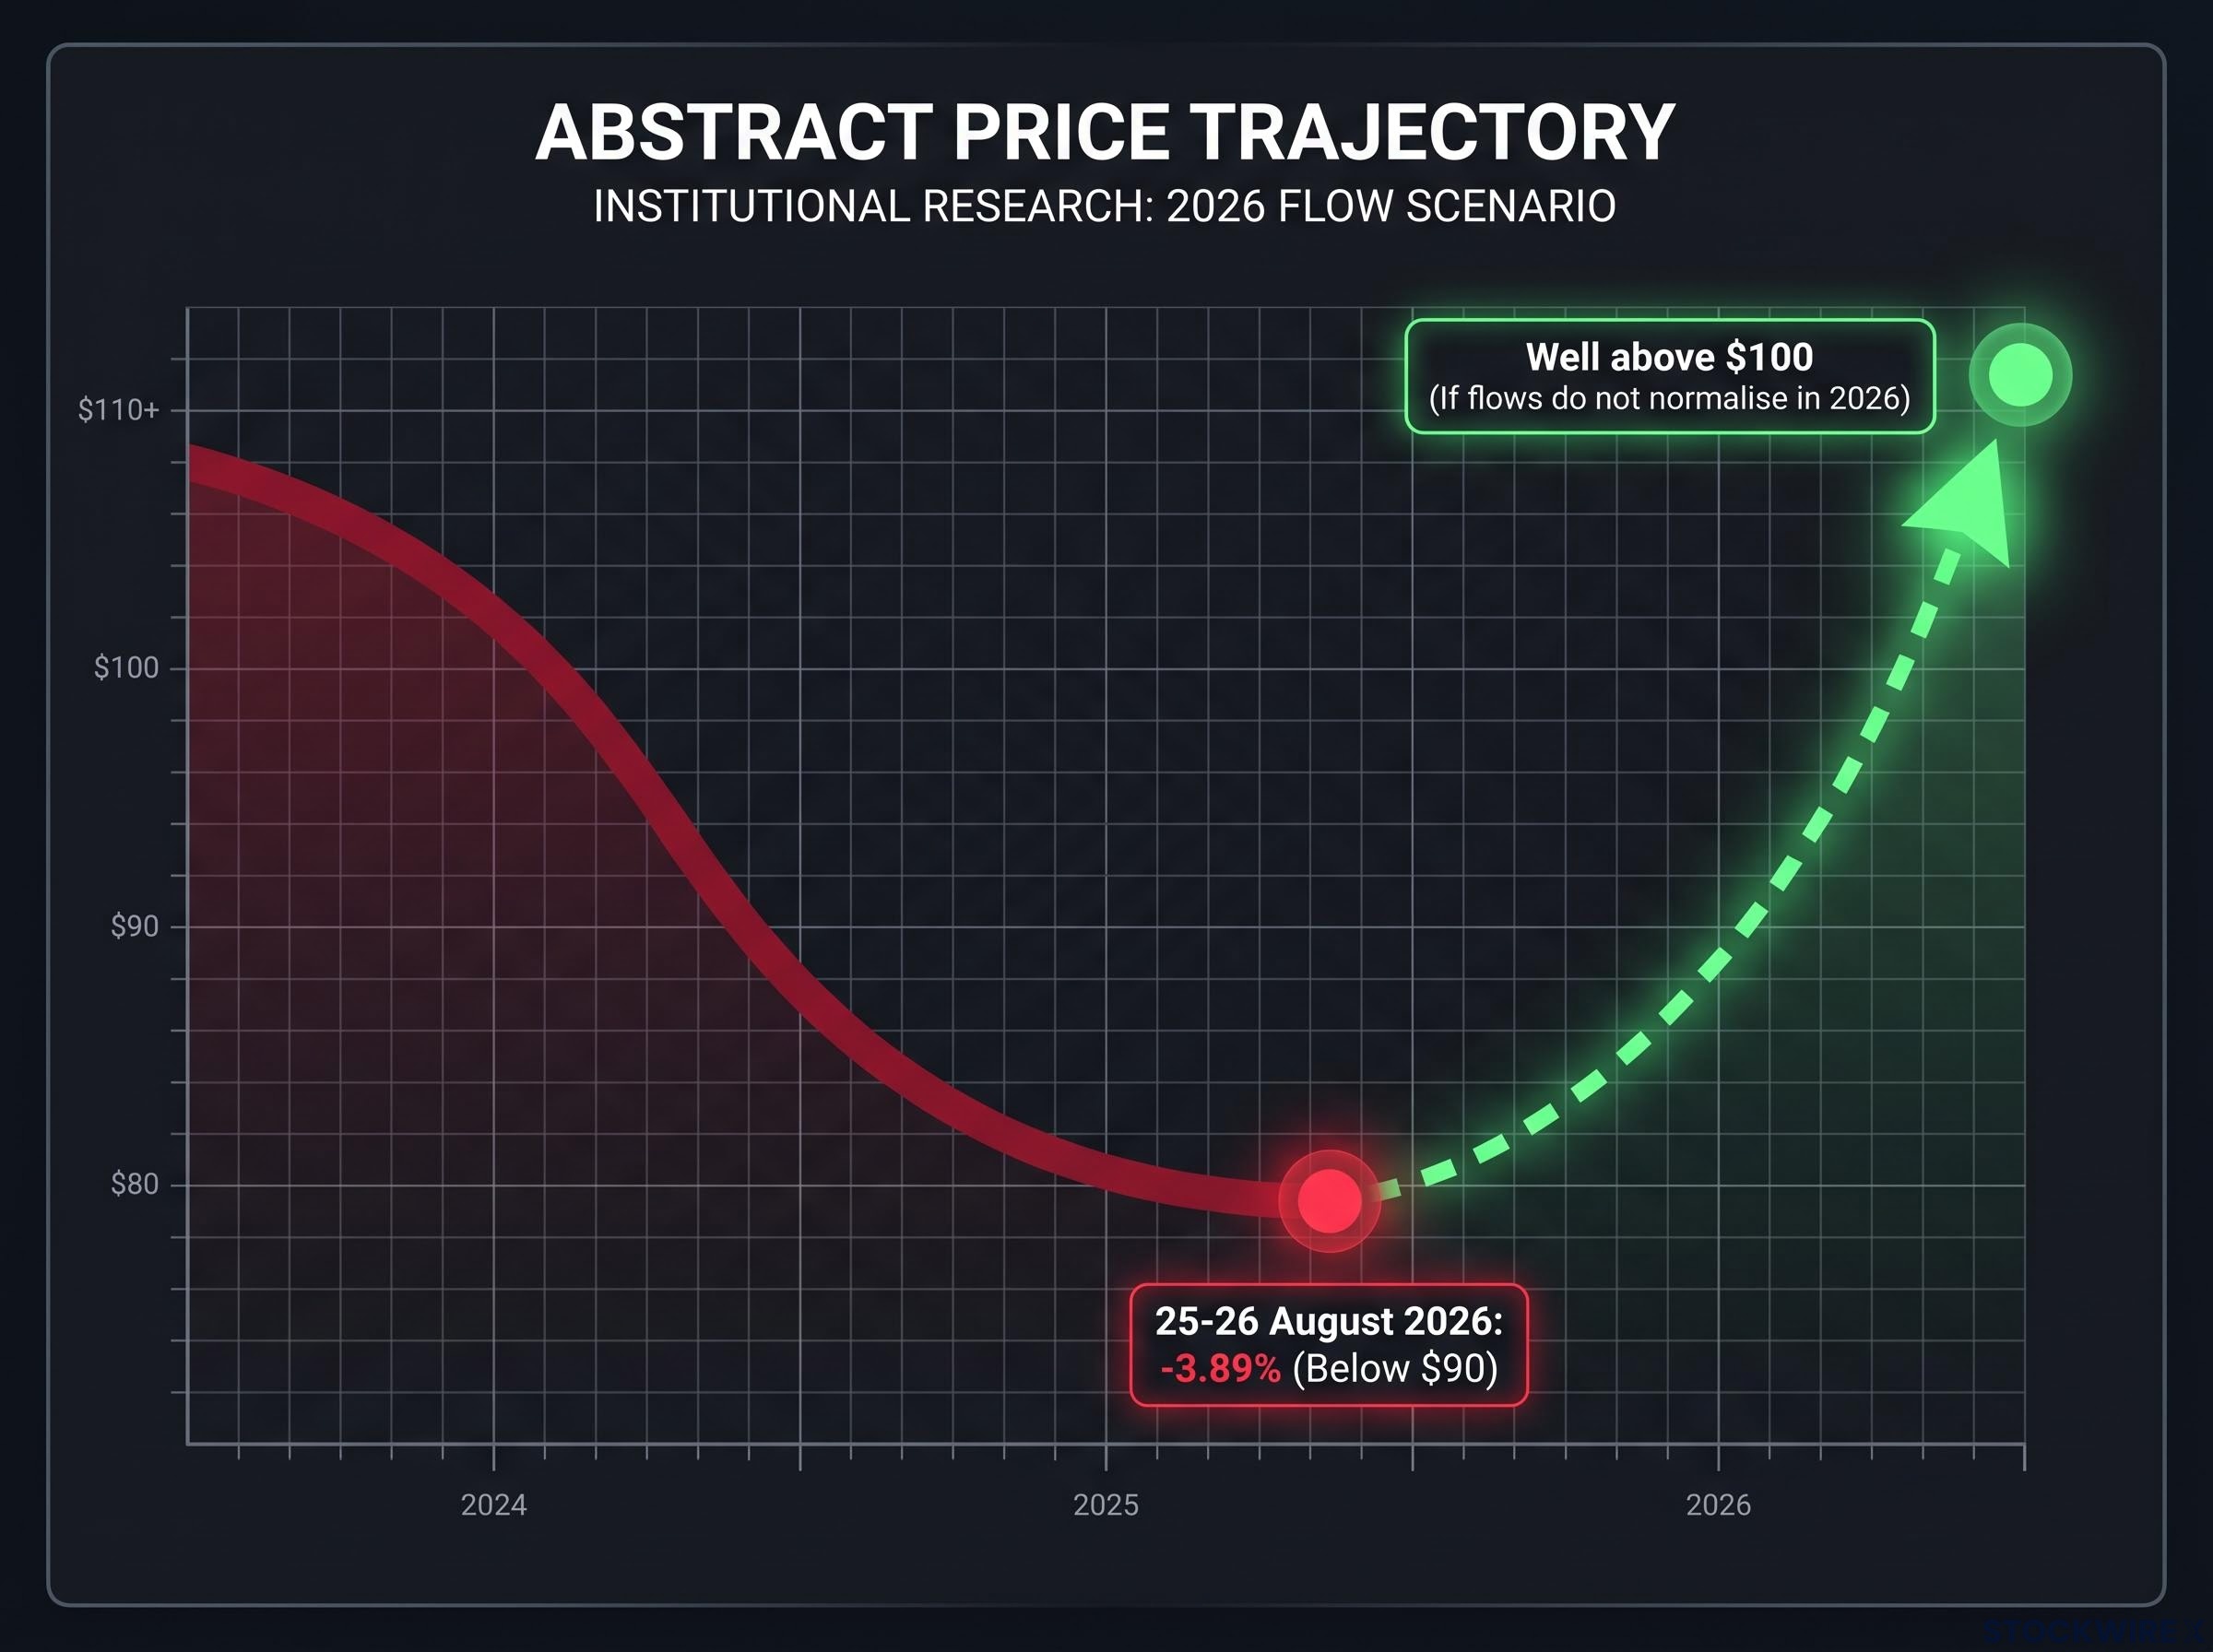
Brent has been trading in the mid-to-high $80s to low $90s range amid the latest diplomatic signals, with recent daily closes showing volatility around the $90 threshold as of 26 August 2026. The momentum overshoot dynamic is visible in real time: price action extended into subsequent Asian sessions as traders followed momentum rather than detailed fundamentals, raising the possibility that the drop below $90 over-extrapolated what the diplomatic signals can deliver in physical barrels.
Three reasons the 3.89% decline may give back ground
- The sanctions constraint is unresolved. US sanctions and port restrictions remain the primary barrier to materially higher Iranian exports, and as established in the preceding section, regional diplomacy between Iran and Oman cannot override these without Washington’s involvement.
- The throughput data is contested and likely overstated. Independent vessel-tracking estimates place actual Hormuz flows at 2-6 million barrels per day, far below the 8-9 million barrels per day asserted by US officials, meaning the supply upside from normalisation may be substantially smaller than the price move assumed.
- Diplomatic fragility is the historical norm. Prior ceasefire and de-escalation episodes around Hormuz have reversed, and renewed tensions or attacks have rapidly re-inflated risk premium on each occasion, as documented by ING analysis.
Four indicators that will determine whether this price move holds
Rather than anchoring to a directional view, you can track the four variables that will resolve this uncertainty in the weeks ahead. Each functions as a binary: what confirmation looks like versus what disconfirmation looks like.
| Indicator | Confirming signal | Disconfirming signal |
|---|---|---|
| US sanctions and policy signals | Formal easing of Iran-related sanctions, port restriction adjustments, or US endorsement of a Gulf energy deal | Reaffirmation of existing sanctions or new enforcement actions |
| Vessel-tracking data (Kpler, LSEG) | Sustained move toward upper end of tracker estimates | Stagnation or continued low Hormuz flows |
| Direct US-Iran diplomatic engagement | Structured talks or back-channel engagement on sanctions, nuclear, or maritime security | Absence of Washington-Tehran contact while regional talks continue |
| Brent behaviour around $90 | $90 holds as resistance; price stabilises in mid-to-high $80s | Rapid reclaim of $90 on renewed tensions or disappointing flow data |
The sequence matters. US sanctions signals carry the most weight because they determine whether the legal barrier to higher Iranian exports is removed. Vessel-tracking data comes next because it reveals whether diplomatic progress is translating into physical barrels. Direct US-Iran engagement provides the political context. Brent’s own price behaviour is the market’s real-time verdict on all three.
ING analysts warn that if flows do not normalise, tightening inventories and seasonal demand could push Brent back toward well above $100, a scenario that would make the current sub-$90 level look like a brief dip rather than a regime change.
These signals will tell you which scenario is playing out. Acting ahead of that confirmation, before the sanctions, flow, and diplomatic indicators have resolved, is where a rational risk-premium unwind can turn into a reversal trade.
What the price move got right, and what it got ahead of
The market was not wrong to reprice. The diplomatic signals around Hormuz were genuine, the tail-risk probability for a full blockade or extended shutdown did fall, and some risk-premium removal was rational. The 3.89% single-session decline on 25-26 August 2026 reflected a market correctly processing a reduction in the worst-case scenarios.
What the market priced correctly:
- Diplomatic progress between Iran, Oman, and Pakistan was real and substantive enough to reduce near-term tail-risk probability.
- The pre-loaded risk premium, as identified by ING analysts Patterson and Manthey, was elevated and vulnerable to a sharp unwind on any credible de-escalation headline.
- Momentum extension into Asian trading was consistent with historical commodity repricing patterns around geopolitical shifts.
What remains unconfirmed:
- US sanctions relief has not been signalled, announced, or visibly negotiated, yet the price move implicitly discounts it.
- The throughput baseline against which the market priced supply relief may be the US government’s contested 8-9 million barrels per day figure rather than the independent tracker range of 2-6 million barrels per day, meaning the actual supply upside is likely smaller than assumed.
- The durability of the diplomatic progress has no historical precedent in this region; prior de-escalation episodes have reversed, and ING analysts explicitly frame the move as vulnerable to reversal if legal and physical bottlenecks do not ease in coming weeks.
The diplomatic progress is real but incomplete, and the price move is justified as a first-order response while remaining premature as a final verdict. For you, the next signal from Washington or a vessel-tracker data release carries more weight than any further regional diplomatic statement. The four indicators laid out above are the confirmation mechanism; tracking them over the coming weeks is more informative than any single analyst forecast about where Brent settles next.
This article is for informational purposes only and should not be considered financial advice. Investors should conduct their own research and consult with financial professionals before making investment decisions. Past performance does not guarantee future results. Forward-looking statements about oil prices and diplomatic outcomes are speculative and subject to change based on market developments and geopolitical conditions.