“AUD/USD has had one of its more impressive runs of 2026, but the pair is not in a breakout. At roughly 0.718 on 27 August 2026, it sits inside a defined range that has not been convincingly cleared. The rally is real; the structural case for a new trend is not yet confirmed.\n\nThe failure to break out is not a matter of momentum. It is a matter of conditions. DBS Group Research analyst Philip Wee has identified two specific external forces that must both be present for a clean break above the 0.7275-0.7309 resistance zone to carry conviction: broad currency strength across Asia, particularly in the CNY, KRW, and JPY, and a U.S. Dollar that stays weak because of institutional doubts about Fed credibility rather than any single data surprise. Neither condition has fully materialised on its own. Both need to arrive together.\n\nHere is the three-part convergence test that determines whether AUD/USD breaks out or retreats, what each condition looks like in observable market signals, and why the upcoming Jackson Hole address from Fed Chair Kevin Warsh is the most consequential near-term event for establishing dollar direction. A reader who works through this will know which indicators to watch rather than reacting to price alone.\n\n## AUD/USD is range-bound, not in a breakout: what the levels actually show\n\nThe narrative around AUD/USD right now sounds bullish. The pair has climbed through several intermediate resistance levels and sits near the top of its recent range. That framing is not wrong, but it is incomplete.\n\nThe post-Operation Epic Fury consolidation band runs from a floor near 0.6833 up to a ceiling around 0.7278, and AUD/USD has remained contained within those boundaries throughout. At 0.718, the pair is in the upper third of that range, which feels like progress. It is not, however, above the range.\n\nThe resistance architecture above current price tells a more cautious story. Multiple independent technical frameworks cluster their resistance between 0.7275 and 0.7309, a zone that aligns closely with the post-event range ceiling near 0.7278. When several unrelated analytical approaches arrive at the same zone independently, it signals that selling pressure at those levels has structural weight. Treating a close approach to that zone as a breakout would be premature.\n\n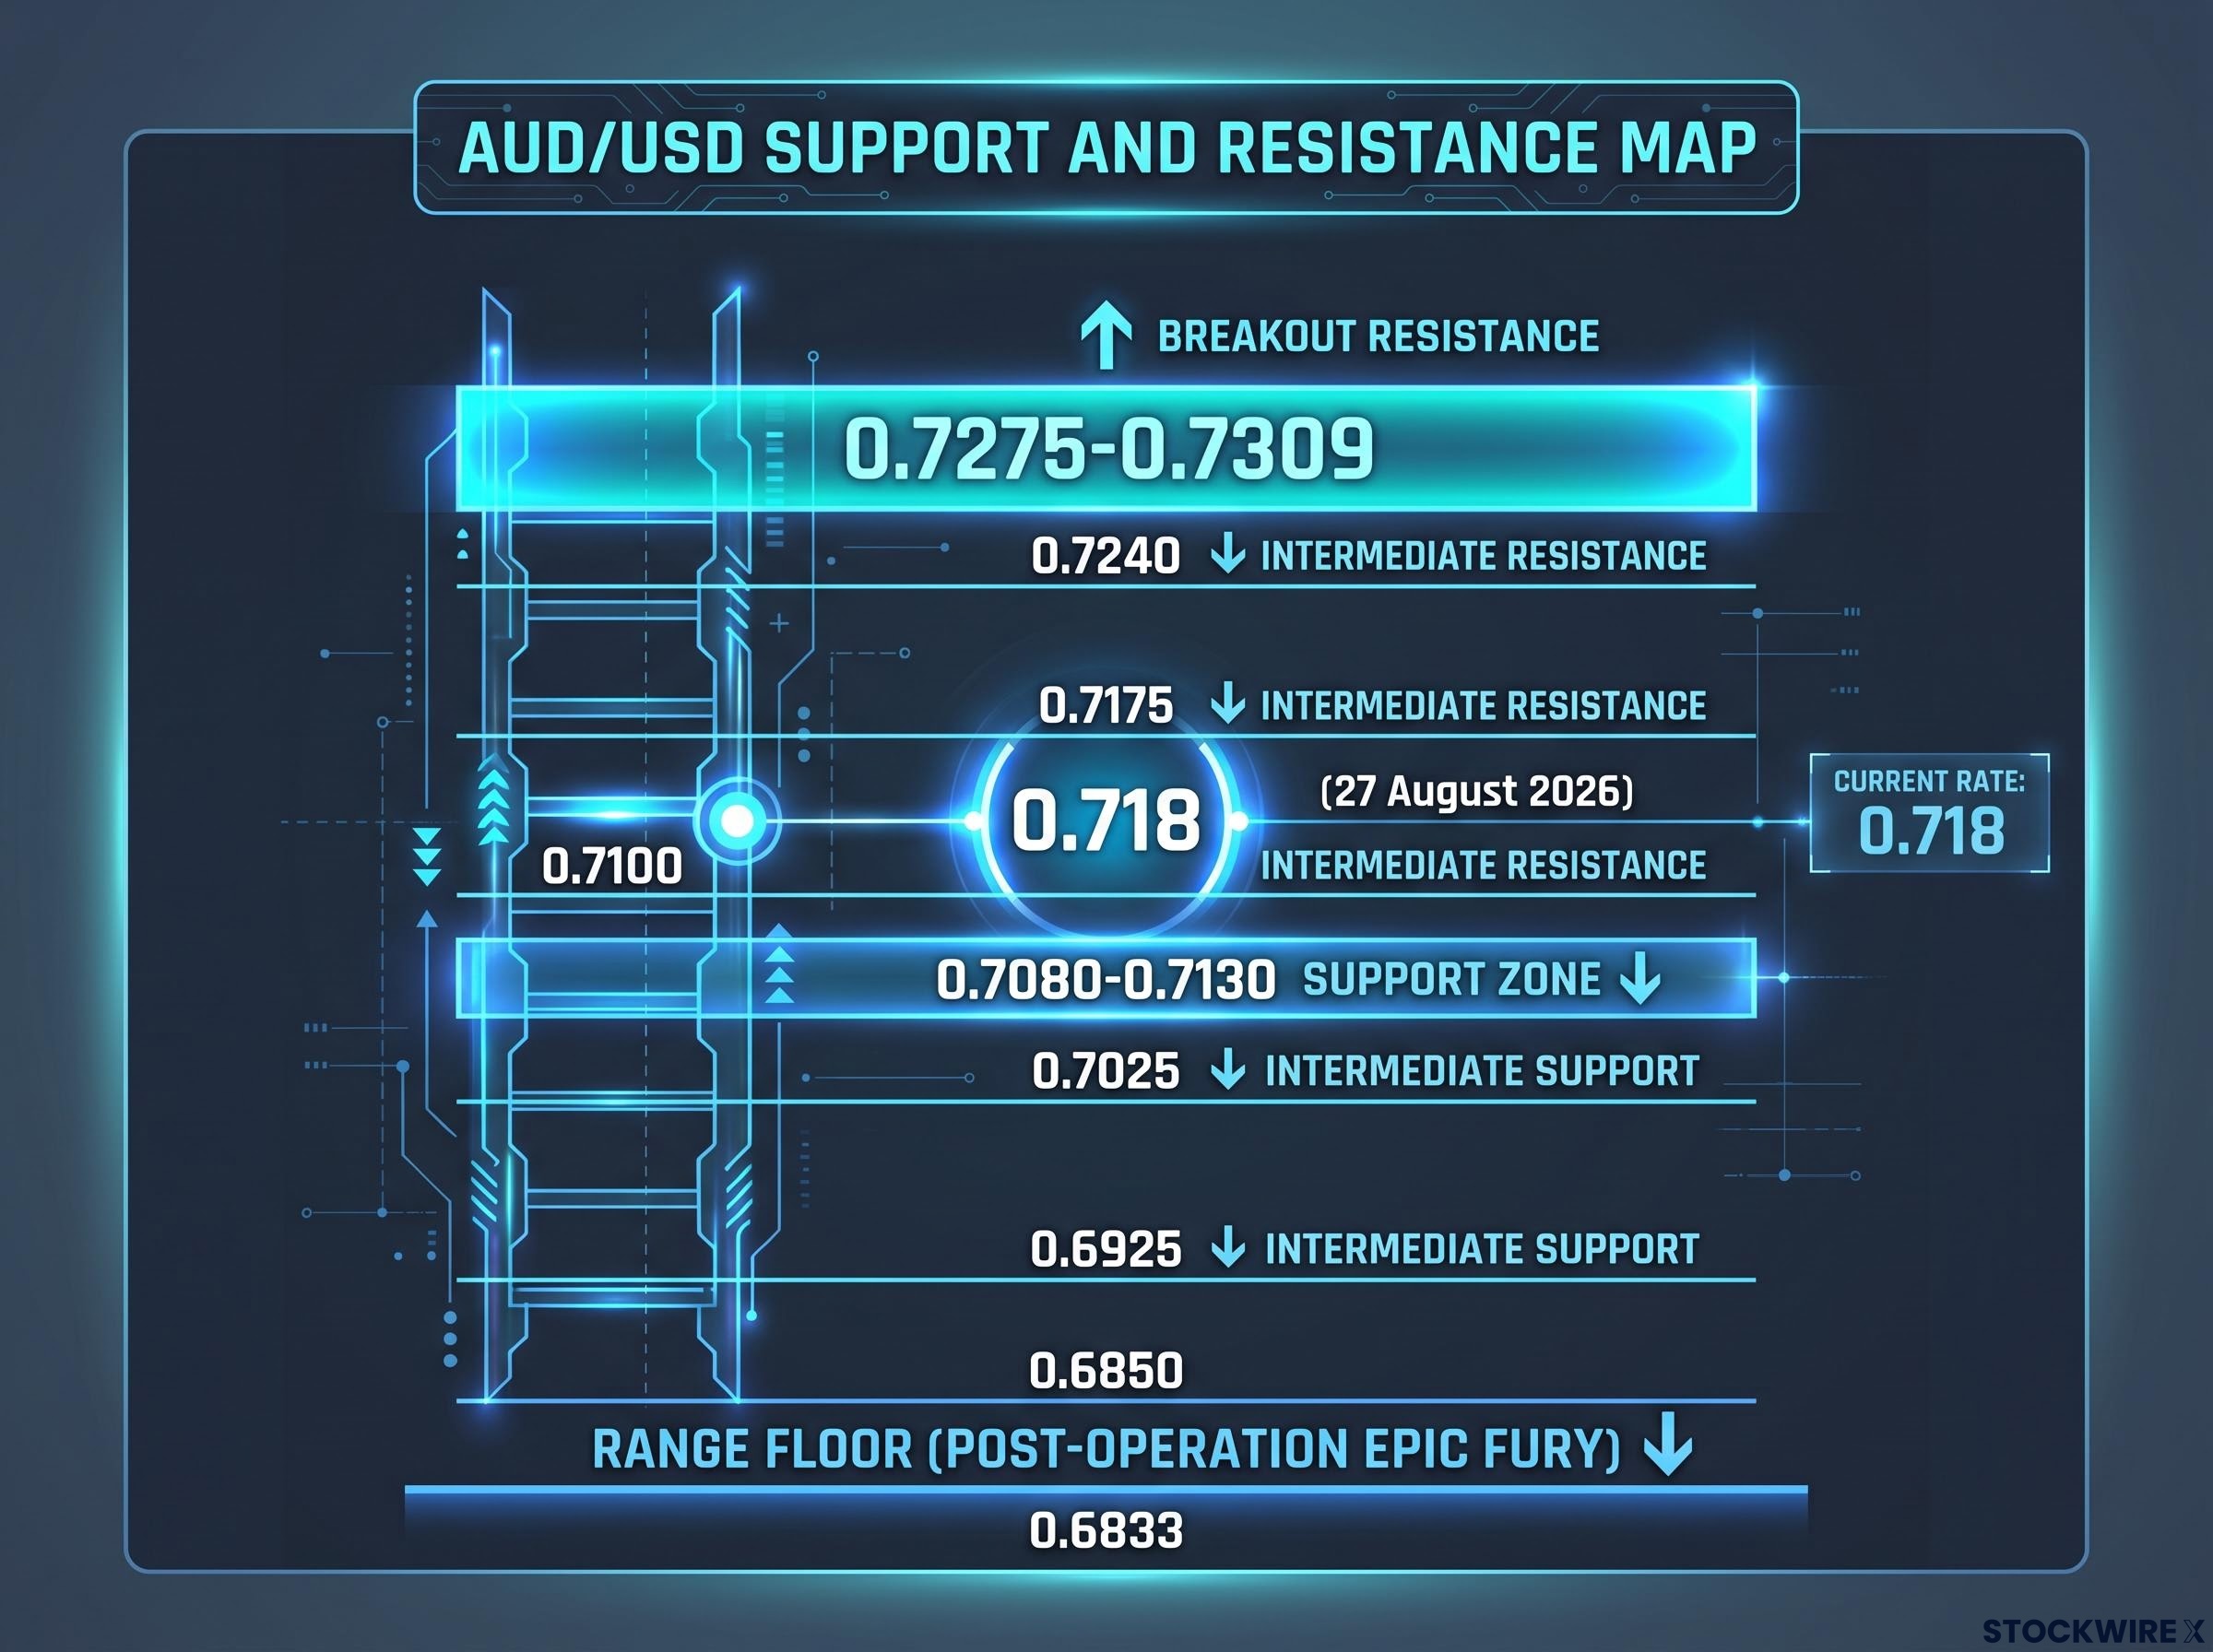 \n\n
\n\n
| Level | Zone Type |
|---|---|
| 0.7275-0.7309 | Breakout resistance (multi-framework convergence) |
| 0.7240 | Intermediate resistance |
| 0.7175 | Intermediate resistance |
| 0.7100 | Intermediate resistance |
| 0.7080-0.7130 | Immediate support |
| 0.7025 | Deeper support |
| 0.6925 | Deeper support |
| 0.6850 | Deeper support |
| 0.6833 | Range floor (post-Operation Epic Fury band low) |
\n
\n\n### The difference between approaching resistance and clearing it\n\nAn intraweek spike toward 0.7275-0.73 does not constitute confirmation. Price can touch a resistance zone, attract sellers, and reverse within the same week without ever signalling that the range has broken.\n\nThe clearest technical confirmation is a sustained weekly close above 0.7275-0.7309. In practice, that means the pair must be above that zone at the end of the Friday New York session, the point at which the weekly candle closes and the noise of intraweek volatility is filtered out.\n\n> \”A sustained weekly close above the 0.7275-0.7309 zone is the clearest technical confirmation of a breakout. Until that occurs, the disciplined read is range-bound.\”\n\n## Why AUD/USD does not operate in isolation: understanding the Asian currency link\n\nIf you are watching AUD/USD in isolation, you are reading half the picture. The Australian Dollar is structurally tethered to Asian currencies and regional growth sentiment, and understanding why changes how you interpret every move the pair makes.\n\nAustralia’s economy is export-dependent on Asia. When Asian growth sentiment is firm, demand for Australian commodities strengthens, capital flows toward Australian assets, and AUD appreciates. When Asian currencies weaken, they signal softening regional demand, and AUD typically follows regardless of what the U.S. Dollar is doing on its own. DBS Group Research’s Philip Wee has stressed that AUD gains are more durable when accompanied by stronger Chinese and broader Asian assets rather than occurring in isolation.\n\nThis is why professional FX desks treat a lone AUD/USD spike without Asian FX confirmation as a tactical trade to be faded rather than a trend signal to be followed. The regional backing is what separates a real move from a temporary extension.\n\nThe asymmetry between external headwinds versus domestic buffers has been a persistent feature of AUD/USD in 2026, with geopolitical risk and USD safe-haven demand repeatedly outweighing the yield differential support that the RBA’s inflation-driven hold provided.\n\n### The Asian FX signals that matter most\n\nThe practical question is what to watch. The signals split into two tiers, and the convergence test requires both tiers to align.\n\nTier-one signals (primary):\n\n- CNY daily fixings: The People’s Bank of China sets a daily reference rate for the Yuan. A series of stronger-than-expected fixings signals Beijing’s tolerance for a firmer currency, which is directly supportive for AUD.\n- USD/CNY spot: A declining USD/CNY rate (Yuan strengthening against the dollar) confirms that Beijing’s stance is translating into actual market pricing.\n\nTier-two signals (corroborating):\n\n- KRW and JPY: Strengthening Korean Won and Japanese Yen versus the dollar confirm that the rally is a broad Asian FX phenomenon, not a China-only story.\n- Regional equity indices: Rallying Chinese and Korean equity markets signal risk appetite that feeds directly into AUD demand.\n- Credit spreads: Narrowing regional credit spreads reinforce the growth-confidence signal.\n\nWhen all tier-one and tier-two signals point in the same direction, that constitutes the synchronisation analysts require. One or two signals moving in isolation is not enough to validate an AUD/USD breakout attempt.\n\n## The second condition: what kind of USD weakness is actually useful\n\n\”Dollar weakness helps AUD\” is true as a general statement. It is not precise enough to tell you whether the current dollar softness will last. The type of weakness matters, and two very different dynamics produce what looks, on the surface, like the same trade.\n\nData-driven dovish blips are temporary. A single soft U.S. jobs report or a below-consensus inflation print can push the dollar lower for a session or two. But if the broader policy framework remains hawkish, the move reverses the moment the next strong data point arrives. These episodes produce the kind of AUD/USD rallies that fade before reaching the breakout zone.\n\nCredibility-driven weakness is more durable and harder to reverse. Markets are currently weighing whether the Fed has compromised its own hawkish stance: specifically, whether the U.S. Treasury’s buyback programme for longer-dated bonds implies an unofficial tolerance for looser financial conditions, and whether the Fed can sustain its inflation-fighting posture alongside those operations. A dollar that weakens for these structural reasons does not snap back on a single strong data print, because the underlying concern is institutional rather than cyclical.\n\nThe Fed credibility discount is not a theoretical concept in mid-2026: three FOMC members dissented in favour of an immediate hike at the July meeting, and long-end yields rose while short-end yields fell, a curve steepening that signals the market is already pricing institutional doubt about the Fed’s inflation resolve.\n\n> \”AUD positioning is already stretched, making the pair vulnerable if the dollar regains strength on policy or data surprises.\”\n\nThe signal that tells you which dynamic is driving the dollar sits in the yield curve:\n\n- 2-year Treasury yield rising: This is the cleanest USD-positive scenario. It signals the market expects tighter Fed policy, and AUD/USD is likely to rotate back toward support levels.\n- 2-year Treasury yield flat or declining: This is the prerequisite for a breakout environment. It signals that rate-differential support for the dollar is eroding, giving AUD room to push higher.\n\nA hike following the 3 November midterm elections has not been ruled out by markets, and that residual possibility keeps an extra layer of uncertainty hanging over the dollar’s near-term trajectory.\n\n### Treasury buybacks, long-end yields, and what they signal about Fed intentions\n\nTreasury buyback operations (where the government repurchases its own longer-dated bonds) have recently increased in size. These operations suppress long-end yields, the 10-year and 30-year rates, by removing supply from the market.\n\nThe credibility dimension enters when markets interpret active buybacks as the Fed tolerating easier financial conditions. If the Fed is buying duration off the market while simultaneously talking about inflation vigilance, the contradiction feeds the credibility discount on the dollar. That discount is what makes the current USD weakness potentially more durable than a simple dovish data blip.\n\n## Three Jackson Hole scenarios and what each one means for your AUD/USD view\n\nFed Chair Kevin Warsh’s Jackson Hole address, anticipated for the day after 26 August 2026, is the nearest discrete event capable of resolving or extending the current impasse. FX strategists are explicitly framing it as a key risk event for dollar direction, with particular emphasis on which part of the yield curve moves most in response.\n\nWarsh’s communication regime removed the dot plot and all forward guidance from FOMC statements, a design choice that converts every CPI print and jobs report into a live rate-expectations event and raises the market-moving potential of any Jackson Hole address compared with prior Fed chairs operating under the guidance framework.\n\n
| Scenario | Key Market Signal | AUD/USD Implication |
|---|---|---|
| Hawkish surprise: Clear openness to further hikes or scaling back yield-management tools | 2-year yields rise sharply | Rotation toward 0.71-0.70 or lower support bands; range stays intact |
| Dovish or credibility-aware: Acknowledgment of policy-credibility concerns, patience, tolerance for easier conditions | USD weakens; 2-year yields flat or declining | Best chance to challenge 0.7275-0.73, especially if Asian FX simultaneously firm |
| Deliberate ambiguity: Non-committal, optionality-preserving message | Muted yield-curve response; no clear directional signal | Range-bound continuation; 0.70-0.71 support, resistance below 0.73 |
\n
\n\nThe 2-year yield movement in the hours following Warsh’s speech is the single most actionable data point you should watch. It tells you whether the market read the address as a USD-supportive reassertion of hawkishness or a credibility-aware pause.\n\nEven a dovish Warsh speech only completes one of three required conditions for a breakout. The convergence test remains:\n\n1. Weekly close above 0.7275-0.7309 (price confirmation)\n2. Asian FX synchronisation (CNY fixings, regional currencies, and equities aligning)\n3. Sustained credibility-driven USD weakness (not a one-off dovish headline)\n\nAny price surge on the speech alone is a candidate for fading unless CNY fixings and regional equity signals are simultaneously pointing higher.\n\n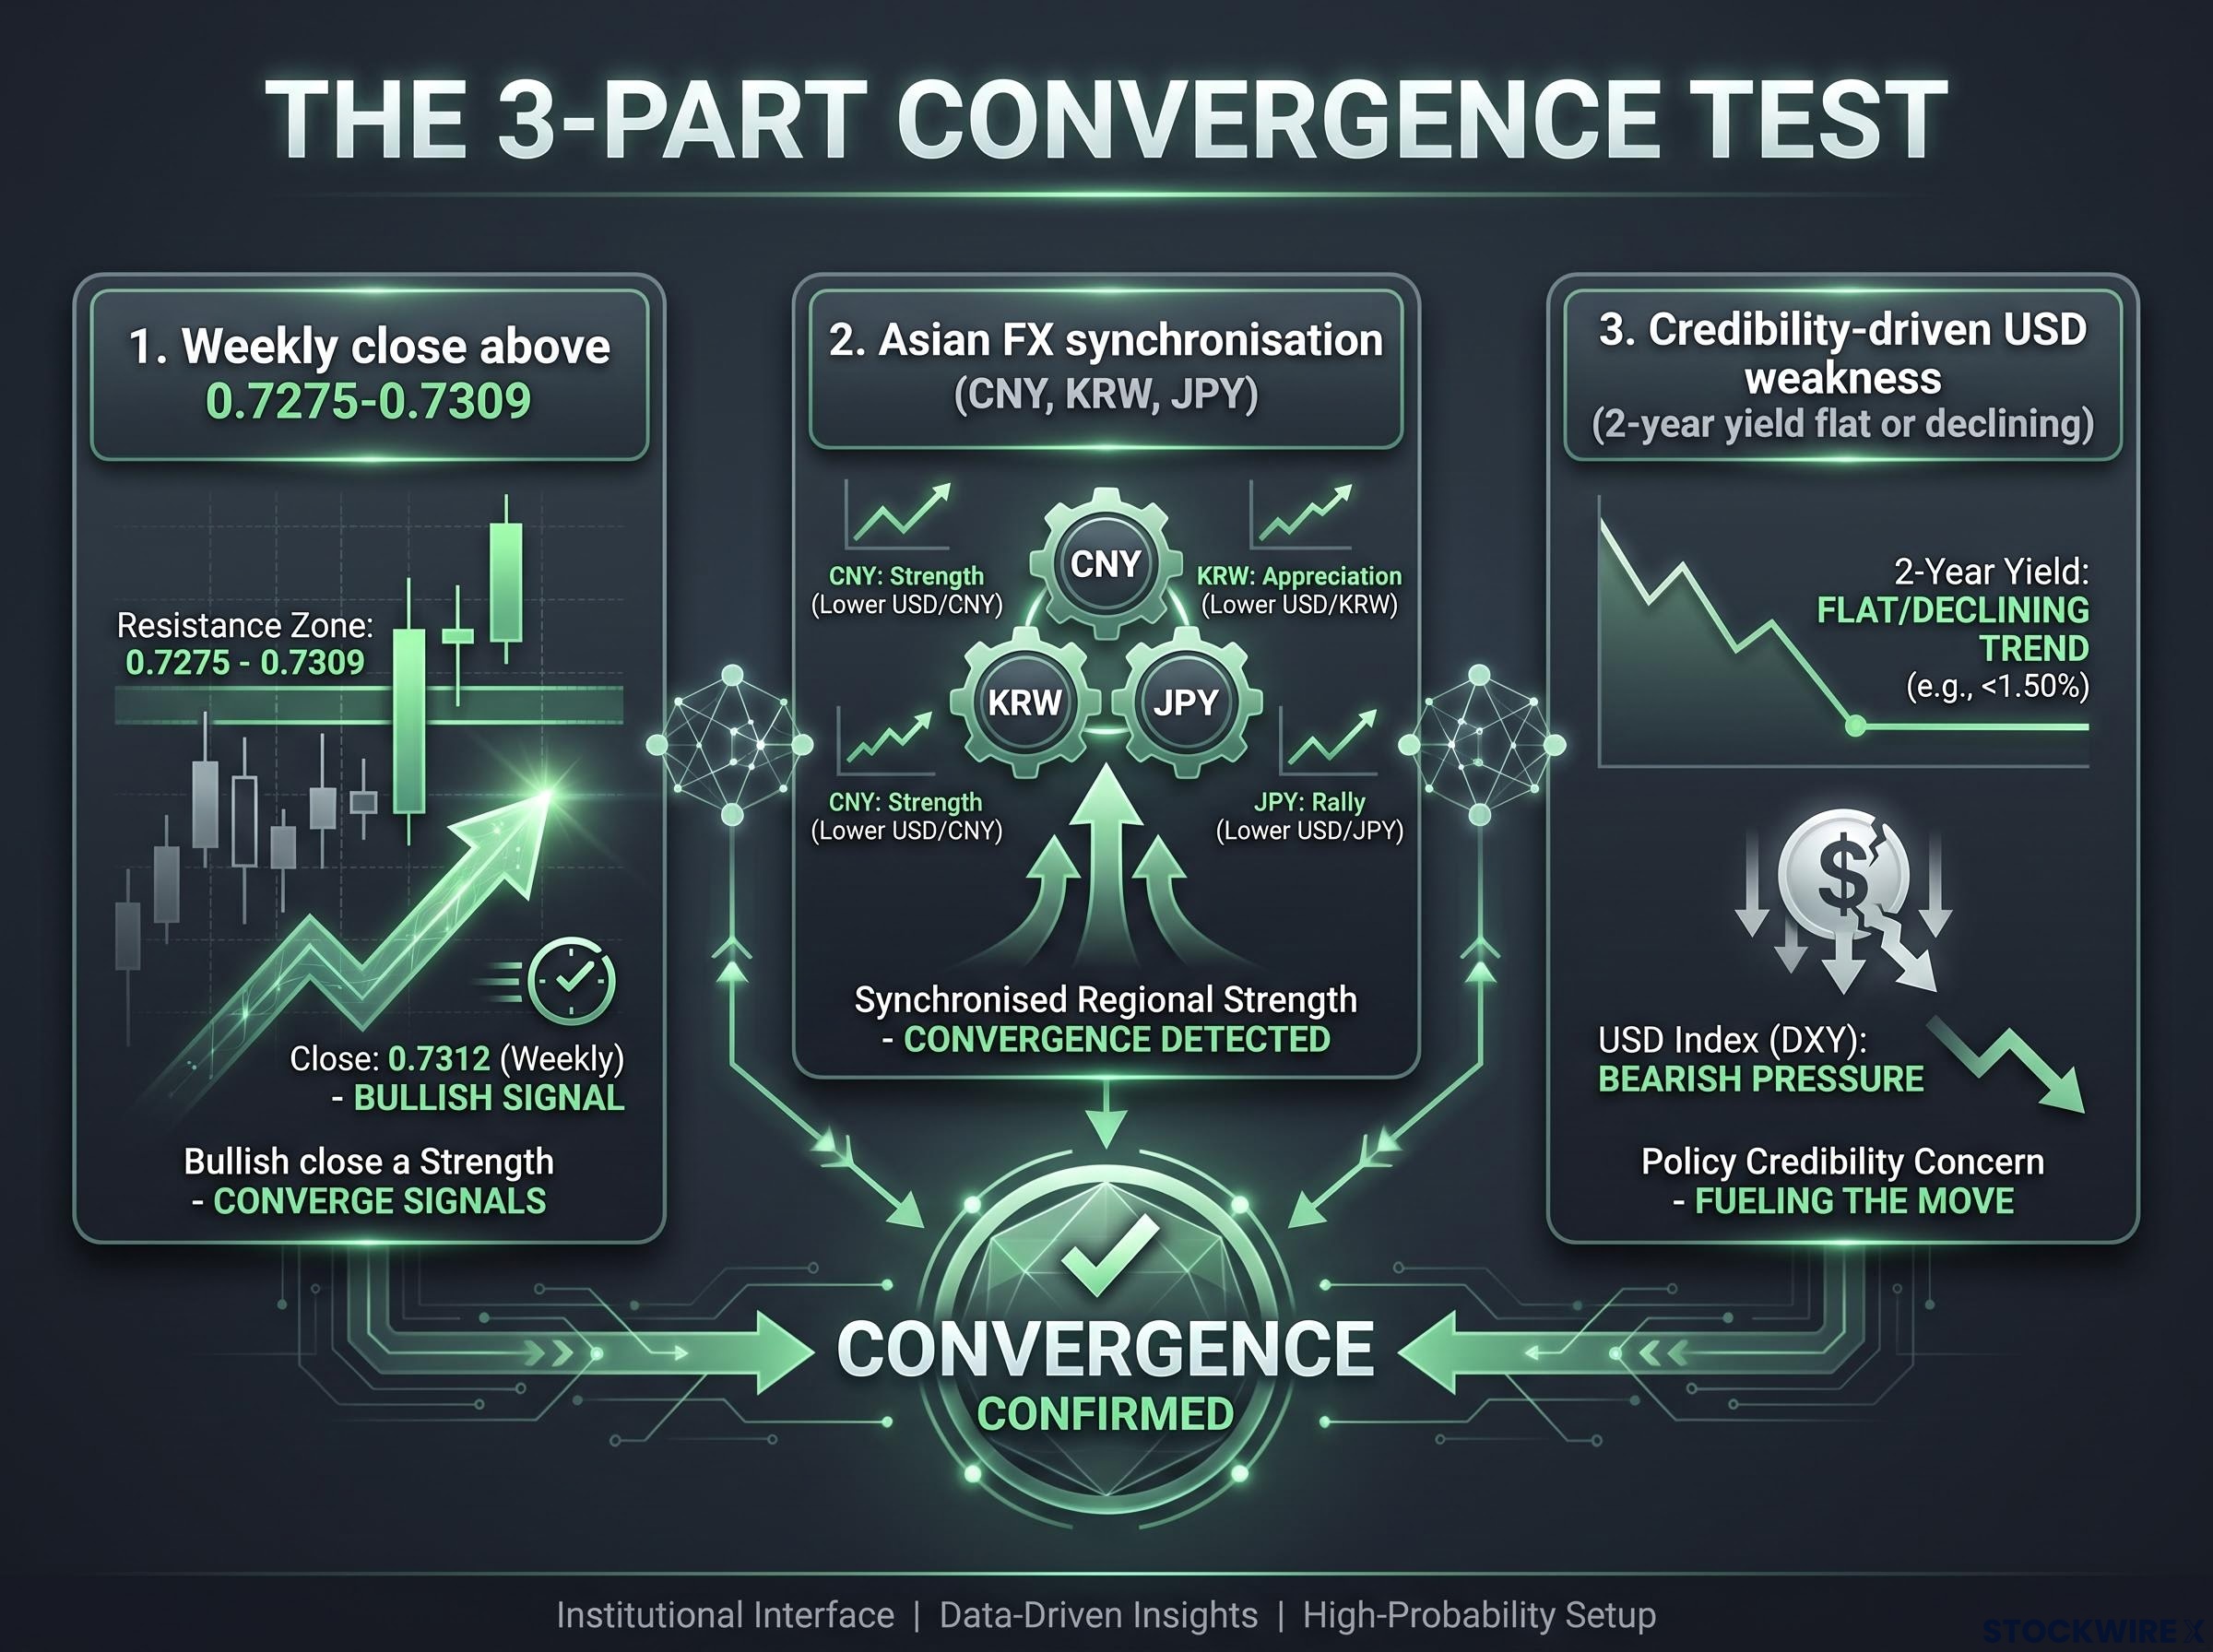 \n\n## Waiting for convergence: how to position before the three conditions align\n\nThe three-condition test produces a single, actionable decision rule: if all three signals are not simultaneously confirmed, the disciplined interpretation is range-bound. One or two in isolation is not a breakout. It is a reason to watch more carefully.\n\n
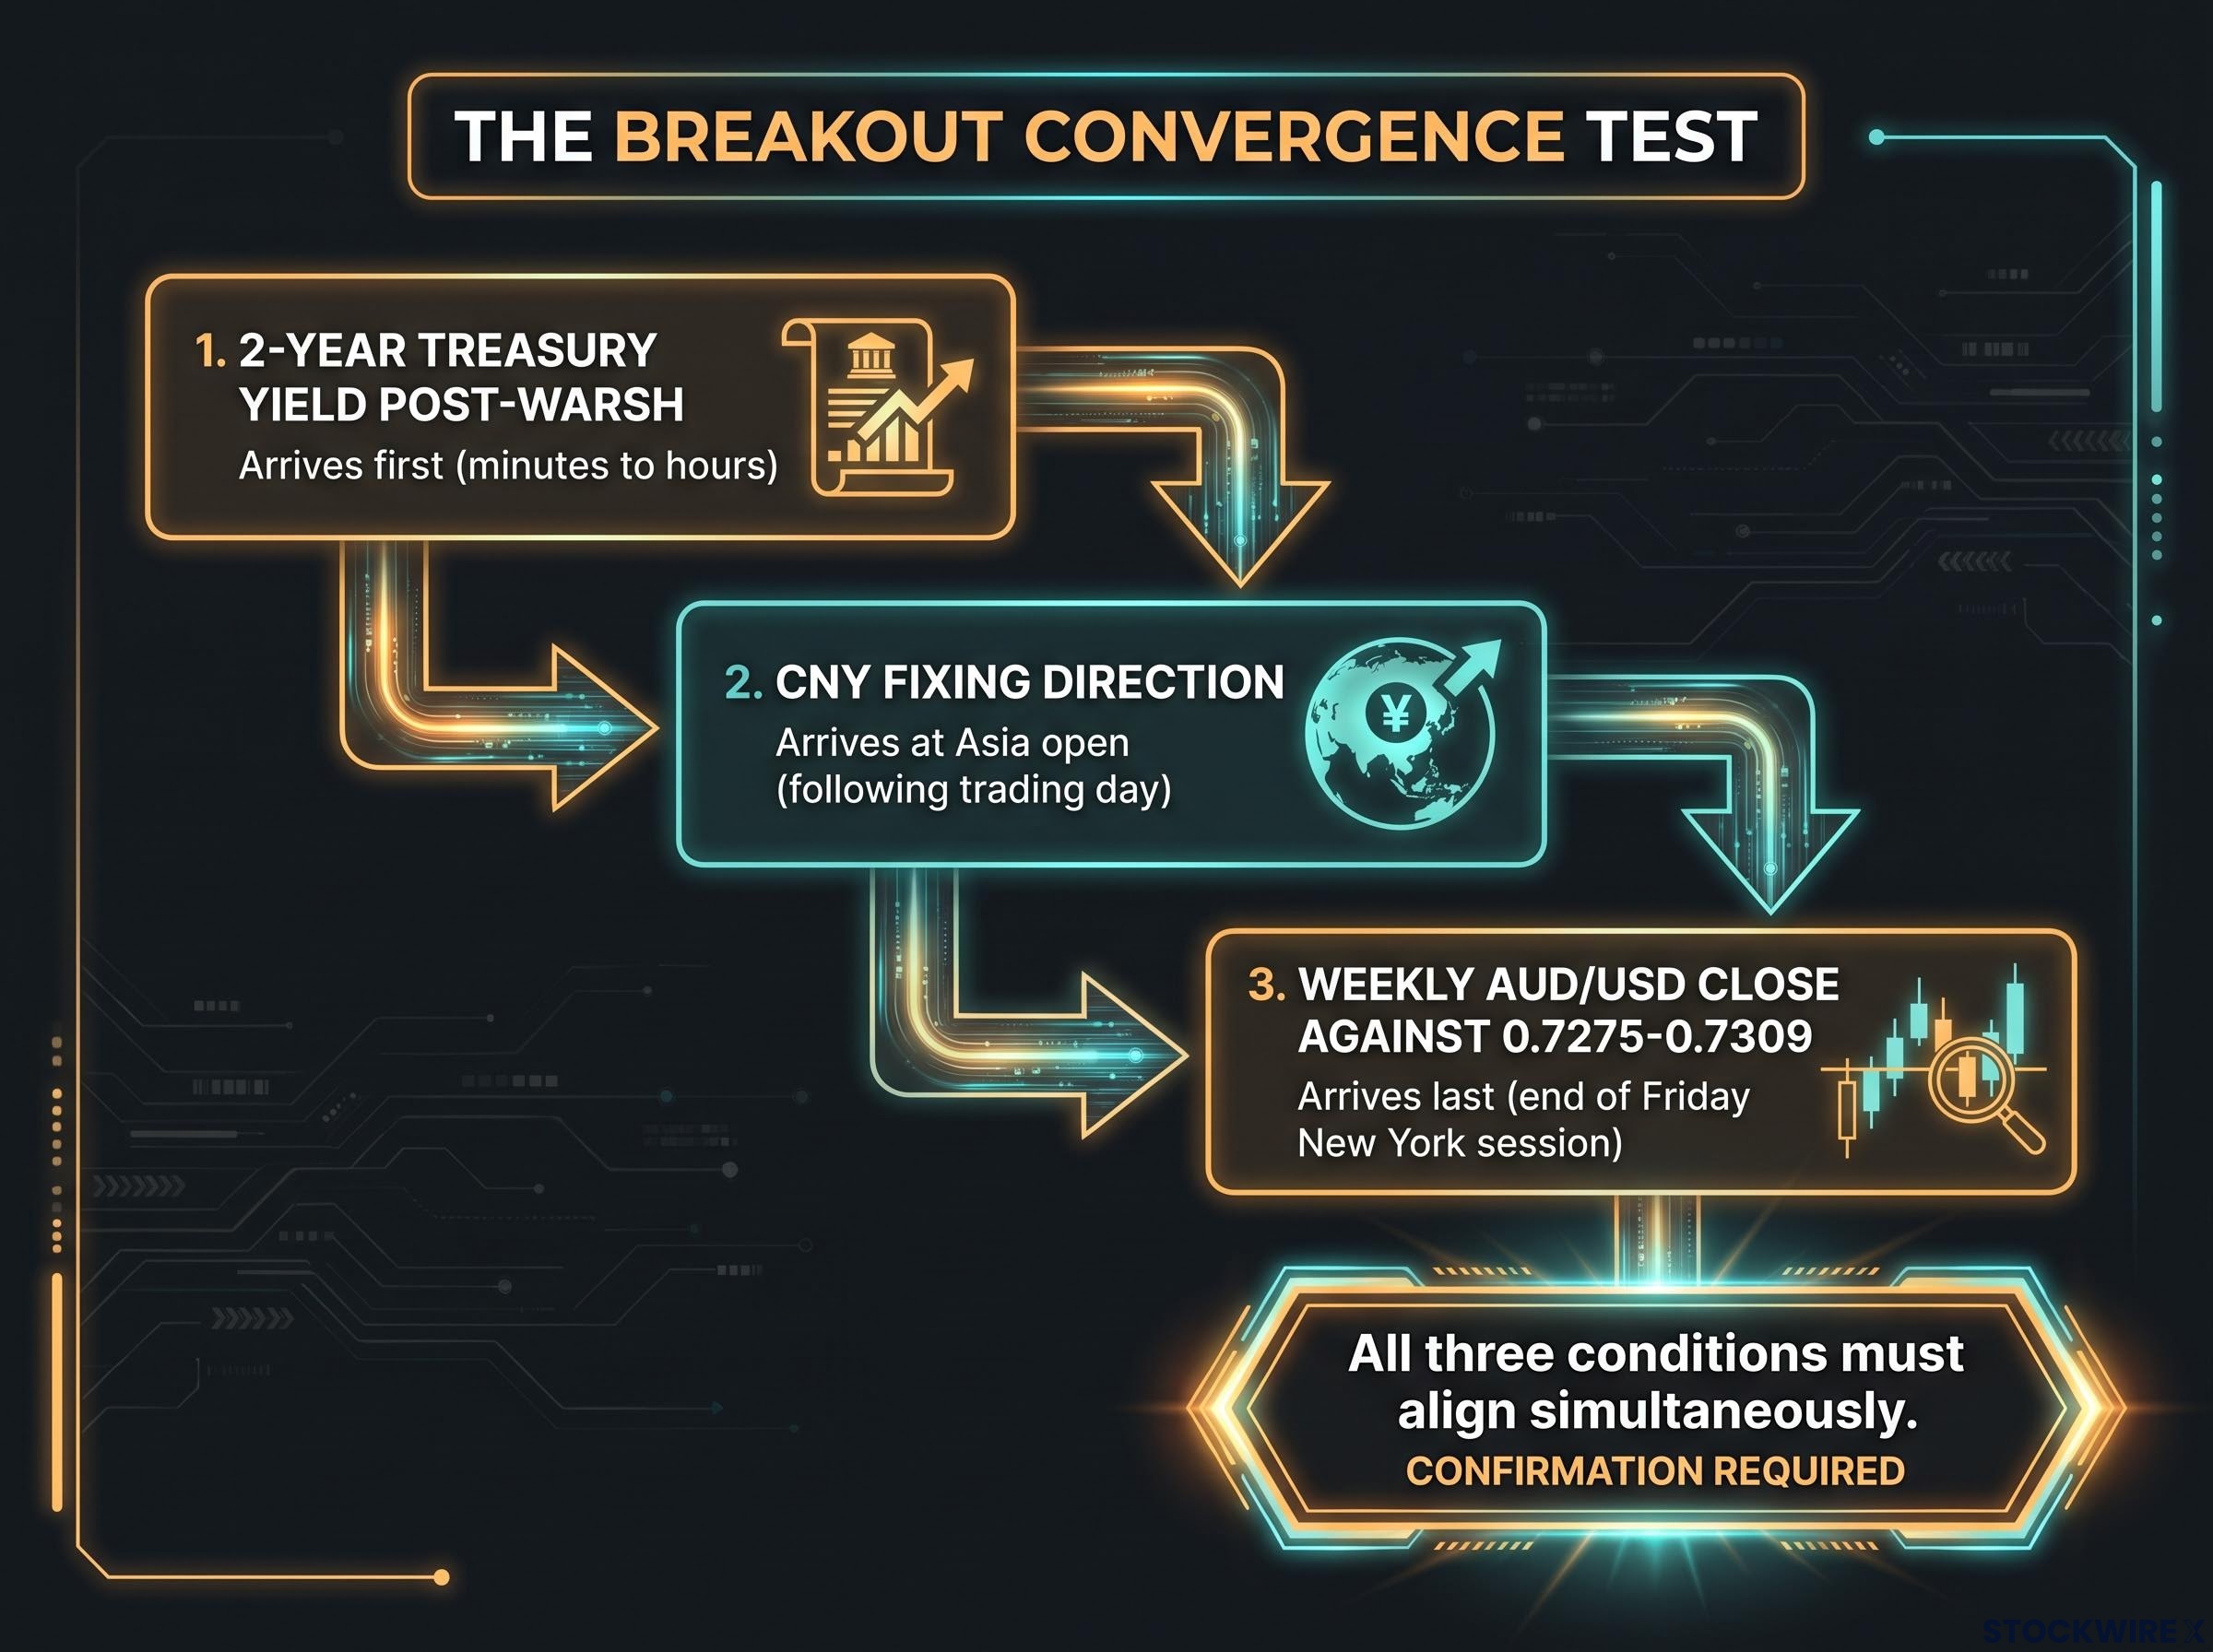 \n\nThe monitoring hierarchy, in priority order:\n\n1. Watch the 2-year Treasury yield post-Warsh. This arrives first, within minutes to hours of the speech. A rising 2-year yield closes the breakout door for this cycle. A flat or declining yield keeps it open.\n2. Check CNY fixing direction at the Asia open. The People’s Bank of China’s next daily fixing, arriving on the following trading day, tells you whether the Asian FX leg of the convergence is materialising.\n3. Evaluate the weekly AUD/USD close against 0.7275-0.7309. This arrives last, at the end of the Friday New York session. It is the definitive signal, but it is also the slowest.\n\n> \”All three conditions must align simultaneously. One or two in isolation is not a breakout. It is a reason to watch more carefully.\”\n\nThe positioning stretch risk deserves direct attention. Because AUD is already an extended position for many market participants, late entrants to a breakout face asymmetric risk. If the signal proves false, unwinding happens faster than the initial accumulation. A rejection from the 0.7275-0.7309 zone would likely pull price back toward 0.7080-0.7130 as immediate support, with 0.7025, 0.6925, and 0.6850 as deeper levels if the retreat accelerates.\n\nThe cost of being early to a breakout trade is higher than usual in this setup. The pair is priced for good news, and a signal that fails to materialise fully will be unwound faster than normal.\n\nCarry unwind dynamics amplify the asymmetric risk identified here: thin late-August liquidity concentrates rather than reduces the speed of position reversals, meaning a failed breakout attempt from the 0.7275-0.7309 zone would unwind faster than the accumulation phase that preceded it.\n\n## What a genuine AUD/USD breakout looks like from here\n\nIf all three conditions converge, a weekly close above 0.7309 changes the analytical picture materially. The range-bound characterisation would need to be retired. Once the 0.7275-0.7309 zone is convincingly cleared, it flips from resistance to support, and the next resistance architecture above 0.73 becomes the relevant map.\n\nThe bull case is not hedged. It is conditional. There is a difference. The conditions are specific, observable, and time-stamped: the days immediately following Warsh’s address, approximately 27-28 August 2026 and the sessions that follow, are when the monitoring protocol is most valuable.\n\n### The evidence sequence: what arrives first and what arrives last\n\nThe three signals arrive in a specific order, and that order matters:\n\n- Yield curve reaction (minutes to hours post-Warsh): If the 2-year yield falls or holds flat, the USD credibility condition stays alive. If it spikes, the breakout thesis is on hold regardless of what AUD/USD does intraday.\n- CNY fixing (Asia open, following trading day): A stronger-than-expected fixing confirms the Asian FX leg is in play. A neutral or weaker fixing means the synchronisation condition has not been met.\n- Weekly AUD/USD close (end of the current week): A close above 0.7275-0.7309 is the definitive confirmation. It arrives last, and the intermediate signals in the right direction do not substitute for it.\n\nFor a reader who wants exposure to a higher AUD, patience in the next few sessions costs less than reacting before all three signals have confirmed. An incomplete convergence is the most likely reason the prior range-extension trades have already faded.\n\nThis article is for informational purposes only and should not be considered financial advice. Investors should conduct their own research and consult with financial professionals before making investment decisions. Past performance does not guarantee future results. Financial projections are subject to market conditions and various risk factors.“
For investors wanting to decode exactly how Warsh’s communication style differs from his predecessors and where the real policy signals are likely to hide on Friday, our dedicated guide to reading the Warsh Jackson Hole speech covers TD Securities’ full framework for interpreting framework language, adjective choice, and deliberate silence rather than explicit rate commitments.
AUD carry positioning has been rebuilding on the back of a July CPI beat that forced ANZ to shift its RBA forecast to a November hike, a repricing that is happening from a no-hike baseline and therefore represents fresh rather than already-embedded yield differential widening.
DXY gains overriding domestic fundamentals is a pattern that has already played out in this cycle: AUD/USD fell 0.14% on 20 August despite Australian manufacturing and services PMIs both printing in expansion territory, because a 0.07% DXY gain was sufficient to cap the pair at its weekly high and invite profit-taking.
The dollar credibility premium at Jackson Hole is doing heavier lifting than in a normal rate environment, with TD Securities identifying a modestly asymmetric risk skew: a hawkish reaffirmation of the inflation target produces only modest USD gains, while a failure to close the credibility gap could produce considerably more meaningful dollar downside.
RBA analysis of AUD determinants identifies Chinese commodity demand and terms-of-trade movements as primary drivers of Australian dollar valuation, providing the institutional grounding for why Asian growth sentiment translates so directly into AUD pricing.