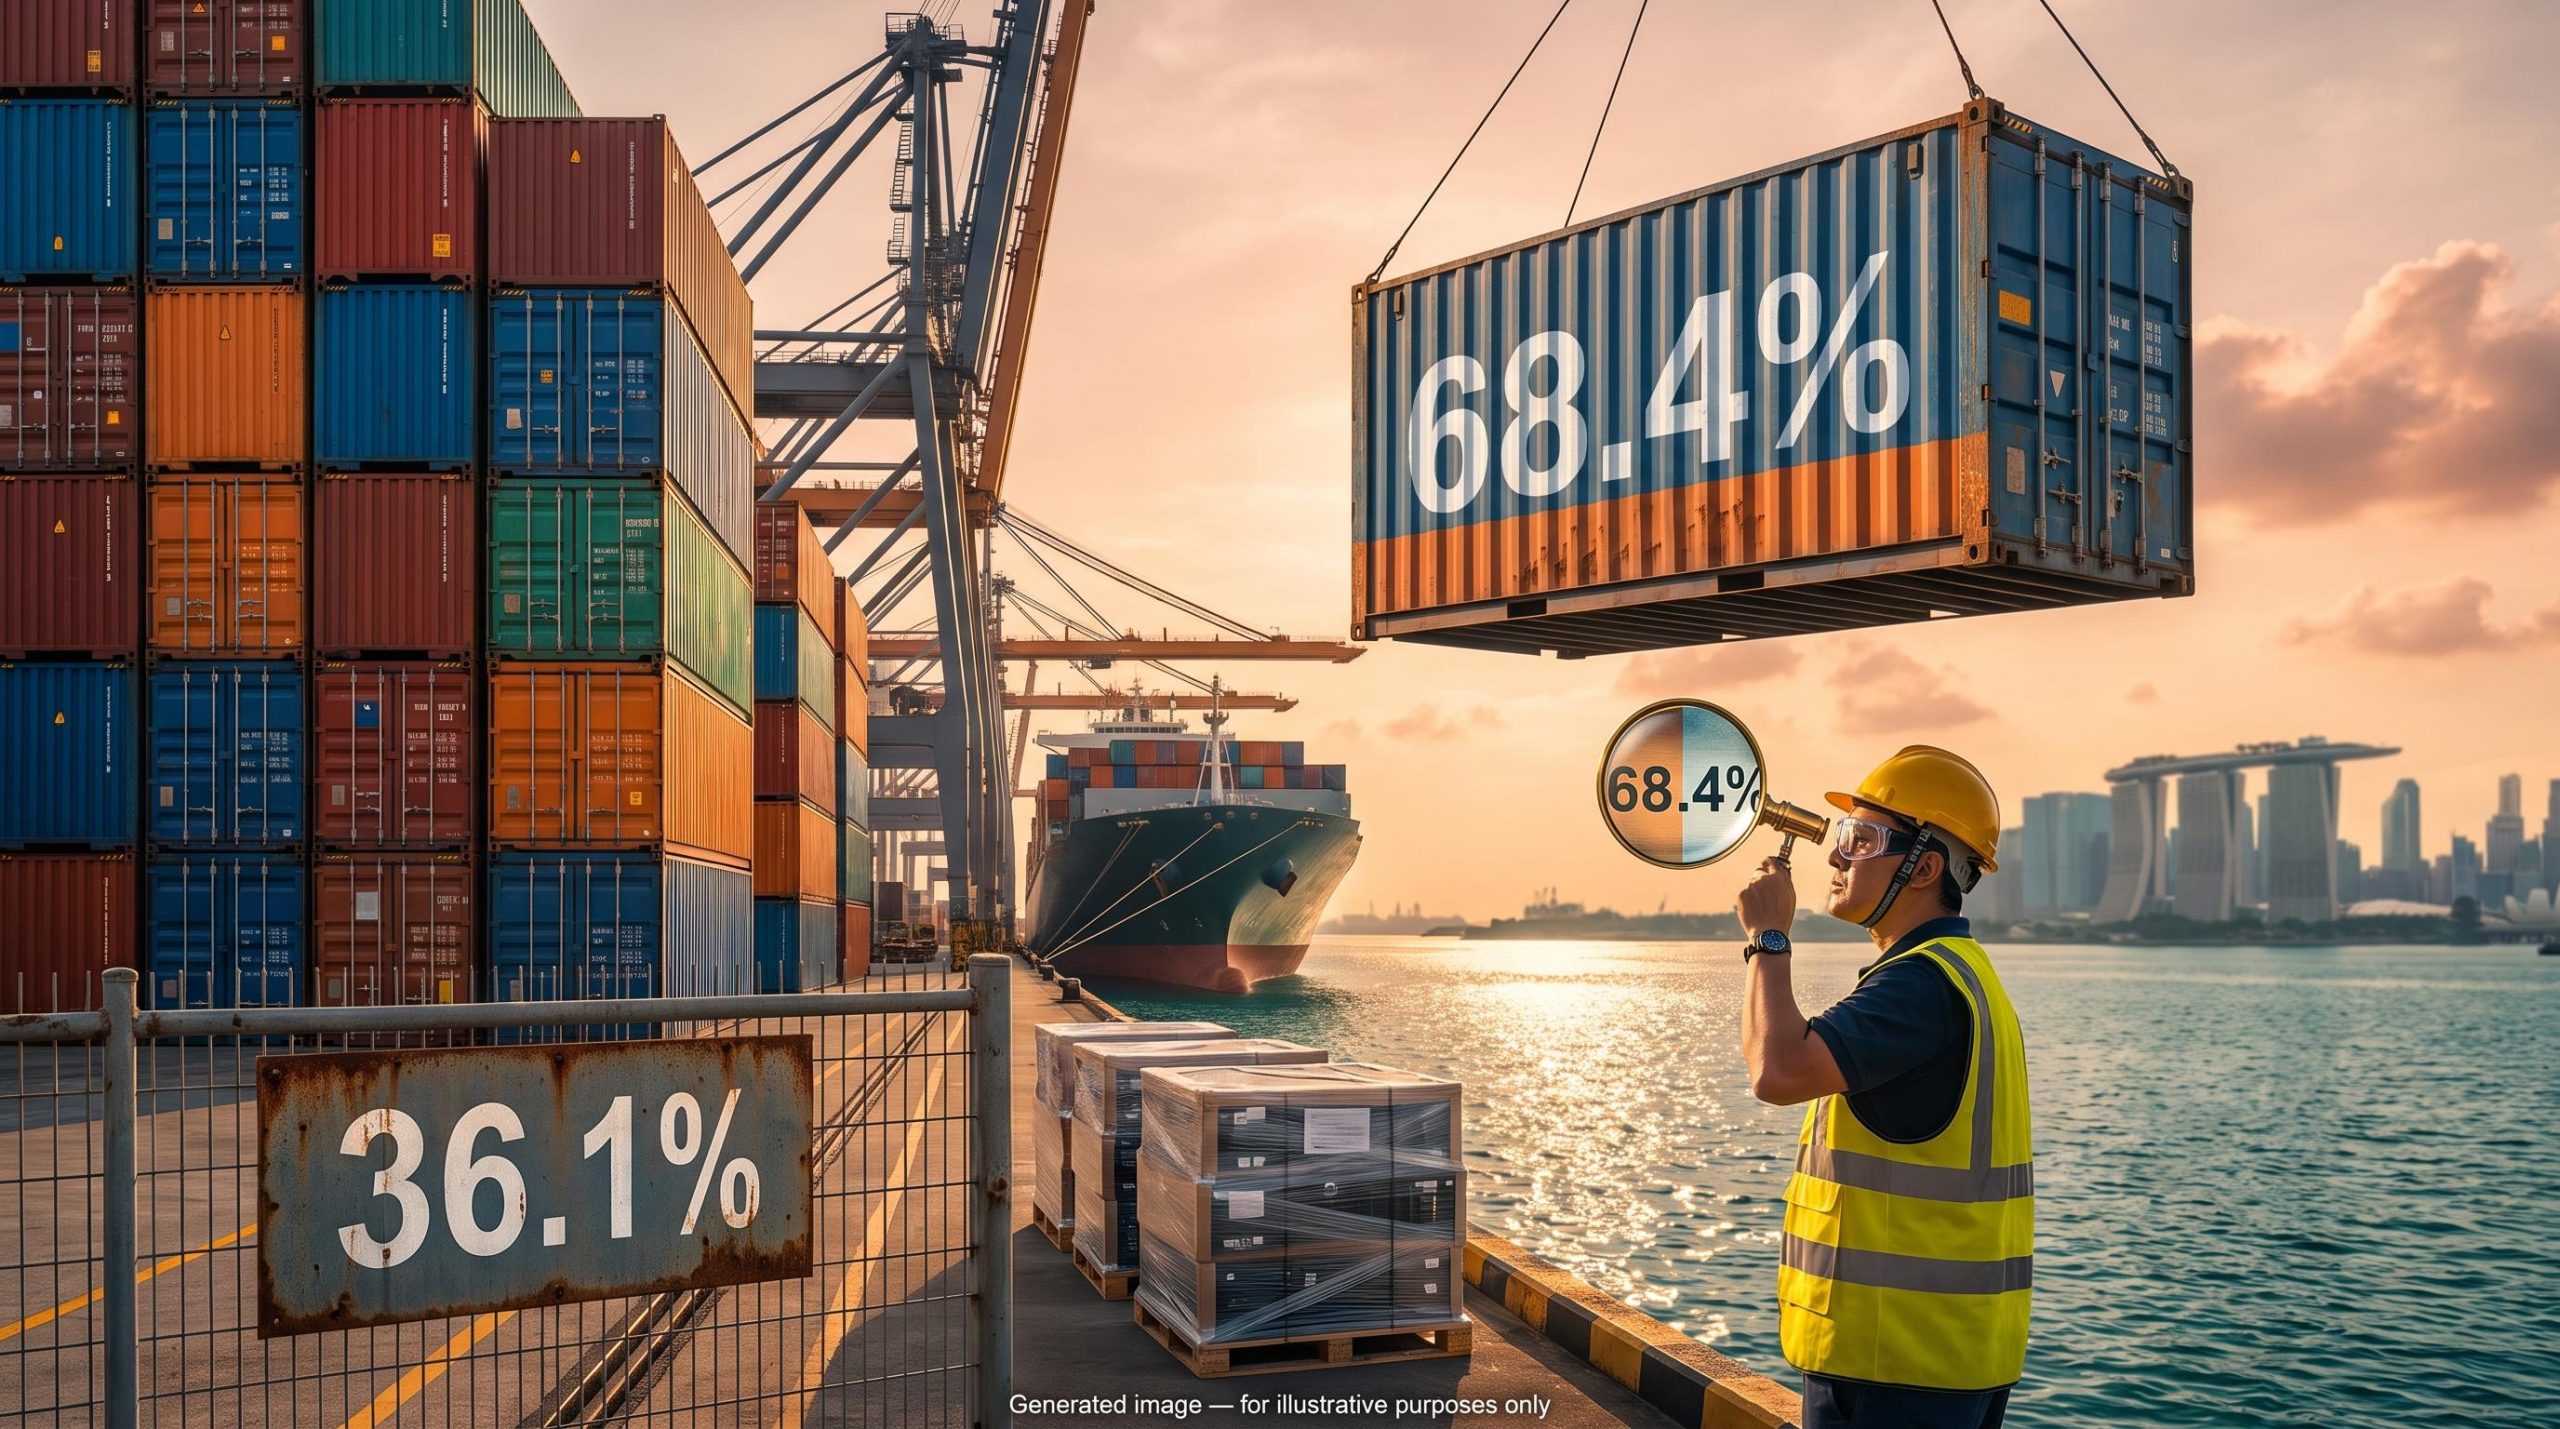
Economists polled by Bloomberg expected Singapore’s non-oil domestic exports to grow 32.2% in September. The print came in at 68.4%, the strongest rise in Singapore NODX since February 1980. Yet USD/SGD barely moved, slipping 0.2% on the day the data landed.
That reaction looks strange until you take the number apart. A single record month can mislead badly if you cannot separate a genuine cycle from lumpy, one-off shipments, and that distinction matters for anyone who reads trade data as a signal about growth or the currency.
The figures, released by Enterprise Singapore on 16 October 2026, have since drawn commentary from Commerzbank, UOB, Maybank and RHB. Their views do not fully agree, and the disagreements are instructive.
Here is how to tell which part of the surge reflects a real AI-led upcycle, which part is noise, and why the Singapore dollar treated a historic export month as a non-event.
What actually drove the 68.4% jump, and how much of it was noise?
The headline is genuinely extraordinary. Exports rose 68.4% year on year, more than double consensus, after August growth was revised up to 46.1%. Total NODX reached S$25.026 billion, against S$19.398 billion in September 2025, according to SingStat data.
The September print followed an equally striking August NODX surge, led by electronics, which suggests the momentum was already building before the record month arrived.
“Strongest since February 1980” is the precise framing. Some reports described it as the highest in nearly four decades, but that undersells the gap, which runs well past forty years.
The real story starts once you split the components.
| Component | September growth (y/y) | Driver or note |
|---|---|---|
| Electronics | +107.6% (reported) | Disk media +312.4%, PCs +149.5%, ICs +74.7% |
| Non-electronics | +54.2% (reported) | Non-monetary gold +124.3%, specialised machinery +50.4% |
| Ship and boat structures | No meaningful rate | About S$3.7 billion of the increase; very low 2025 base |
The component figures are attributed to Enterprise Singapore and SingStat but have not been independently confirmed, so treat them as indicative.
Electronics: the durable engine
Enterprise Singapore attributed the electronics surge to strong AI-related demand. What gives that explanation weight is breadth: disk media, personal computers and integrated circuits (the chips that power servers and devices) all climbed sharply at once.

One giant shipment can inflate a single product line. It cannot lift three at the same time, which is why the electronics data points to a cycle tied to data-centre building and semiconductor investment.
Ships, gold and base effects: the distortion
The non-electronic side tells a different story. Ship and boat structures are delivered in large, irregular batches, and the 2025 base was so low that any growth rate would be meaningless. Maybank reads the surge as a quirk of delivery timing rather than a lasting step-up in capacity.
Gold shipments behave similarly, swinging with flows rather than underlying demand. Strip both out, and the picture changes sharply.
Headline vs underlying UOB estimates September growth excluding ships and non-monetary gold at about 36.1%, roughly half the 68.4% headline.
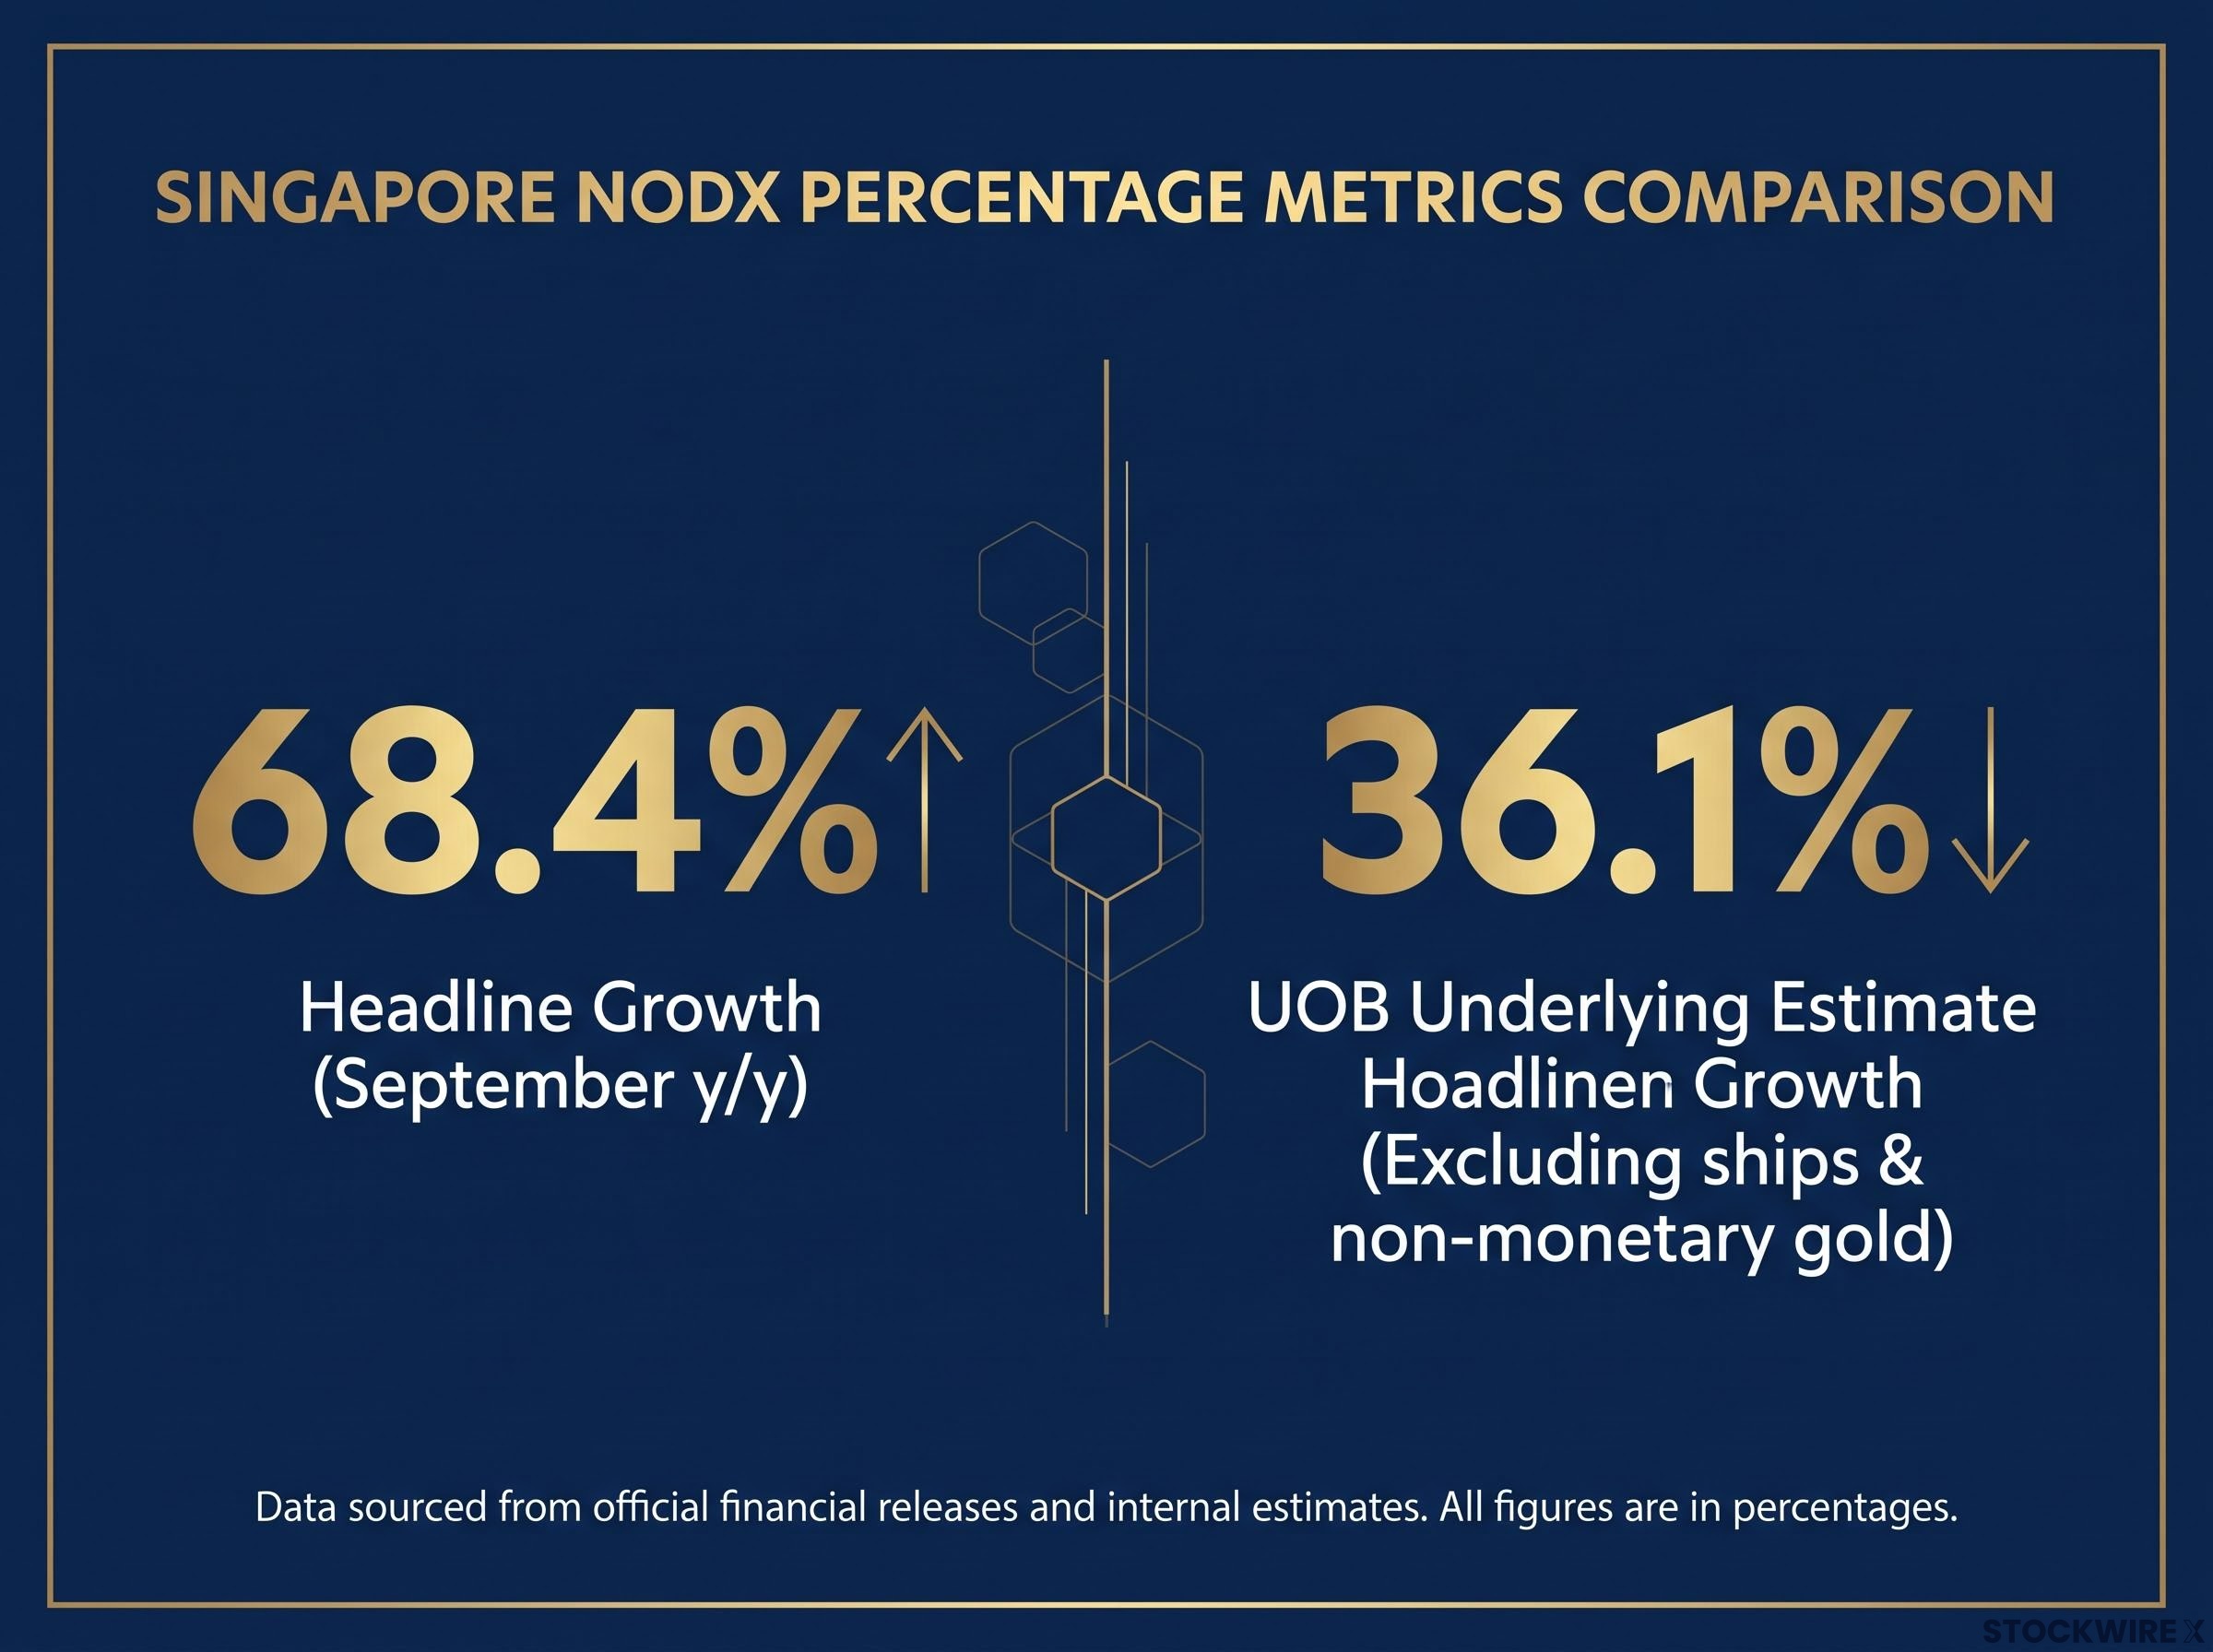
That gap tells you about half the headline is not a trend. For your purposes, 36.1% is the more useful baseline: still strong, especially alongside 27.6% growth for January to September, but not a record.
When big ASX news breaks, our subscribers know first
Why does a record export print not move the Singapore dollar?
If exports nearly doubled their expected pace, you might expect buyers to pile into the currency. Instead, USD/SGD drifted. The calm was rational, and it comes down to how Singapore runs monetary policy.
NODX in plain terms
What NODX measures Non-oil domestic exports (NODX) track goods produced in Singapore, excluding oil, that are shipped abroad. Re-exports, meaning goods that pass through Singapore without being made there, are left out.
Electronics make up a large share of NODX, so the series swings hard with the chip cycle. Add lumpy items such as ships, and monthly readings can lurch in ways that rarely reflect the broader economy.
How the MAS band changes the usual trade-to-currency link
The Monetary Authority of Singapore (MAS) does not steer the economy by setting interest rates. It manages the currency instead. Three features matter:
- The basket: MAS tracks the Singapore dollar against a trade-weighted basket of partner currencies, known as the S$NEER (Singapore dollar nominal effective exchange rate).
- The sloping band: The S$NEER moves within a band that slopes upward, letting the currency strengthen gradually over time.
- The decision cadence: MAS reviews the slope, width and midpoint of the band at scheduled policy meetings.
Because of this framework, the policy slope, not any single export number, sets the medium-term direction. MAS made a slight slope increase on 27 July 2026, then on 14 October 2026 reportedly kept the appreciating slope with band width and midpoint unchanged. Those decision details have not been independently confirmed, but they describe a pause in tightening rather than an easing.
That pause removed the catalyst markets had been watching for. SEB estimated the S$NEER at about 1.71% above the band midpoint, with a slope near 1.25% a year (an unverified figure), so the currency was already sitting firm.
The pause was a genuine surprise, since MAS held its policy band on 14 October despite most surveyed economists expecting tightening, yet the appreciating slope still leans against imported inflation.
For you as a reader of trade data, this means a strong export number in a managed-currency economy tends to show up in policy expectations first, not in spot-rate moves.
Do forecasters agree the strength will last?
The currency’s indifference raises the obvious next question: if markets discounted the surge, do economists think the strength fades too? The answer depends on whom you ask.
Commerzbank expects NODX to stay resilient near term on electronics, but sees growth easing in coming months for four reasons:
- tougher base effects as last year’s comparisons strengthen;
- a maturing AI investment cycle;
- capacity limits on further acceleration;
- ongoing weakness in chemicals.
Commerzbank on the ship lift The bank’s economists judge that the boost from ship and boat exports is unlikely to persist.
RHB takes the more constructive line. Economist Barnabas Gan’s team argues sustained AI demand and record global semiconductor sales should keep momentum going through year-end. Maybank lifted its forecast too, but warns of a sharp slowdown in 2027.
| Institution | 2026 or outlook view | Key caveat |
|---|---|---|
| RHB | +25.0%, up from 15.5% | Relies on AI and chip demand holding |
| Maybank | +27%, up from 18%; about 6% in 2027 | Higher financing costs could slow hyperscaler capex |
| UOB | Underlying September growth about 36.1% | Headline overstated the trend |
| Commerzbank | Growth to ease in coming months | Chemicals weak, AI cycle maturing |
The private forecasts, which remain unverified, leave the official 14-16% forecast looking stale against a 27.6% nine-month pace. The Straits Times also reported pharmaceuticals and petrochemicals stayed weak, and no source quantified any tariff-driven front-loading in September.
Look closely and the split narrows. Optimists and sceptics alike accept that electronics are strong; they differ mainly on how long the AI spending cycle runs.
The record of recent calls is humbling. Consensus sat at 32.2% and DBS expected +28%, which tells you to hold any single forecast, including those above, loosely.
Past performance does not guarantee future results. Financial projections are subject to market conditions and various risk factors.
What should you watch next in Singapore NODX and USD/SGD?
Forecaster disagreement is only useful if it translates into signals you can check. On the currency side, Commerzbank reported USD/SGD at 1.2790 last Friday, down 0.2% on the day and 0.1% on the week.
The range to watch USD/SGD has traded between 1.2740 and 1.2870 since late September.
Commerzbank expects that range trading to continue. Resilient fundamentals support the Singapore dollar, while temporary export components, a maturing AI cycle, capacity limits and cautious MAS guidance argue against a breakout.
The tight range reflects how the S$NEER-implied ceiling caps rallies, with UOB moving to a neutral stance after a sharp whipsaw left spot pressed against resistance.
Four watch-points, in priority order:
- MAS guidance at the next review. Any change to the slope, width or midpoint would move the currency far more than trade data.
- Electronics growth as bases toughen. If electronics keep climbing against harder comparisons, the upcycle case strengthens.
- Whether ship and boat shipments reverse. A sharp drop would confirm the timing-blip reading and drag the headline lower.
- Chemicals and pharmaceuticals. Continued weakness keeps non-electronic breadth thin.
One honest limit: a source-backed history of past NODX spikes and how MAS or USD/SGD responded was not found, so no historical analogue is offered here.
A breakout in USD/SGD is more likely to follow a change in MAS guidance or a sustained shift in underlying electronics growth than another headline-grabbing export print.
These statements are speculative and subject to change based on market developments.
What the record print changes, and what it leaves untouched
September confirmed that Singapore’s electronics upcycle is real, broad and strong enough to push private forecasts well above the official range. It also showed how far ships and gold can inflate a single month, with underlying growth closer to half the headline.
The currency regime absorbed the surprise as designed. With MAS holding its slope steady, there was no new reason for USD/SGD to break its range.
The practical decision for you is where to anchor. Judge Singapore’s export health on the underlying growth rate and on MAS signals, not on a single record number that will likely look less dramatic once the lumpy items wash out.
This article is for informational purposes only and should not be considered financial advice. Investors should conduct their own research and consult with financial professionals before making investment decisions.