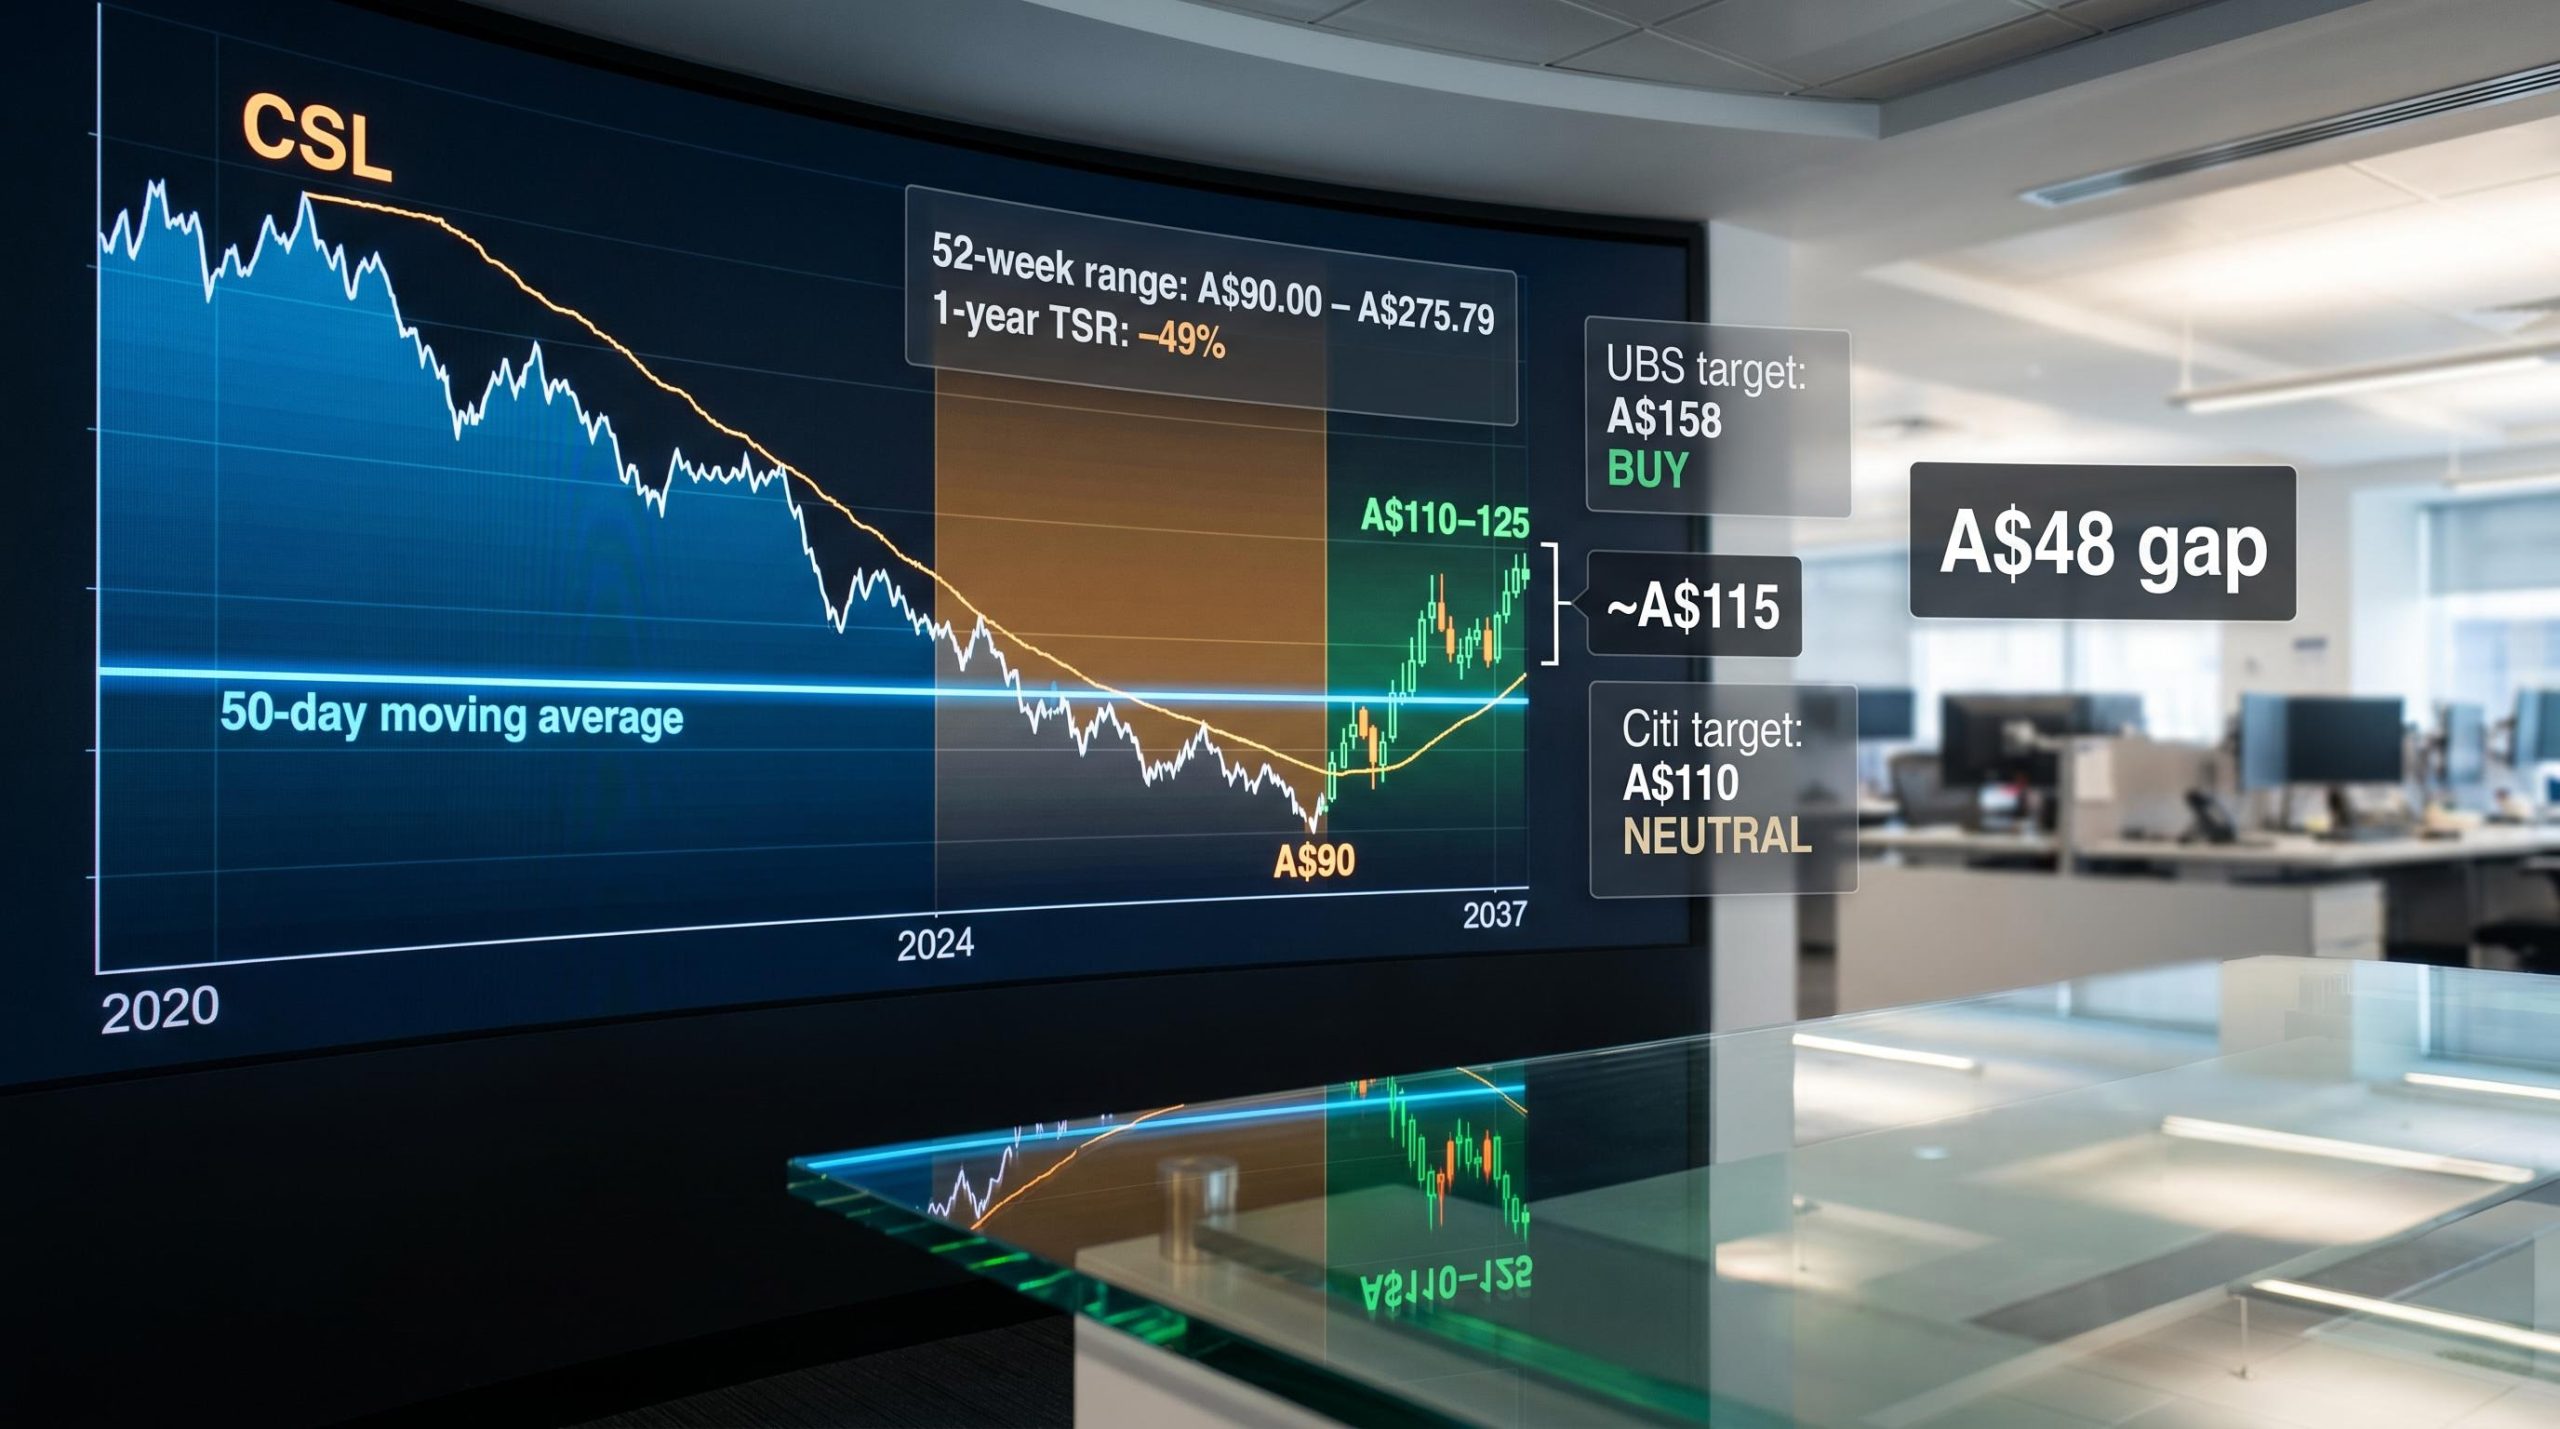
CSL is up 35.5% in a month. The stock cleared A$90 in early June and pushed into the A$110-125 range by early July, surpassing its 50-day moving average for the first time since August 2025. For anyone watching the chart alone, this looks like the start of something.
Then the wider frame comes into focus. The 52-week range runs from A$90.00 to A$275.79. One-year total shareholder return sits at approximately negative 49-50%. Year-to-date performance remains deeply negative. The same stock that just rallied 35.5% is still trading at its lowest valuation multiples in over a decade, and the brokers covering it cannot agree on whether it is worth A$110 or A$158.
Here is a framework for deciding whether this move is different from the earlier bounces, and what specific evidence would need to materialise before the recovery qualifies as something more than technically significant.
What the 35.5% rally actually looks like on the chart
The recovery began from an early June low near A$90, which followed a 15.9% single-day collapse on 11 May 2026 (according to Market Index analysis by Kerry Sun; other sources cite 18-22%). From that low, CSL shares climbed approximately 35.5% into the A$110-125 range by early July.
The notable technical threshold here is the breach of the 50-day moving average, which the stock had not managed to reclaim since August 2025. That crossing signals the stock has broken above its recent average selling price, a momentum indicator that had failed to trigger during several earlier bounce attempts over the prior two years.
The key price data points:
- Early June 2026 low: approximately A$90
- Early July 2026 trading range: A$110-125
- 52-week range: A$90.00 to A$275.79
- 1-year total shareholder return: down approximately 49-50%
52-week range: A$90.00 to A$275.79. The distance between the low and the high tells you how much ground remains lost, not how much has been recovered.
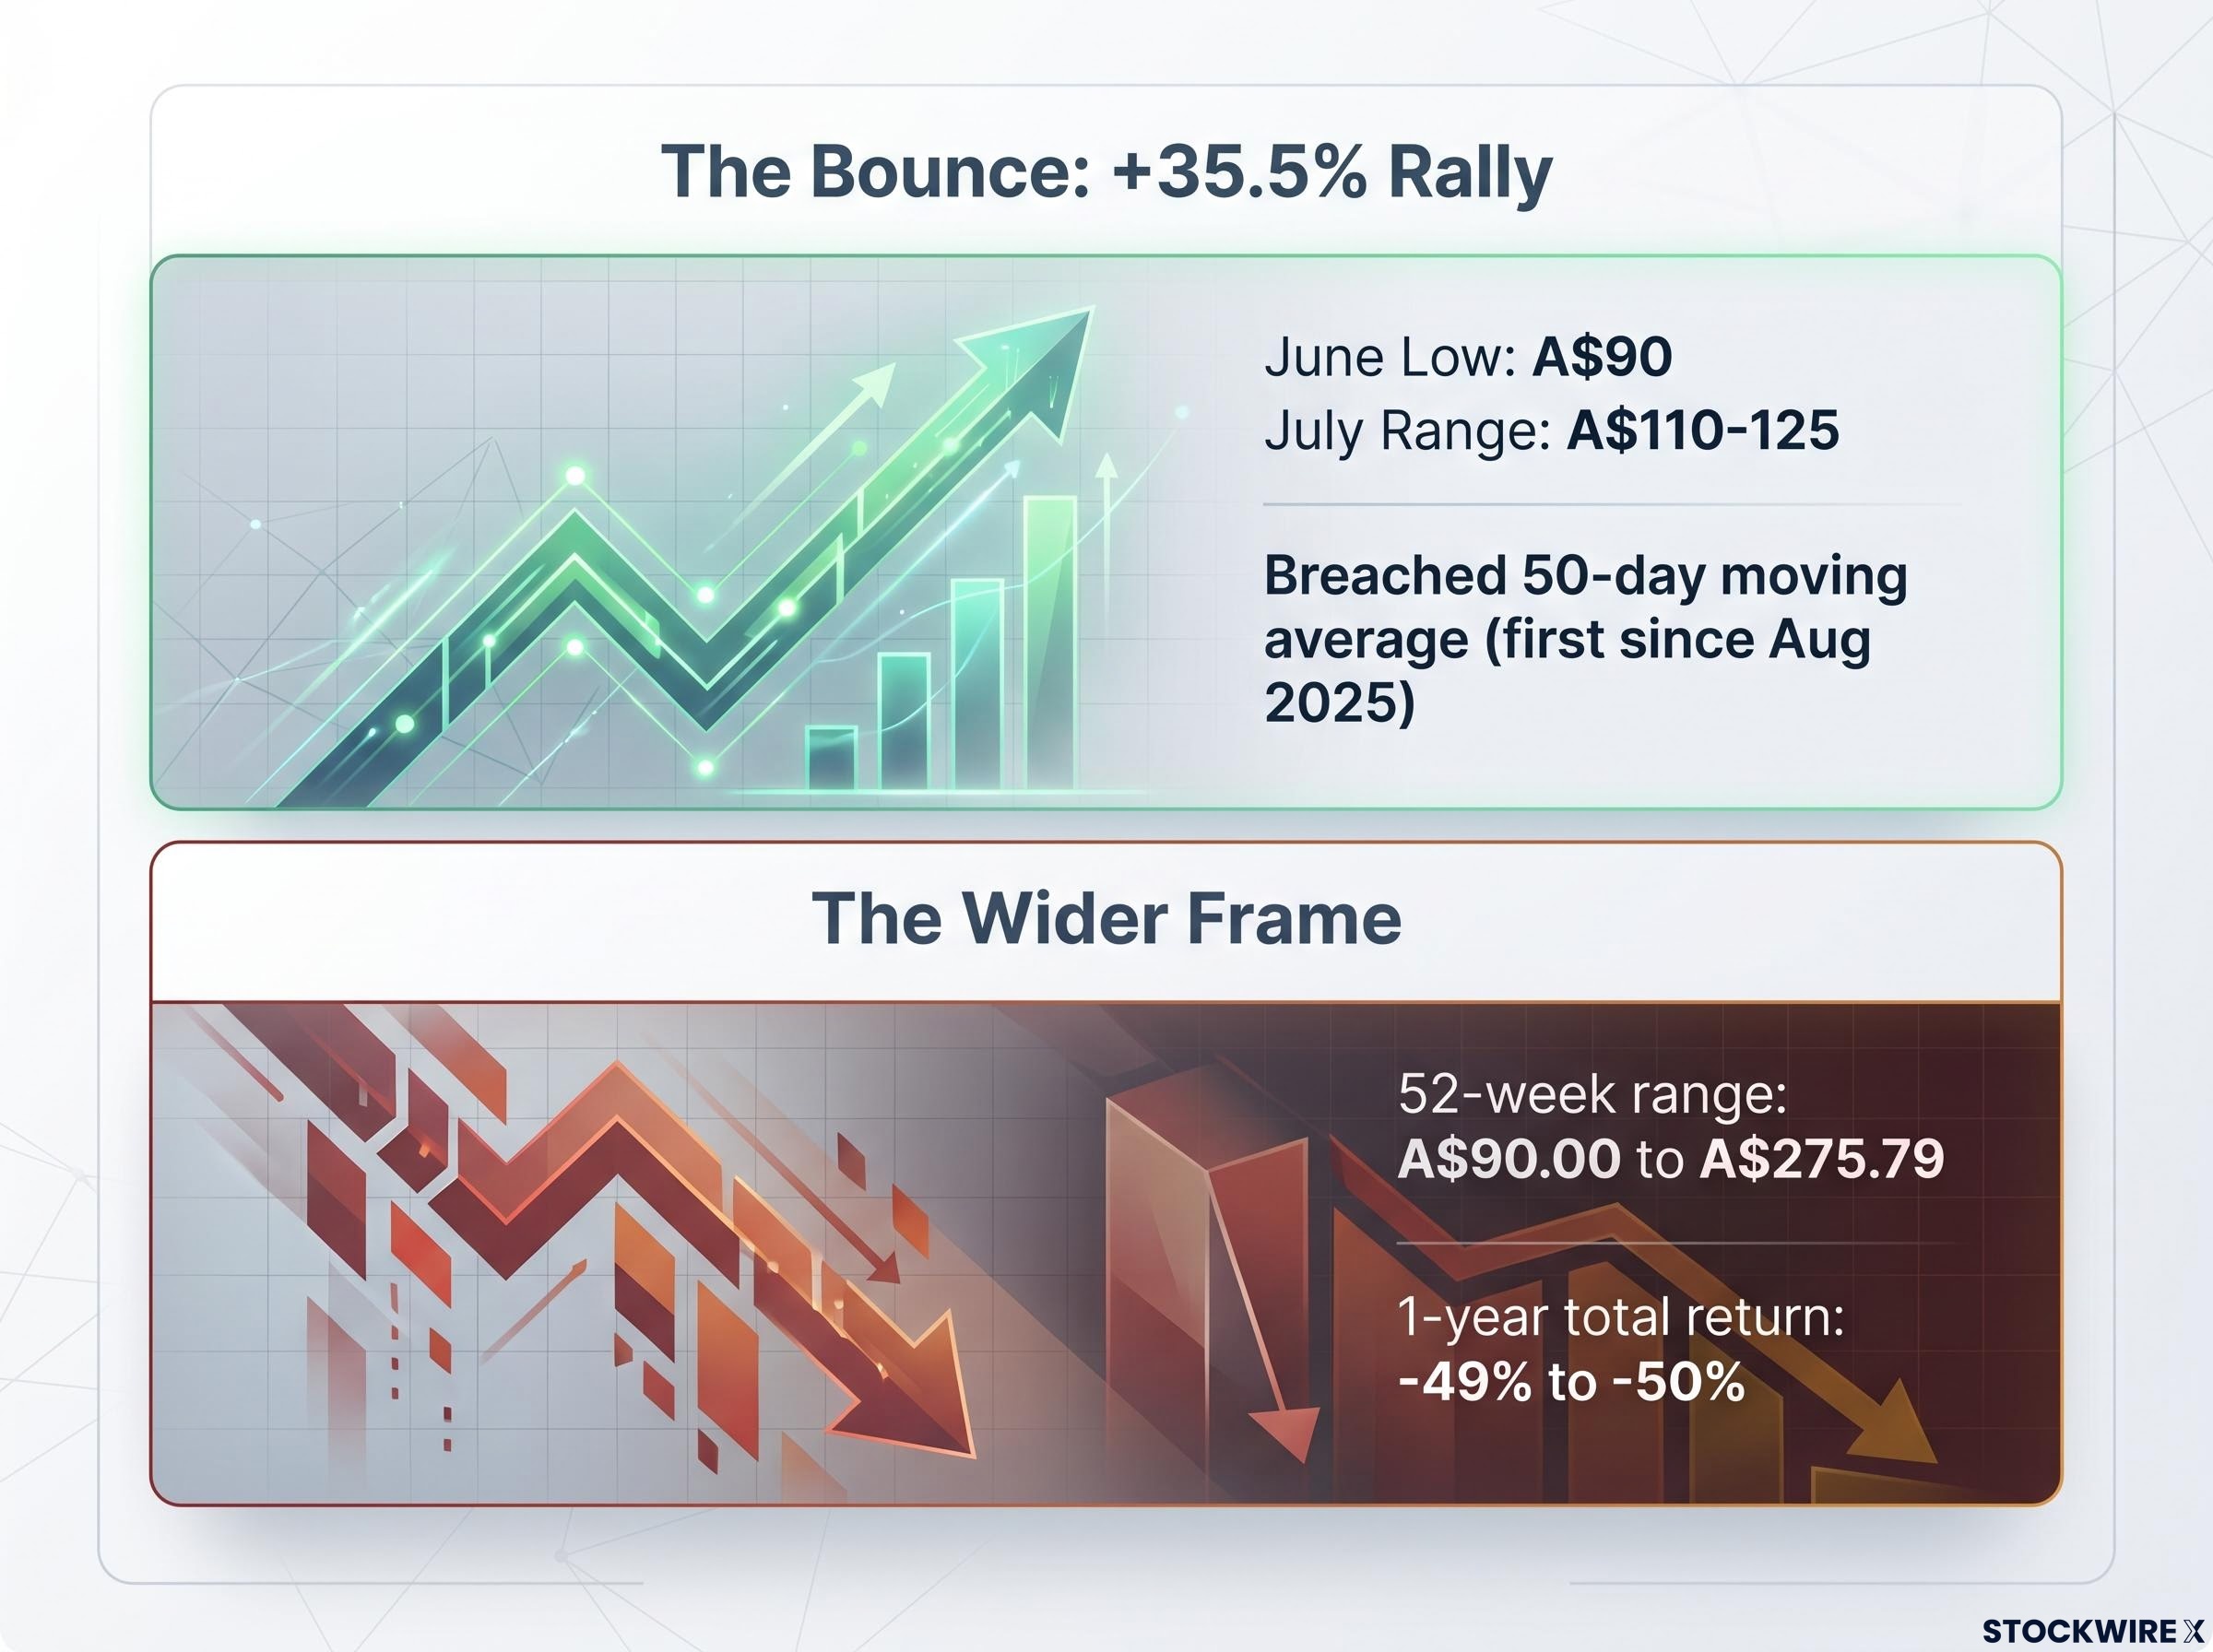
A 35.5% bounce from a capitulation low is not the same as a 35.5% recovery in an investor’s position. If you held through the decline, this rally returns you to a price that itself represents a loss of roughly half your position value over the past year. The bounce is real. The recovery, measured against where the stock traded twelve months ago, is barely underway.
When big ASX news breaks, our subscribers know first
How CSL’s share price got here: the two-year decline explained
The decline was not a single shock. It compounded across multiple reporting periods, each one resetting expectations lower.
The single-day collapse that reset expectations was the guidance downgrade event on 11 May 2026, when CSL shed A$9.48 billion in market capitalisation as a US$5 billion Vifor impairment charge and negative revenue growth guidance arrived simultaneously, compressing a five-year premium valuation into a single session.
CSL operates three divisions: CSL Behring (plasma-derived therapies, the core business), Vifor (nephrology and iron therapies, acquired to diversify revenue), and Seqirus (influenza vaccines, currently subject to a paused demerger). Of these, Vifor has been the primary source of damage.
In early 2026, management revised FY26 profit guidance downward, with NPATA (net profit after tax and amortisation, a measure of underlying earnings that strips out acquisition-related accounting) reset to approximately US$3.1 billion against prior estimates near US$3.3 billion. Growth expectations that had been framed at 4-7% were abandoned entirely. The company also disclosed approximately US$5 billion in anticipated pre-tax impairment charges, concentrated in the Vifor portfolio and related assets. One major update saw statutory profit fall 81% and underlying profit drop approximately 7%. The CEO departed in early 2026.
ASX continuous disclosure obligations require listed companies to release market-sensitive information immediately, which means each guidance revision and impairment disclosure that reset expectations during CSL’s two-year decline was subject to mandatory, real-time release rather than managed communication on management’s preferred timeline.
What makes this context directly relevant to the current rally is the pattern it established: throughout the two-year downtrend, CSL staged several interim recoveries in the 10-15% range, and in each case a subsequent earnings downgrade erased the gains and drove the stock to a new multi-year low. The market has seen this movie before.
The Vifor problem in plain terms
Vifor was acquired for its nephrology and iron therapy portfolio, and the original revenue expectations proved too optimistic. Two headwinds remain active and ongoing, not one-off events:
- China albumin pressure continues to weigh on the division’s revenue base
- Kidney-drug competition has intensified, compressing margins and market share
- Macquarie’s revised Vifor gross margin forecast settles at approximately 62.5% from FY27 onward, embedding permanently lower Vifor profitability into broker models
These are structural headwinds. They do not resolve with a single quarter of better-than-expected results.
Sector tailwind or company-specific recovery: what is actually driving the move
Two explanations for the rally compete with each other, and the balance between them determines how durable the move is likely to be.
The S&P 500 Healthcare sector climbed 10.2% over the same period beginning 3 June 2026. UBS attributed the healthcare sector’s strength to year-end fund rotation and momentum in US biotech stocks rather than any CSL-specific development. CSL, as a large-cap healthcare name trading at depressed multiples, was a natural beneficiary of that rotation.
On the company side, there is no new positive operating news underpinning the rally. No earnings beat, no strategic announcement, no CEO appointment. The move reflects selling exhaustion and revised value perception at a forward P/E of approximately 11-13x, materially below historical multiples. Multiple commentators describe it as a “relief rally” driven by oversold conditions.
| Driver | Type | Evidence | Investor implication |
|---|---|---|---|
| S&P 500 Healthcare +10.2% | Sector-level | UBS cites year-end rotation, US biotech momentum | Can reverse without CSL-specific improvement |
| Oversold conditions and value buying | Company-level (technical) | Forward P/E of ~11-13x, depressed sentiment | Attracts buyers, but reflects low expectations not recovery |
| No new positive operating news | Absence of catalyst | No earnings beat, no strategic update, no CEO appointment | Rally lacks fundamental anchor |
| 50-day MA breach | Technical signal | First breach since August 2025 | Momentum signal, not earnings signal |
If sector rotation and oversold conditions are the primary fuel, the same forces can reverse without warning. They are not anchored to any improvement in CSL’s own earnings power. Separating what belongs to the broader healthcare move from what belongs to CSL specifically is the most important step before deciding whether this rally has durable legs.
For investors exploring whether CSL’s sector tailwind has room to continue, our dedicated guide to ASX healthcare sector recovery examines why institutional giants including AustralianSuper and Hostplus have been quietly building positions in global earners, and what the five-year de-rating cycle implies for the duration of any rotation.
What the broker target gap tells you about embedded uncertainty
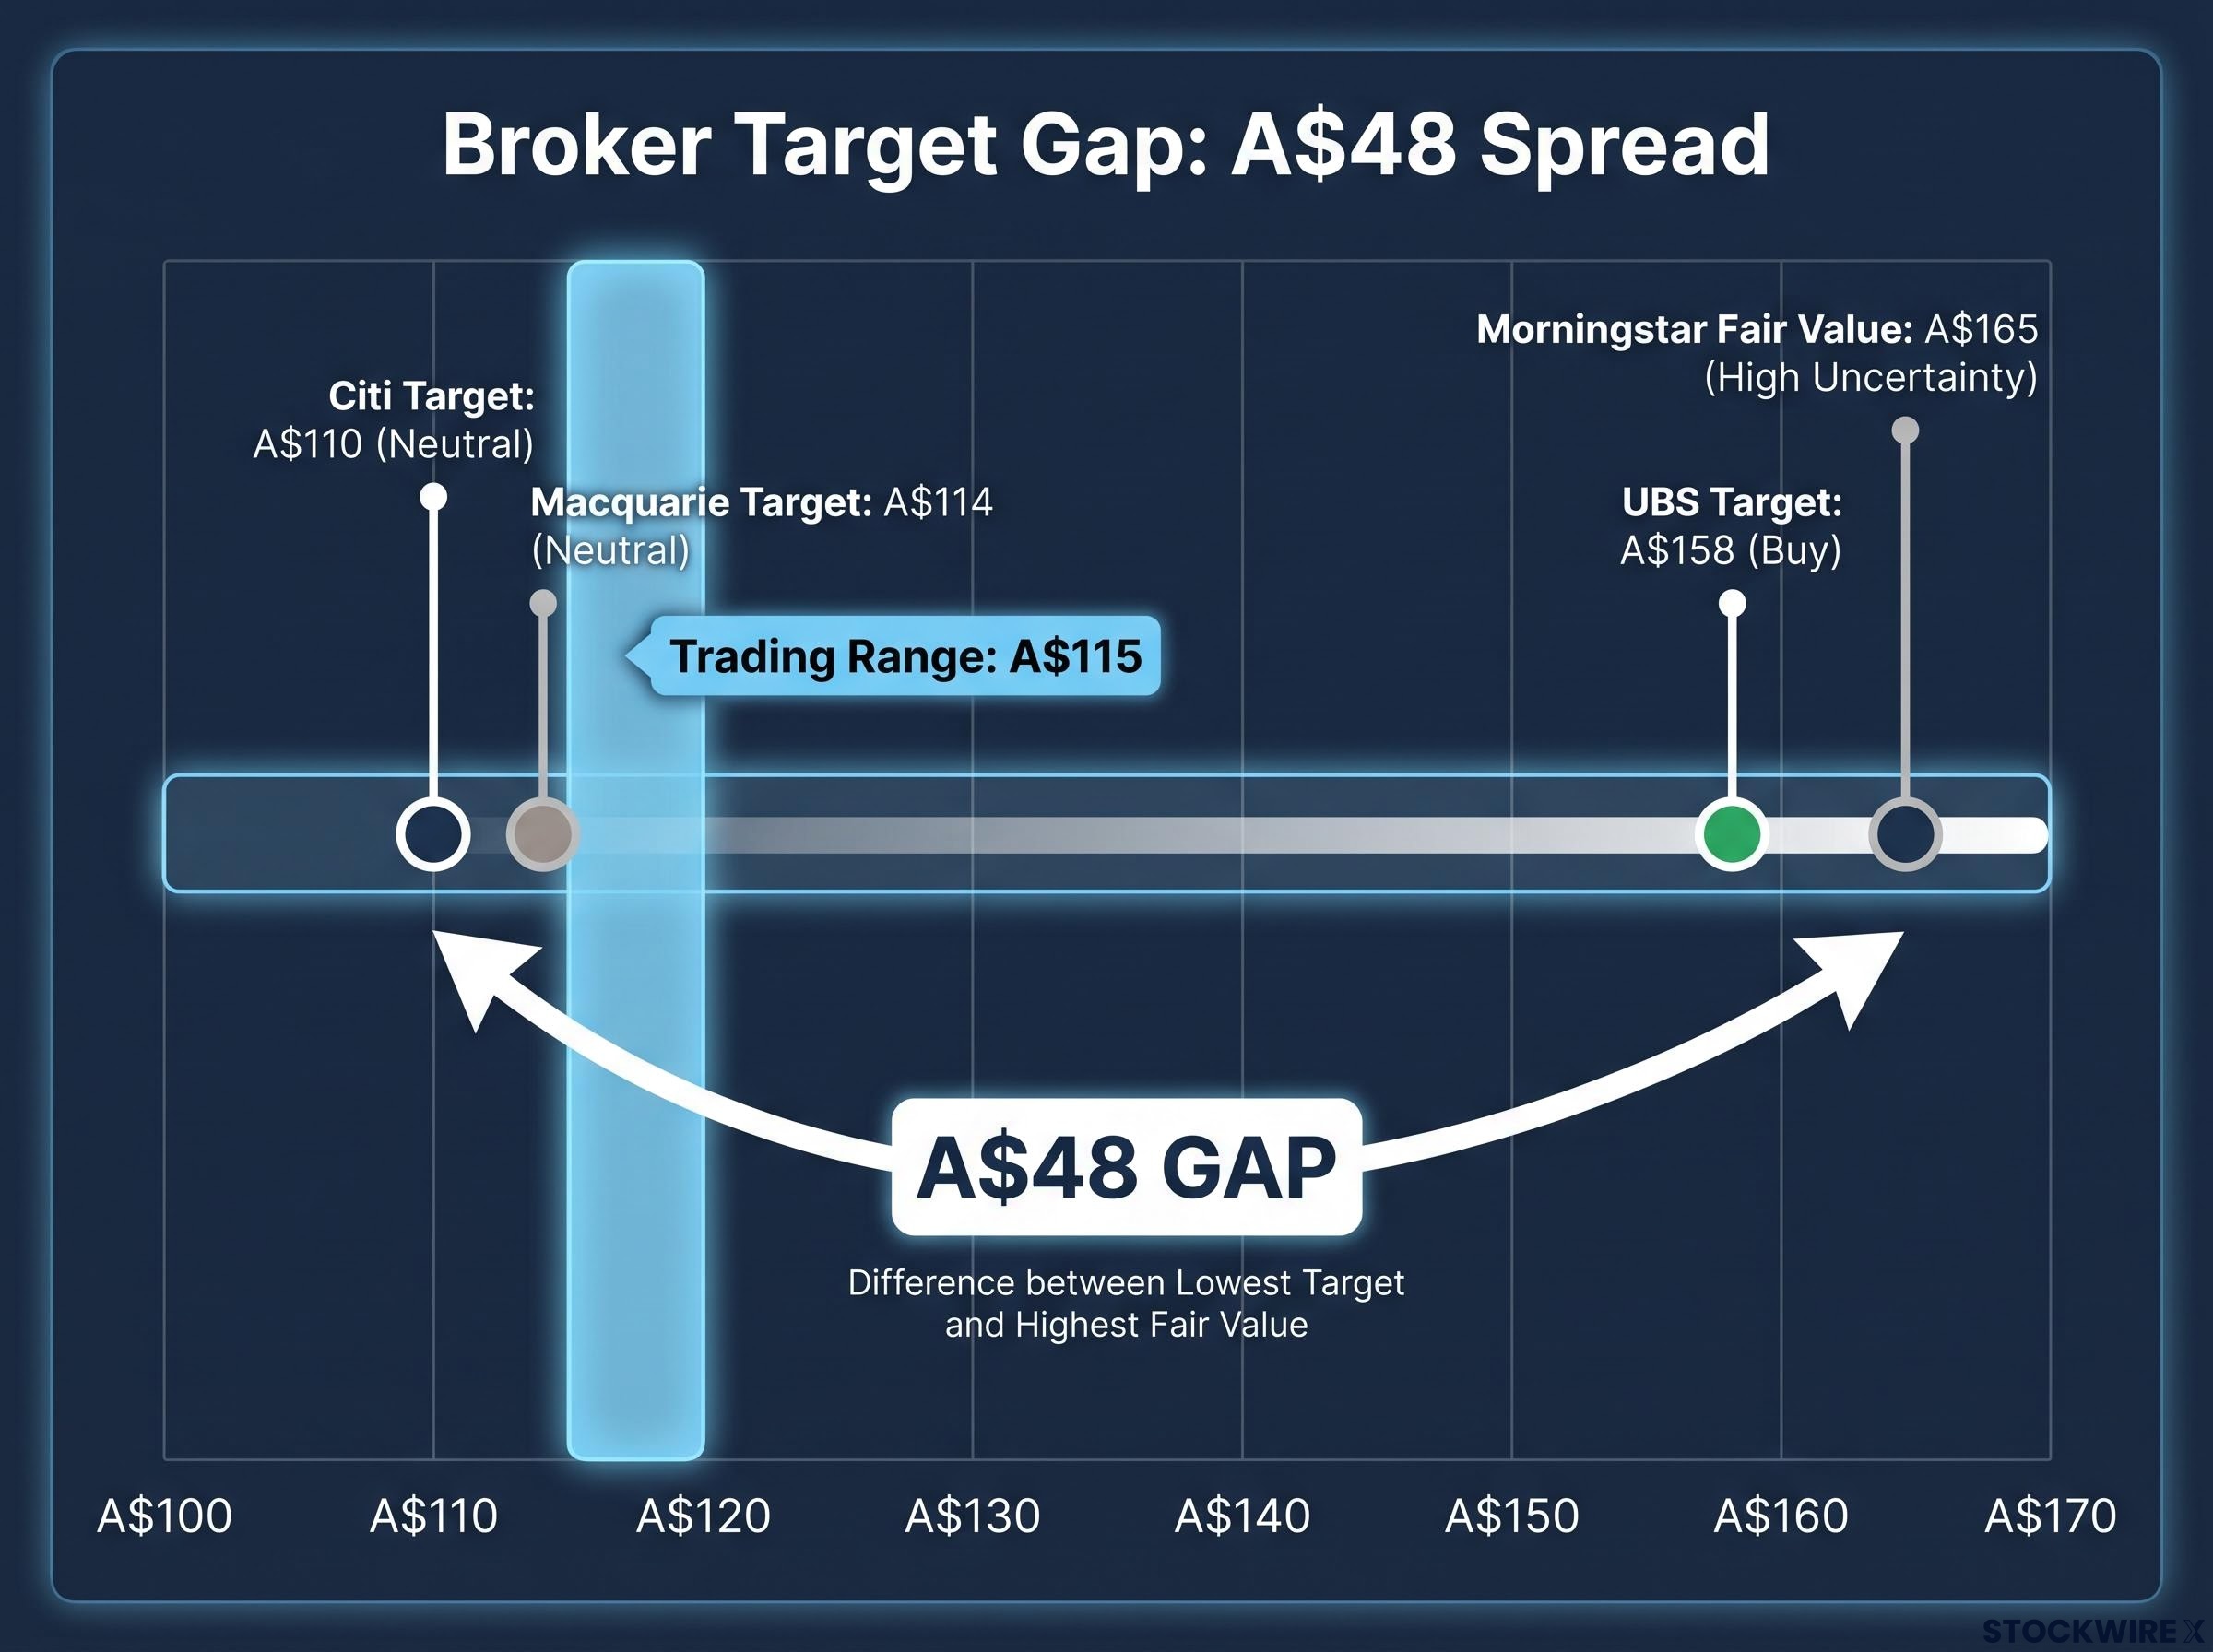
UBS set a Buy rating with a target of A$158 on 1 July 2026. The day before, Citi set a Neutral rating with a target of A$110. Macquarie landed between them at A$114, Neutral, on 29 June 2026. Morningstar maintains a fair value estimate of A$165 with a High Uncertainty rating.
That is a A$48 gap between the lowest and highest named broker targets on a stock trading around A$115.
| Broker | Rating | Price target | Key rationale | Key risk cited |
|---|---|---|---|---|
| UBS | Buy | A$158 | Turnaround potential in plasma therapies | Next results period not expected to demonstrate better competitive conditions or advancement on the CEO search |
| Citi | Neutral | A$110 | Current price reflects subdued outlook | Vifor competitive pressure, no permanent CEO |
| Macquarie | Neutral | A$114 | Target raised from A$111 on lower AUD/USD assumption | EPS estimates cut; Vifor margin structurally lower |
| Morningstar | N/A | A$165 (fair value) | Turnaround-assumed valuation | High Uncertainty rating; downgrades, impairments, fiercer competition |
The Macquarie detail deserves particular attention.
Macquarie moved its target higher from A$111 to A$114, yet at the same time reduced EPS forecasts by 0%, -3%, and -4% across FY26-FY28. A weaker AUD/USD assumption drove the target lift, while the underlying profit outlook deteriorated. The stock received a higher target alongside a worse earnings trajectory.
Where these brokers agree is also telling: Tavneos-related revenue risk is already priced in, the absence of a permanent CEO is a shared concern, and Vifor competitive pressures persist across all three views.
A A$48 spread between the lowest and highest targets on a stock at A$115 is not a normal dispersion for a large-cap blue chip. It tells you that institutional analysts with full access to management cannot agree on what this business is worth. That is a direct measure of the risk you absorb at this price.
The four checkpoints that separate a technical rally from a real turnaround
The distinction matters because CSL currently meets the criteria for the first category but not the second.
What “technically significant” actually means
A 50-day moving average breach signals that the stock has broken above its recent average selling price. It is a sentiment and momentum indicator, not an earnings signal. Oversold conditions and relief rallies are real market phenomena with genuine price consequences, but they are temporary without fundamental support. “Technically significant” means the move is real and not noise, but does not by itself indicate the direction of the next twelve months.
The higher bar, a fundamentally validated turnaround, requires a different set of evidence entirely. Here are the four checkpoints that would separate the current rally from the false starts that preceded it:
- Consecutive EPS and margin improvement across H2 FY26 and FY27 results. A single “less bad than feared” quarter is not sufficient. The test is several consecutive periods of measurable improvement.
- Vifor stabilisation evidence in gross margin data and competitive position. Macquarie’s approximately 62.5% gross margin assumption from FY27 onward is the baseline. Exceeding it would be the first positive signal in the Vifor narrative since acquisition.
- A permanent CEO appointment with a coherent capital allocation narrative, particularly on Vifor’s role within the portfolio and Seqirus’s future.
- Seqirus strategic clarity, including resolution of the paused demerger question and a clear articulation of the division’s capital allocation priority.
The practical implication: you now have a specific set of observable, dateable events to monitor rather than trying to time price action. If these four checkpoints begin resolving positively, the current price could look cheap in retrospect. If they disappoint again, this rally will have offered an exit opportunity, not an entry point.
What this means for your CSL position before the next results
Two rational investor positions exist given this evidence, and they are distinguished by time horizon and conviction on the structural questions.
If you believe CSL can restore pre-downturn margins over several years, the current forward P/E of approximately 11-13x and the stock’s position in the A$110-125 range may still represent attractive value even after a 35.5% rally. Morningstar’s fair value of A$165 assumes this turnaround plays out. That is a substantial gap above where the stock trades today.
The plasma franchise recovery thesis rests on CSL Behring’s exposure to a global immunoglobulin market projected to grow from US$52 billion in 2025 to US$104 billion by 2033, a structural demand trajectory that has no widely available biosimilar substitute and that underpins the bull case regardless of how Vifor or Seqirus resolve.
If you are uncertain whether Vifor, Seqirus, and leadership questions can be resolved, the rally represents a risk-reduction opportunity rather than a reason to add. Citi’s target of A$110 sits very close to the current price, which means on the bear case, you could be at or near fair value within a single downgrade cycle.
The valuation range in context: Citi’s bear-case target of A$110 and Morningstar’s turnaround-assumed fair value of A$165, with the stock at approximately A$115-125, tells you the downside risk on the pessimistic view is limited but immediate, while the upside requires several years of execution to realise.
The specific events that will materially change the analytical picture:
- H2 FY26 results (earnings and margin trajectory)
- FY27 results (consecutive improvement test)
- Permanent CEO appointment and strategic narrative
- Seqirus strategic update and demerger resolution
This article is for informational purposes only and should not be considered financial advice. Investors should conduct their own research and consult with financial professionals before making investment decisions.
Past performance does not guarantee future results. Financial projections are subject to market conditions and various risk factors.
Three variables to watch before the next CSL results cycle
The analysis has moved from price recovery, through deterioration history, to rally drivers, broker disagreement, and a four-checkpoint framework. Three specific variables will determine whether that framework resolves in favour of buyers or sellers.
- H2 FY26 NPATA relative to the reset US$3.1 billion guidance. This is the base against which the market will measure the next results. Any margin commentary on CSL Behring will signal whether the core plasma business is carrying enough momentum to offset Vifor drag.
- A permanent CEO appointment and the strategic narrative they bring. The market needs clarity on Vifor’s role within the portfolio, on Seqirus’s future, and on how capital will be allocated across the three divisions. Until a permanent leader articulates that vision, the stock trades with a leadership discount.
- Vifor gross margin data in the next results. Macquarie built its models around a Vifor gross margin of approximately 62.5% from FY27 onward as the expected baseline. Results that confirm or challenge that figure will either validate the permanently lower Vifor thesis or begin to undo it.
The wide broker target range, from Citi’s A$110 to UBS’s A$158, will begin to compress only when these variables start resolving. Until then, the uncertainty premium in the stock is rational, not an error.
The absence of negative surprises in the next results cycle is necessary but not sufficient. The market is looking for positive evidence of trajectory, not merely the absence of another downgrade. If even one of these three variables resolves clearly in a positive direction, the broker target range should narrow toward the upper end. If all three disappoint, this rally will have been the exit opportunity that value investors needed.