Barclays Warns of Prolonged Market Volatility Under New Fed Reality
18 hrs ago
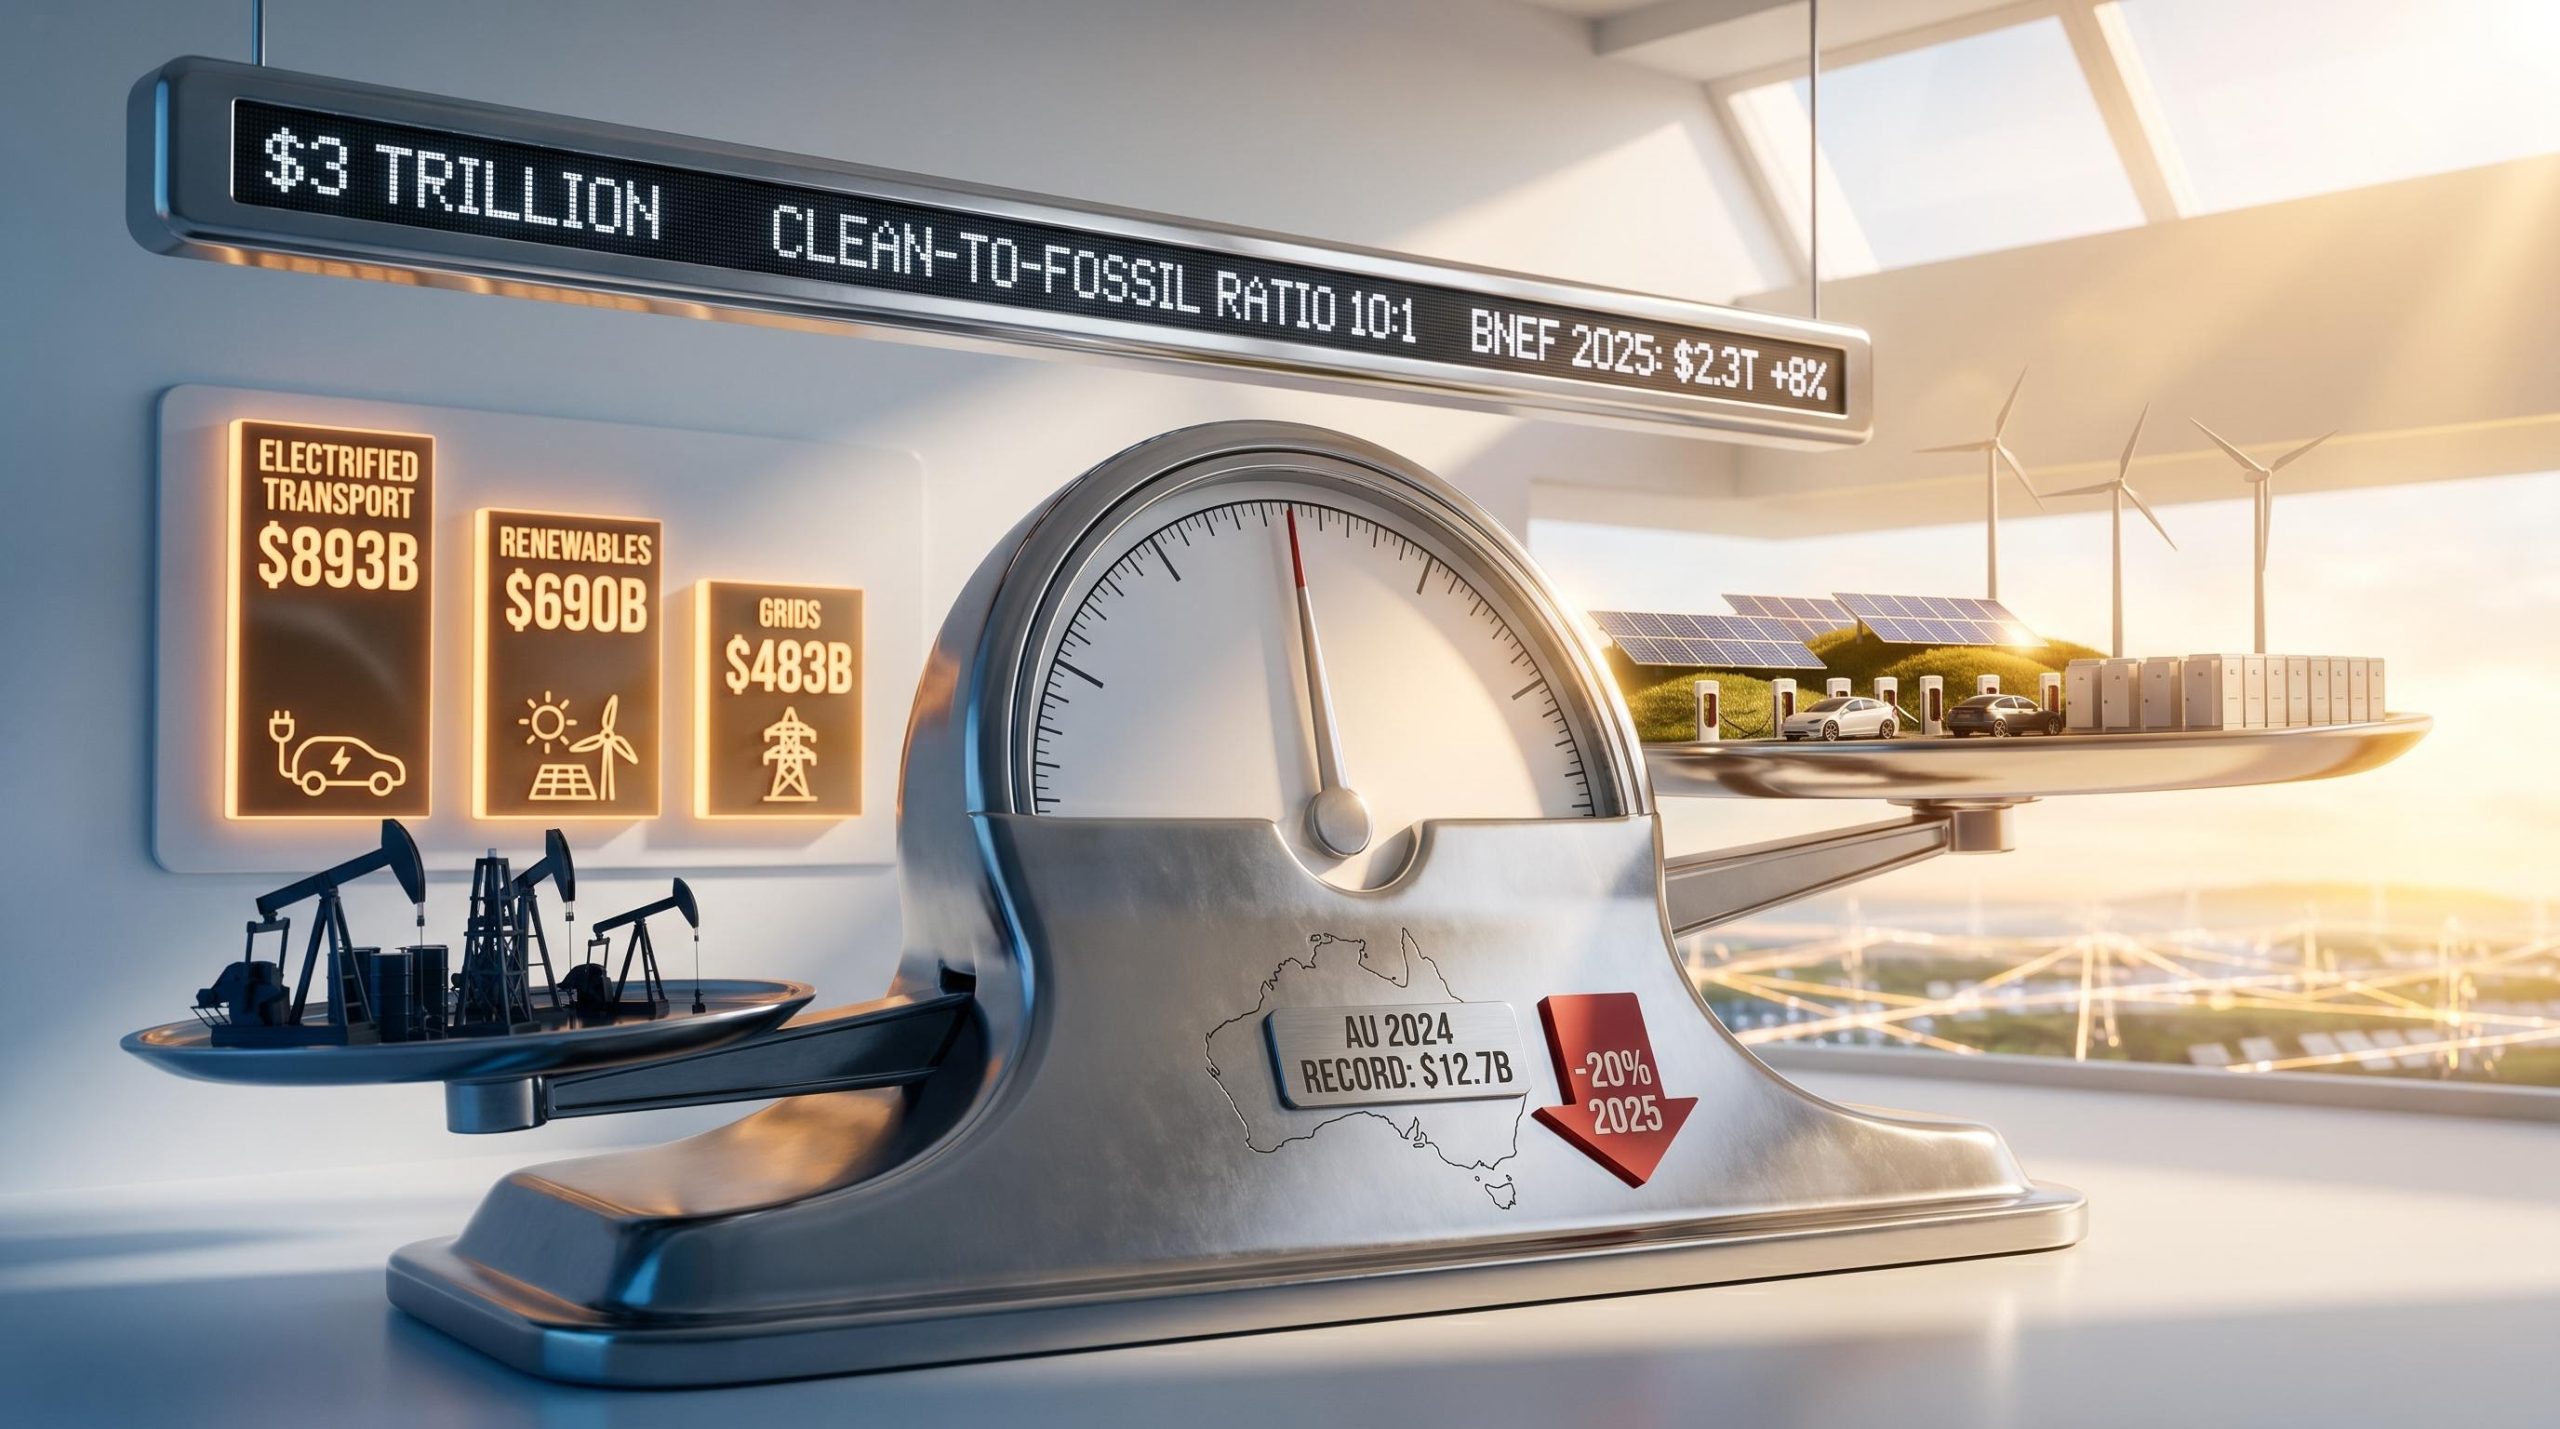
Global energy investment surpassed $3 trillion in 2024, with clean energy attracting roughly twice the capital flowing into fossil fuels. A decade ago, the ratio of clean-to-fossil investment sat at approximately 2:1. By the mid-2020s, that ratio has widened to 10:1. The scale and persistence of this capital reallocation has prompted analysts to characterise clean energy investment not as a thematic trade but as a structural repositioning of the global economy. For Australian investors, the question is no longer whether the transition is real but whether domestic conditions allow portfolios to capture what global capital flows are generating.
This analysis examines what the $3 trillion milestone actually reflects, where structural and cyclical forces diverge, how Australia’s investment picture differs from the global headline, and what risk-adjusted positioning looks like for investors as of April 2026.
The headline figure is large. The ratio beneath it is what matters.
The clean-to-fossil energy investment ratio shifted from approximately 2:1 in 2015 to 10:1 by the mid-2020s, a reallocation of capital at a pace that few structural transitions in energy history have matched.
According to the International Energy Agency (IEA), total global energy investment exceeded $3 trillion in 2024, with clean energy comprising approximately $2 trillion. The IEA projects that figure reaching a record $3.3 trillion in 2025. BloombergNEF’s full-year 2025 data confirmed the trajectory continued beyond the 2024 milestone, reporting $2.3 trillion in energy transition investment, up 8% year-on-year. Clean energy supply investment outpaced fossil fuels by $102 billion in 2025, widening from an $85 billion gap in 2024.
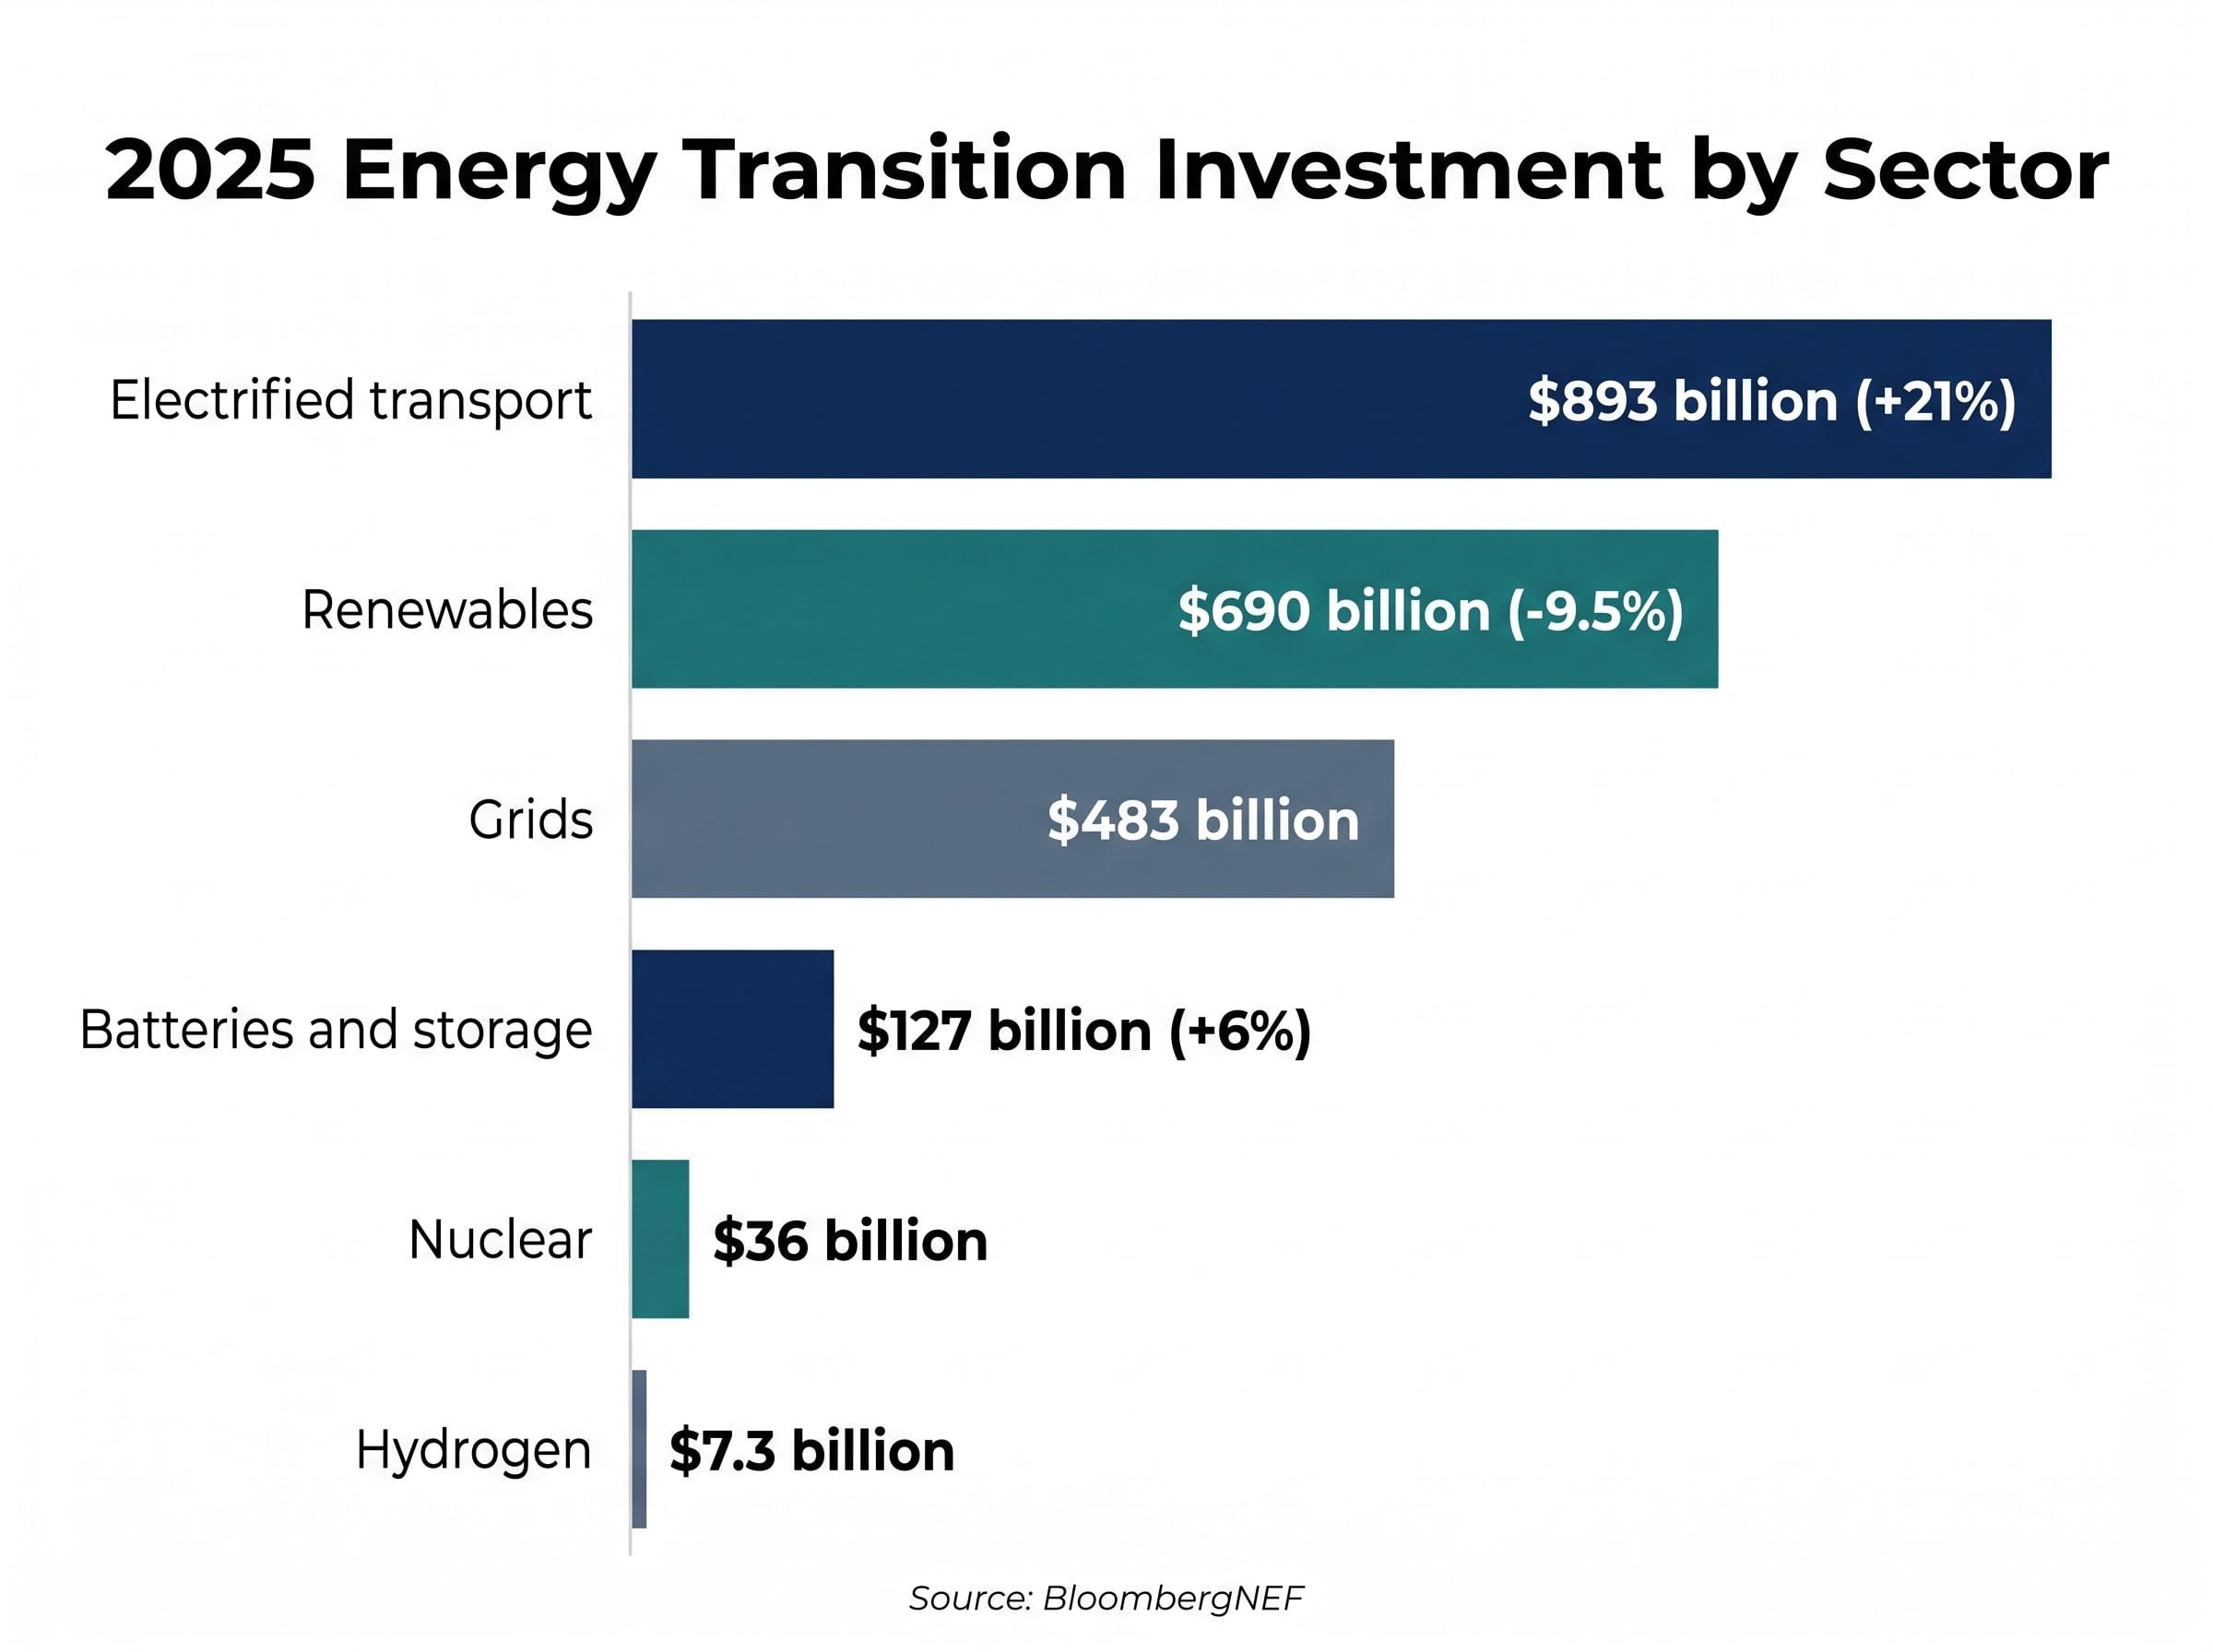
BloombergNEF’s 2025 sector-level breakdown reveals where the capital is concentrating:
The different tracking methodologies produce different totals. The table below reconciles the three primary datasets for readers assessing the investment landscape.
| Source | Year | Investment Figure | Scope |
|---|---|---|---|
| IEA | 2024 | ~$2 trillion (clean energy portion of $3T+ total) | Total global energy investment |
| BloombergNEF | 2025 | $2.3 trillion (+8%) | Broad energy transition definition |
| Clean Investment Monitor | 2025 | $1.96 trillion (+7%) | Technology-only definition |
The differences reflect scope rather than contradiction. What all three datasets share is a direction: capital is moving toward clean energy at an accelerating rate, and the question for investors is whether that direction is durable or policy-contingent.
Cost reductions in renewables and storage have reached the point where clean energy competes on economics alone, without subsidy support. That shift from policy-dependent to market-competitive is the single strongest argument for structural durability.
The most compelling evidence arrived from an unlikely source. The United States, under active Trump administration policy headwinds, still recorded $378 billion in energy transition investment in 2025, up 3.5% year-on-year according to BloombergNEF. If political opposition could not reverse capital flows in the world’s largest economy, the structural argument gains considerable weight. The European Union reinforced the pattern from the opposite direction, with investment reaching $455 billion, up 18%, even amid broader economic pressure.
| Region | 2025 Investment | Year-on-Year Change |
|---|---|---|
| United States | $378 billion | +3.5% |
| European Union | $455 billion | +18% |
| China | $800 billion | Mixed (renewables -9.5%) |
China’s $800 billion total masked a 9.5% decline in its renewables sub-sector, the first since 2013, driven by regulatory changes. Hydrogen ($7.3 billion) and nuclear ($36 billion) remain well below the scale required by most energy transition pathways. Emerging markets accounted for only approximately 15% of 2024 global clean spending, concentrating the investment story in developed economies and China. Even within a structural trend, policy remains a meaningful variable.
Climate technology now extends well beyond solar panels and wind turbines. The investable universe includes renewables, battery storage, electric vehicles and electrified transport, smart grid infrastructure, critical minerals processing, low-carbon industrial processes, and resilience-oriented solutions such as water management.
The sector has shifted from a venture-capital-driven innovation phase into a mature execution phase. Betashares has characterised this transition in framing that carries weight for portfolio construction:
AI data centre power demand is emerging as a structural demand driver for grid and storage investment that sits alongside, rather than in competition with, the clean energy transition, with Wall Street projecting $530 billion to $700 billion in global data centre IT spending in 2026 alone and a near-doubling of electricity consumption from that sector by 2030.
Climate technology has moved from “innovation to infrastructure,” now characterised by established companies with strong balance sheets and internationally diversified revenue.
This maturation changes the risk and return profile of exposure compared with earlier in the decade, when clean energy allocation meant accepting venture-stage volatility. The Intergovernmental Panel on Climate Change (IPCC) has confirmed increasing frequency and severity of extreme weather events, a finding that strengthens both the policy and economic case for climate technology by raising the cost of inaction for governments and corporations alike. For Australian investors, this means clean energy allocation now includes infrastructure-quality assets alongside growth-stage technology, broadening the range of portfolio roles the sector can fill.
Australia’s 2024 result gave domestic investors genuine reason for confidence. According to the Clean Energy Council, new clean energy investment totalled $12.7 billion, the highest on record, with $9 billion directed toward large-scale generation projects. The pipeline was deep, capital was flowing, and Australia appeared to be converging with the global trajectory.
Then 2025 arrived.
Australian clean energy investment slumped approximately 20% in 2025, according to the Clean Energy Council and reporting by The Guardian. The cause was not weakening demand or deteriorating economics. Grid connection delays and infrastructure bottlenecks constrained the pipeline, preventing committed capital from translating into commissioned projects. The Clean Energy Council has warned that Australia risks missing its clean energy targets if the grid connection pipeline is not cleared.
Grid connection approvals for large-scale battery storage projects such as 1414 Degrees’ 140 MW Aurora BESS illustrate both the length of the regulatory pathway and the scale of capital that can be unlocked once projects clear AEMO and network operator requirements, providing a concrete case study in the pipeline dynamics the Clean Energy Council has flagged.
KPMG’s Energy Transition Investment Outlook 2025 characterises Australian clean energy investment as “long-term resilient but near-term lumpy.”
That characterisation captures the analytical challenge for local investors. The structural economics remain intact, and Australia’s critical minerals export potential adds a supply-chain dimension that few other developed economies can match. The near-term reality, however, includes a political overlay: the Clean Energy Council has flagged a potential Coalition government’s energy policy stance as a risk to investor confidence, separate from the infrastructure constraint itself.
The gap between Australia’s 2024 record and its 2025 slump illustrates something the global headline obscures. Domestic allocation requires a different risk assessment than global clean energy exposure.
Three primary access points exist for Australian investors seeking clean energy exposure:
The performance divergence between these vehicles in 2025 tells the story of domestic versus global exposure in concrete terms.
Home bias in Australian portfolios has been measurably eroding across all generational cohorts, a structural shift that is particularly visible in ETF purchasing data and that provides the broader context for why the performance gap between global and domestic clean energy vehicles matters to a growing share of retail investors.
| Vehicle Type | 2025 Return / Inflow | Geographic Focus | Key Risk |
|---|---|---|---|
| ASX global clean energy ETFs | ~12-15% average return | Global | Currency volatility (AUD/USD) |
| Australian-focused clean energy ETFs | Underperformed global counterparts | Domestic | Grid delays, policy uncertainty |
| Clean energy infrastructure funds | ~$2 billion inflows; ~8% YTD (April 2026) | Primarily domestic | Illiquidity, project execution |
According to StockSpot, ASX-listed global-focused clean energy ETFs delivered approximately 12-15% average returns in 2025, supported by global EV and grid infrastructure growth. Australian-focused clean energy ETFs underperformed, reflecting the domestic policy delays and grid connection constraints detailed in the previous section. Betashares’ ERTH ETF has been noted for providing diversified global exposure across both mitigation and adaptation themes.
Superannuation is also scaling into the space. SuperRatings reported a median balanced fund return of 8.8% in 2025, and ethical and ESG-focused super funds now report approximately 10-15% of assets allocated to clean energy. The performance split between global and domestic vehicles gives investors a data-supported reason to consider global clean energy exposure as a complement to, or partial substitute for, domestic-only allocation.
The structural case does not eliminate risk. It changes where risk sits. Three exposures require quantification rather than acknowledgement.
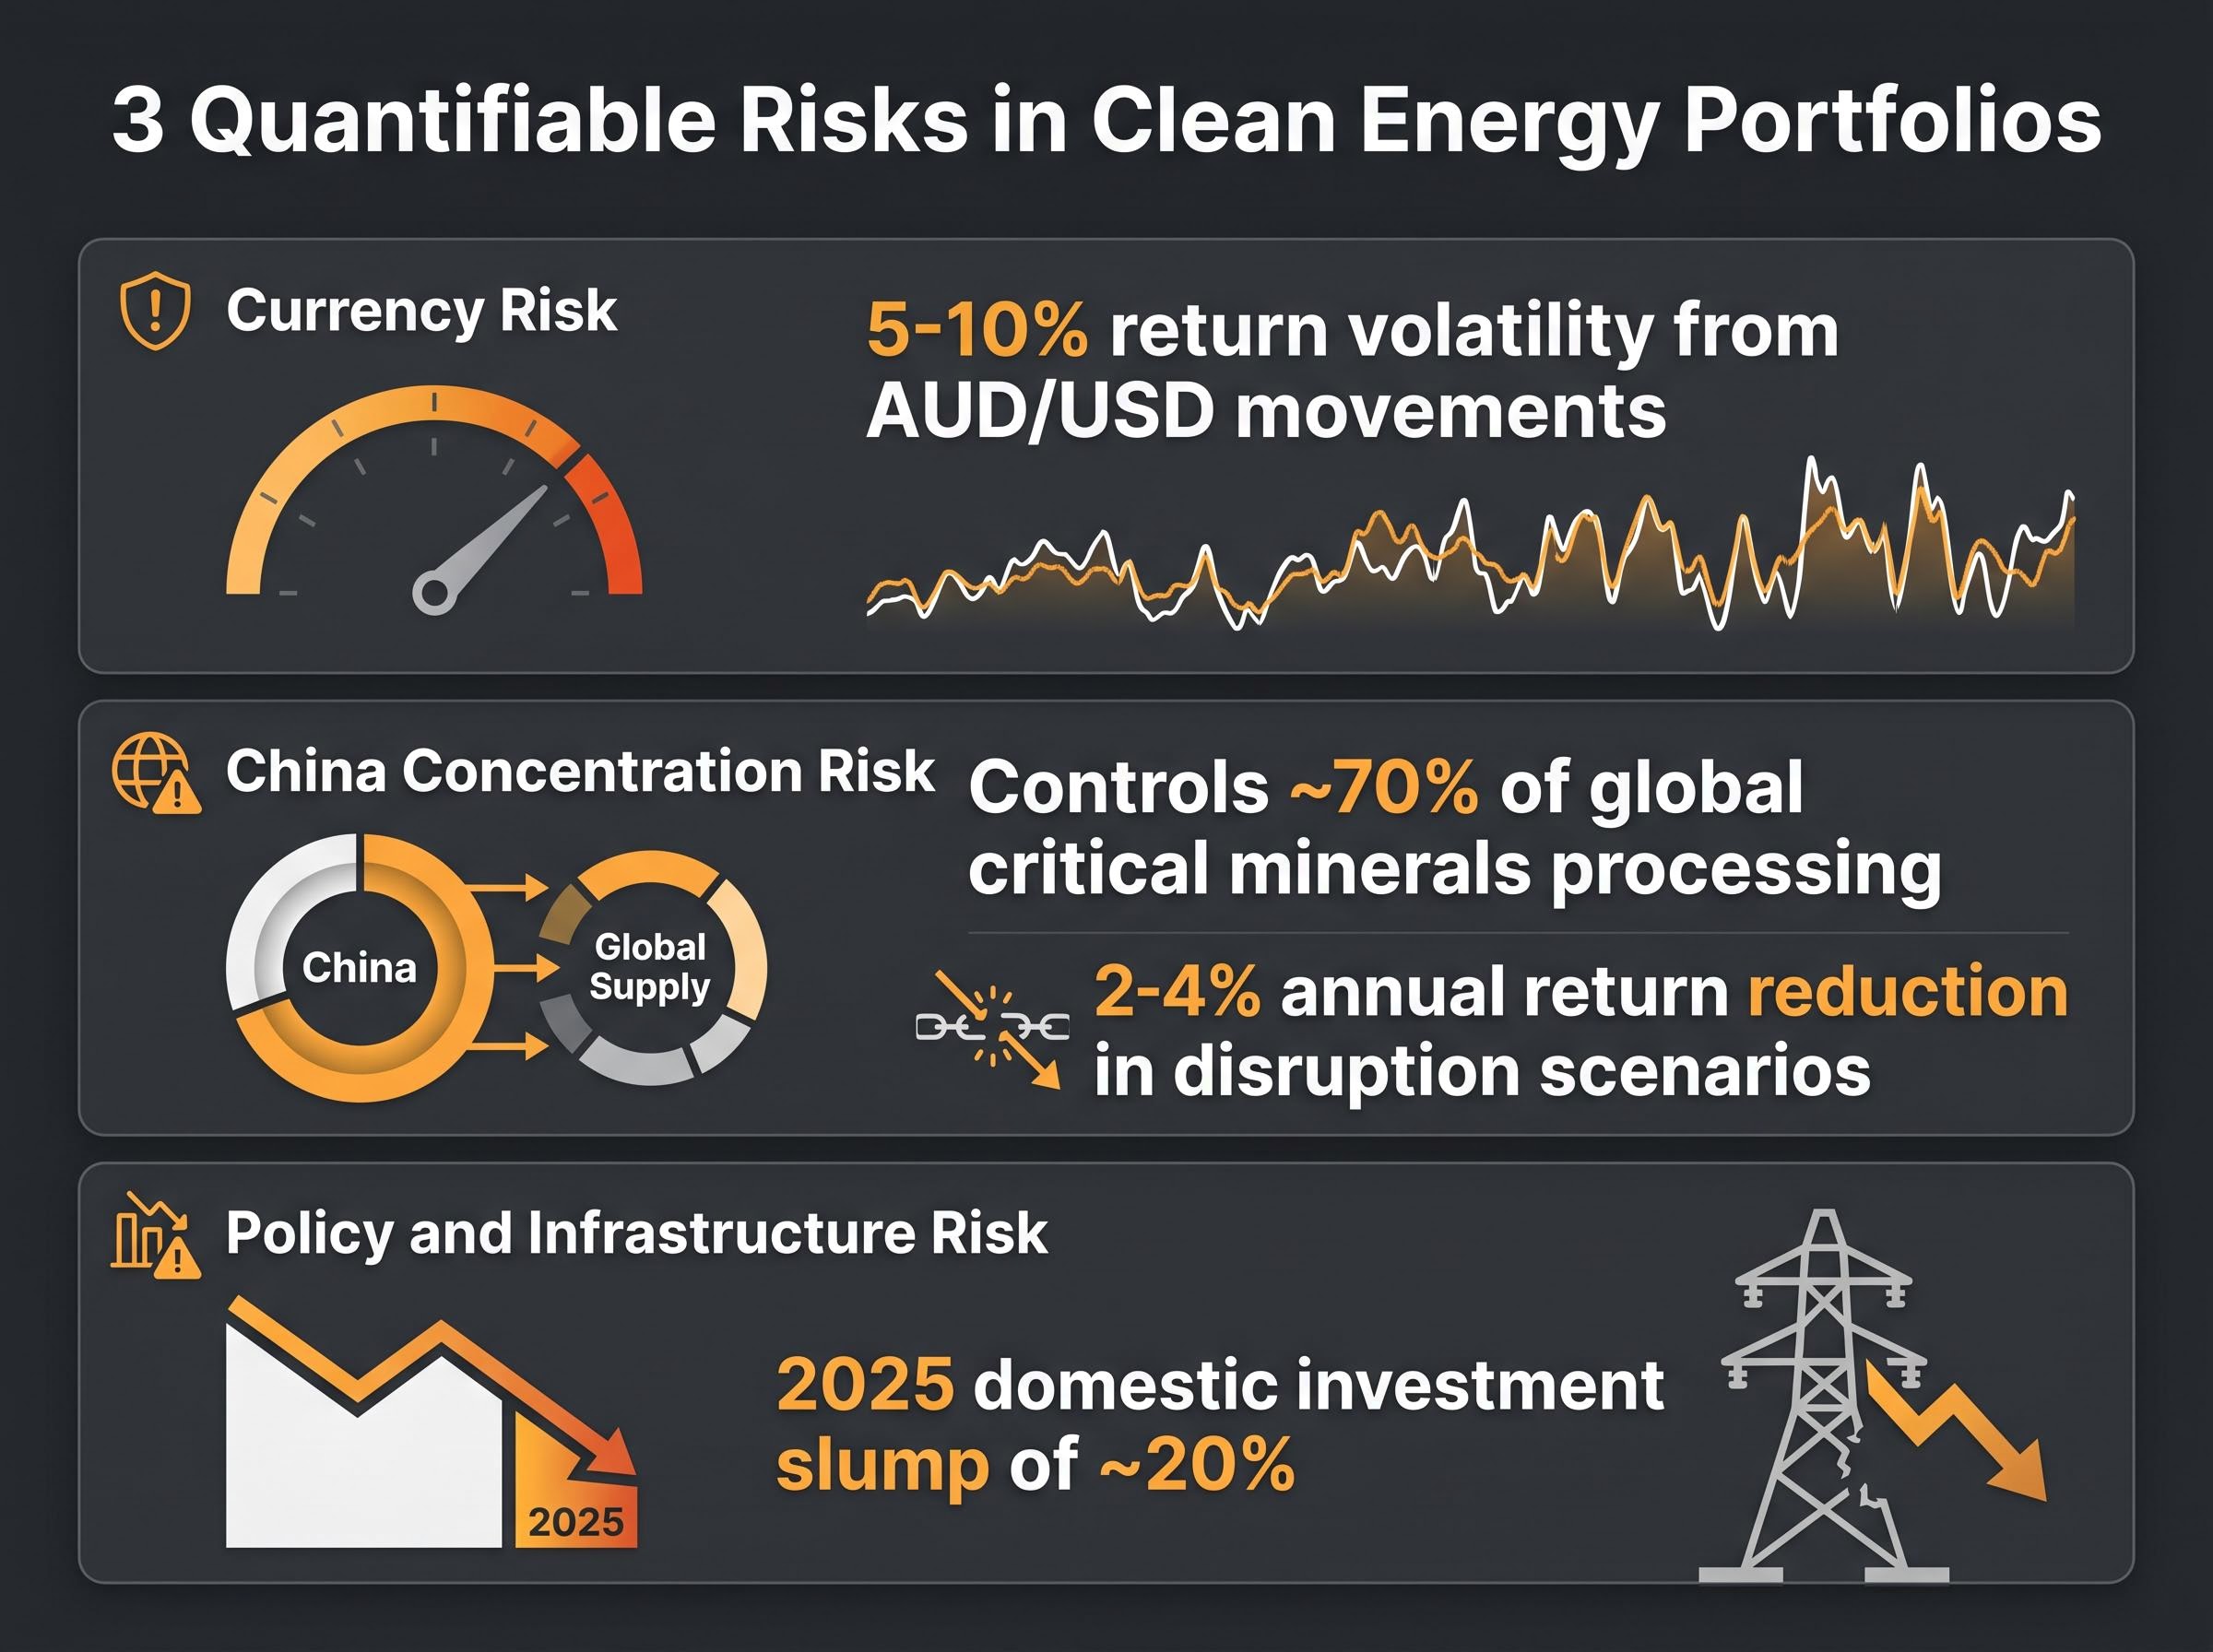
Currency exposure is not an exceptional event for Australian investors holding global ETFs; it is a structural cost of accessing the best-performing clean energy vehicles. The 5-10% return volatility from exchange rate movements alone means that a 12% return in USD terms could deliver anywhere from 2% to 17% in AUD terms in a given year.
According to the Reserve Bank of Australia Bulletin (October 2025), China controls approximately 70% of global critical minerals processing capacity, a concentration that creates supply chain disruption exposure for investors across the clean energy value chain.
The RBA Bulletin on critical minerals confirms that China’s dominance in refining capacity is not limited to a single commodity but extends across the breadth of minerals underpinning clean energy supply chains, a finding that carries direct implications for Australian investors holding global clean energy portfolios through any part of the value chain.
The estimated 2-4% annual return impact in disruption scenarios, drawn from RBA analysis, gives that concentration a specific cost. Investors holding global clean energy portfolios carry this exposure whether or not they have direct China-listed holdings, because supply chain dependence runs through the components and materials layer.
Battery supply chain onshoring is accelerating in the United States through policy instruments such as the Section 48C Advanced Energy Project tax credit, which ASX-listed companies like NOVONIX are now accessing to fund domestic synthetic graphite production capacity and reduce the supply chain concentration the current article quantifies as a 2-4% annual return risk.
Policy risk in Australia operates on two separate tracks. Federal clean energy target uncertainty, linked to a potential Coalition government policy shift, affects investor confidence and project pipeline visibility. Grid connection bottlenecks affect project execution timelines and commissioning rates. Both suppress returns, but they require different hedging responses: the first is a diversification argument for global exposure, the second is a timing argument for when domestic exposure re-rates.
The global structural case for clean energy investment is supported by convergent data from the IEA, BloombergNEF, and the Clean Investment Monitor. It has demonstrated resilience against political headwinds in the United States and growth pressure in Europe. The direction of capital is no longer in question.
Australia’s domestic picture requires a more nuanced approach. The structural economics are intact, underpinned by cost competitiveness and critical minerals export potential. Execution risk, from grid bottlenecks and policy uncertainty, makes vehicle selection and geographic diversification more consequential than in pure global allocations. The 2025 performance split between global and domestic ETFs is evidence of that distinction, not merely an anecdote.
As Australian grid infrastructure clears and superannuation continues scaling into clean energy, domestic exposure may re-rate. Investors positioning for the structural trend rather than the near-term domestic recovery narrative are likely better served by blending global and domestic clean energy vehicles while quantifying the currency, concentration, and policy risks that each carries.
This article is for informational purposes only and should not be considered financial advice. Investors should conduct their own research and consult with financial professionals before making investment decisions. Past performance does not guarantee future results. Financial projections are subject to market conditions and various risk factors.
Clean energy investment refers to capital allocated to renewables, storage, grid infrastructure, electric vehicles, and related technologies. The $3 trillion milestone signals that clean energy has shifted from a policy-dependent theme to an economically self-sustaining structural trend, with clean energy now attracting roughly twice the capital flowing into fossil fuels globally.
Australia's clean energy investment slumped approximately 20% in 2025 after a record $12.7 billion in 2024, driven by grid connection delays and infrastructure bottlenecks rather than weakening economics. In contrast, global clean energy investment rose 8% to $2.3 trillion over the same period.
The three key risks are currency volatility (AUD/USD movements can create 5-10% return swings on global holdings), China concentration risk (China controls around 70% of global critical minerals processing, with an estimated 2-4% annual return impact in disruption scenarios), and domestic policy and grid infrastructure uncertainty that suppressed Australian-focused ETF returns in 2025.
ASX-listed global clean energy ETFs delivered approximately 12-15% average returns in 2025, outperforming Australian-focused clean energy ETFs, which underperformed due to domestic grid delays and policy uncertainty. Clean energy infrastructure funds attracted around $2 billion in inflows and returned approximately 8% year-to-date as of April 2026.
Economics now drive clean energy investment more than policy, as cost reductions in renewables and storage have made clean energy competitive without subsidies. The clearest evidence is that the United States recorded $378 billion in clean energy investment in 2025, up 3.5%, despite active policy headwinds from the Trump administration.