If your June ETF distribution looked lighter than expected, you are not imagining things. Across three of Australia’s most widely held equity income funds, quarterly payouts dropped by between 25% and 80% compared to the same period last year, and the cuts hit broad-market and high-yield strategies alike.
That is not a single fund having a bad quarter. It is the visible surface of a yield compression story that has been building across the ASX since mid-2023, driven by a convergence of stagnating dividends, resilient share prices, and index concentration dynamics that most passive investors have never had to think about.
Here is what the data actually tells you about which part of your smaller distribution is mechanical noise, which part reflects a genuine shift in what the Australian market is paying income investors, and what that distinction means for planning decisions from here.
The distribution cuts that got income investors’ attention
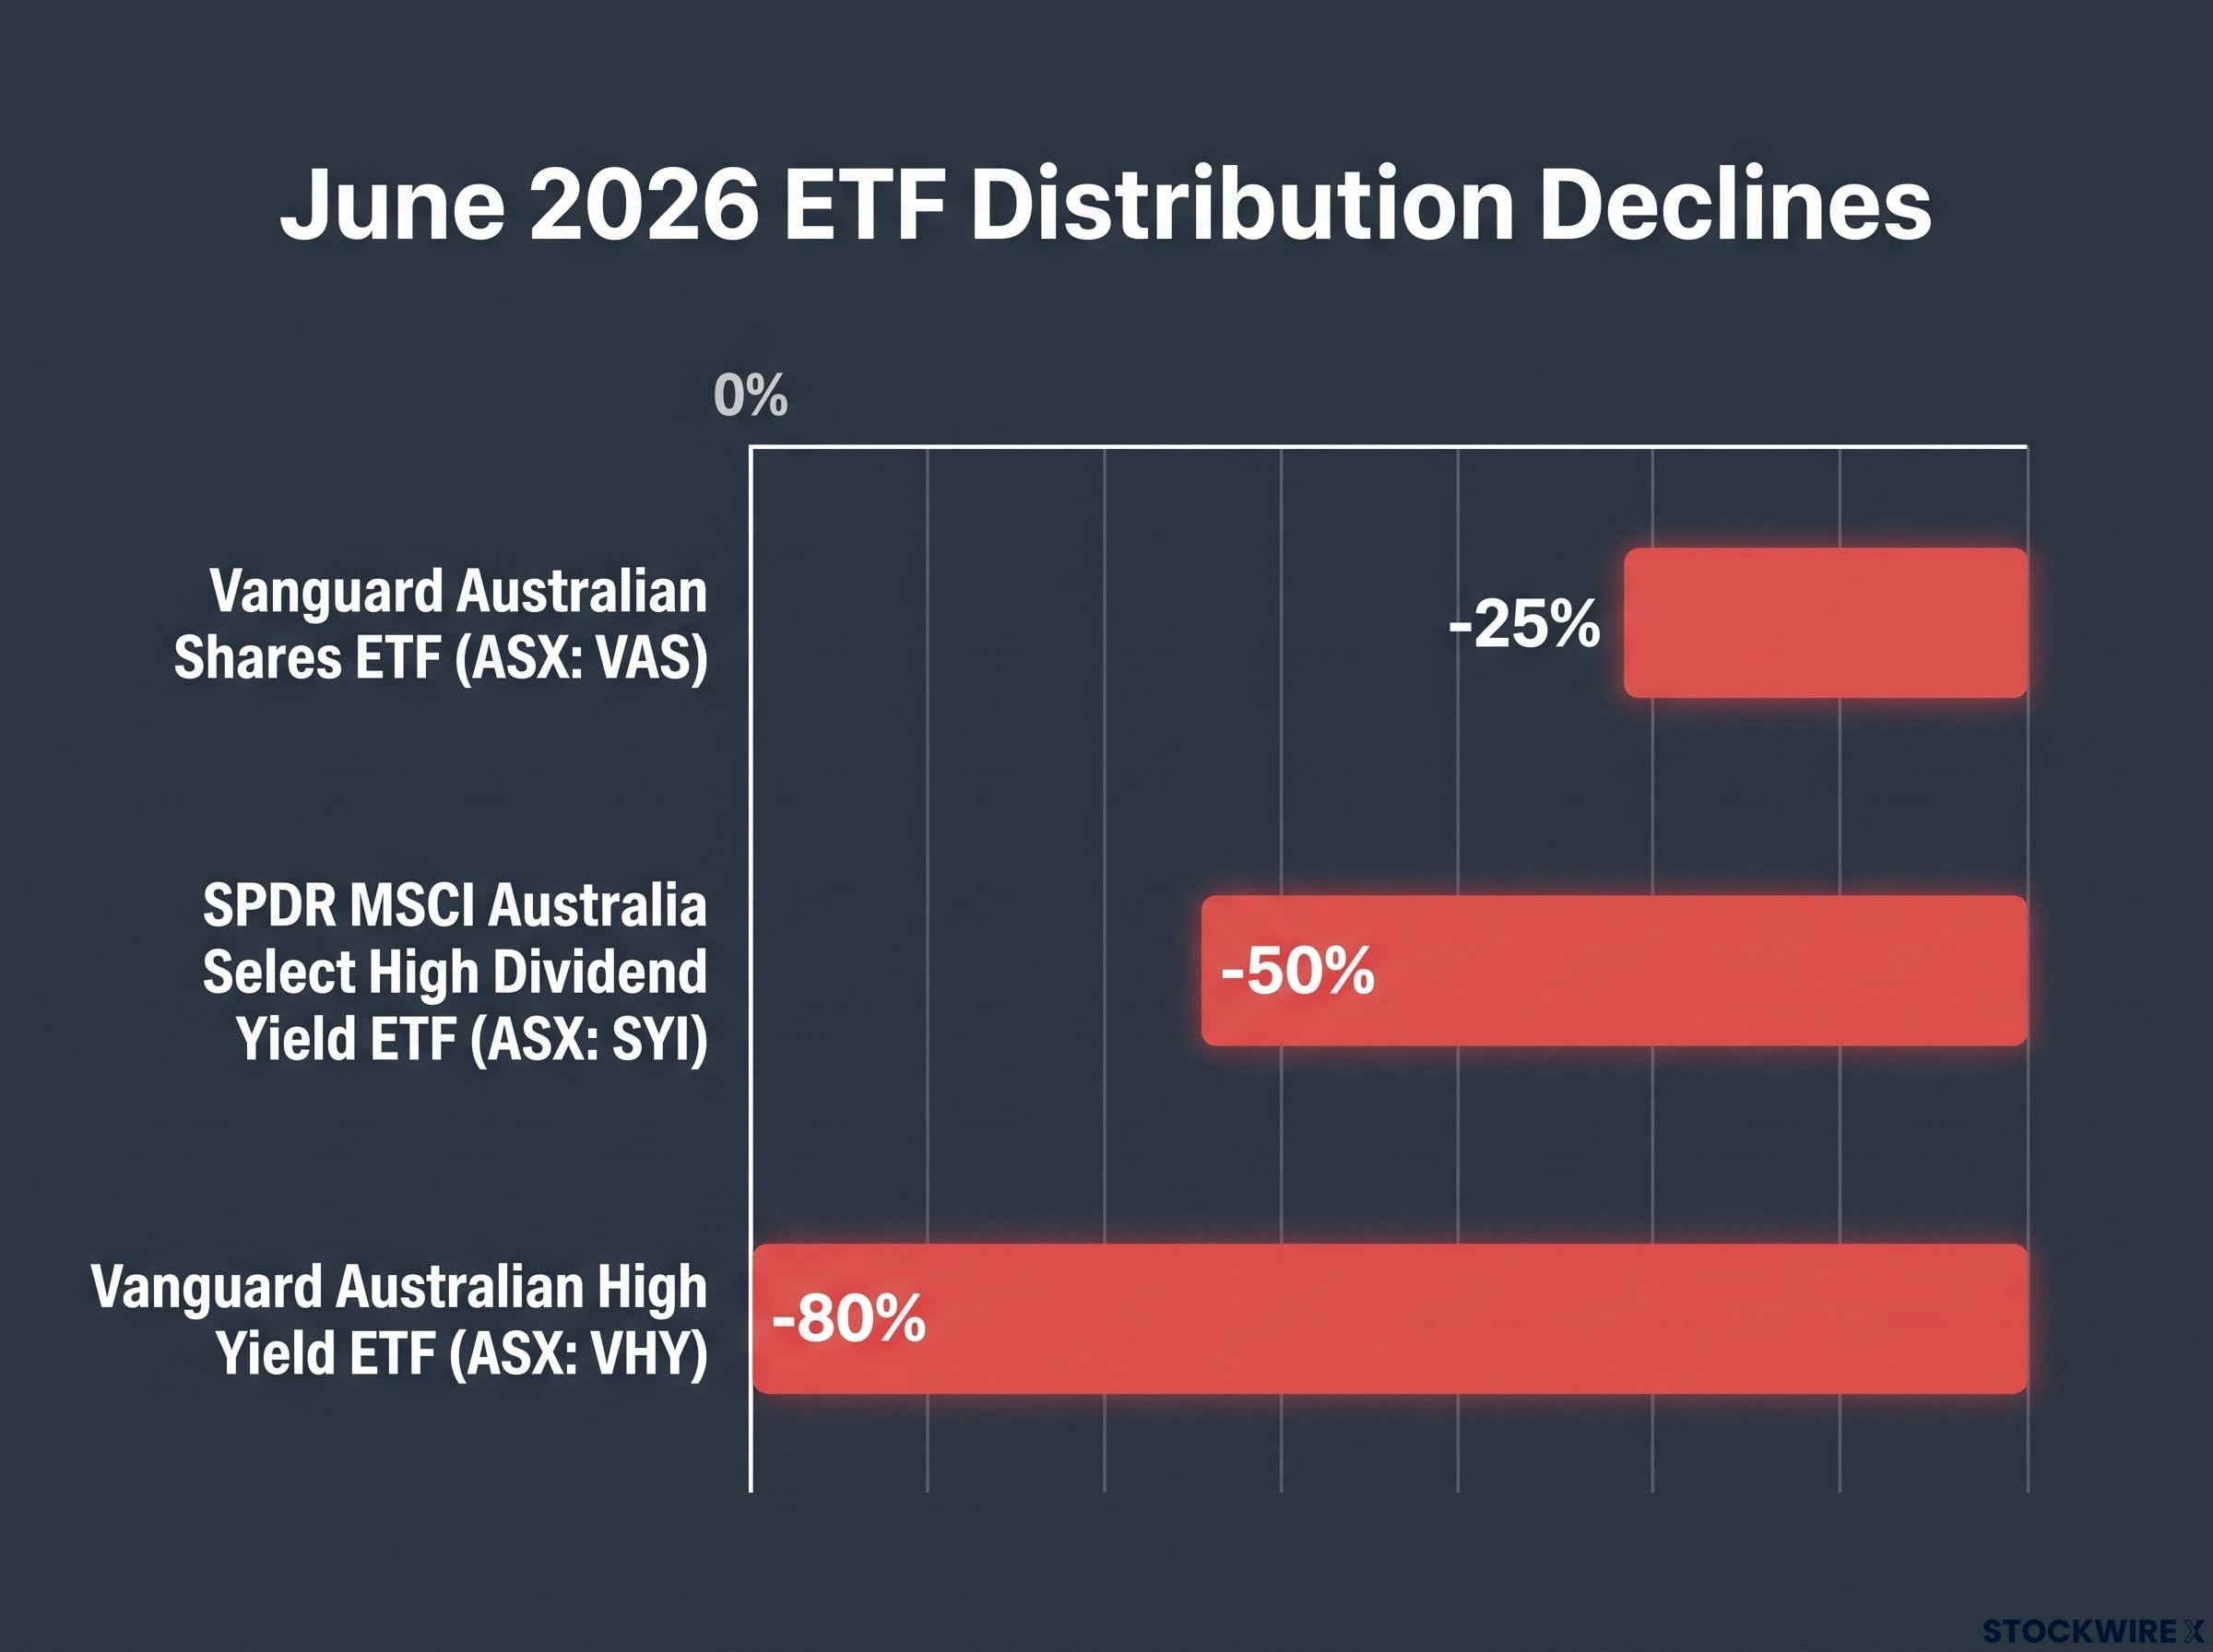
The June 2026 numbers landed in quick succession, and they were hard to ignore:
- Vanguard Australian Shares ETF (ASX: VAS): June payout came in roughly 25% below the equivalent period a year prior
- Vanguard Australian High Yield ETF (ASX: VHY): June payout fell by approximately 80% year-on-year
- SPDR MSCI Australia Select High Dividend Yield ETF (ASX: SYI): June payout was around 50% lower than the same period last year
The data comes from fund distribution announcements referenced by Mark LaMonica, CFA, at Morningstar Australia, published 17 July 2026.
The VHY and SYI figures are dramatic, but it is the VAS number that carries the most analytical weight.
VAS tracks the ASX 300 using simple market-cap weighting. It does not chase high-yield screens or rotate aggressively between holdings. A 25% decline in a plain vanilla index fund is not a strategy artefact. It tells you that aggregate company dividends across the Australian market are genuinely weaker.
That distinction matters. VHY and SYI are designed to concentrate in the highest-yielding names, and their rebalancing mechanics can amplify quarterly swings. VAS is closer to a thermometer for the whole market’s income. When it reads lower, the fever is real.
When big ASX news breaks, our subscribers know first
What Australian dividend yields actually look like right now
Pinning down exactly where yields sit requires some care, because the answer changes depending on which index, which time frame, and whether you include franking credits.
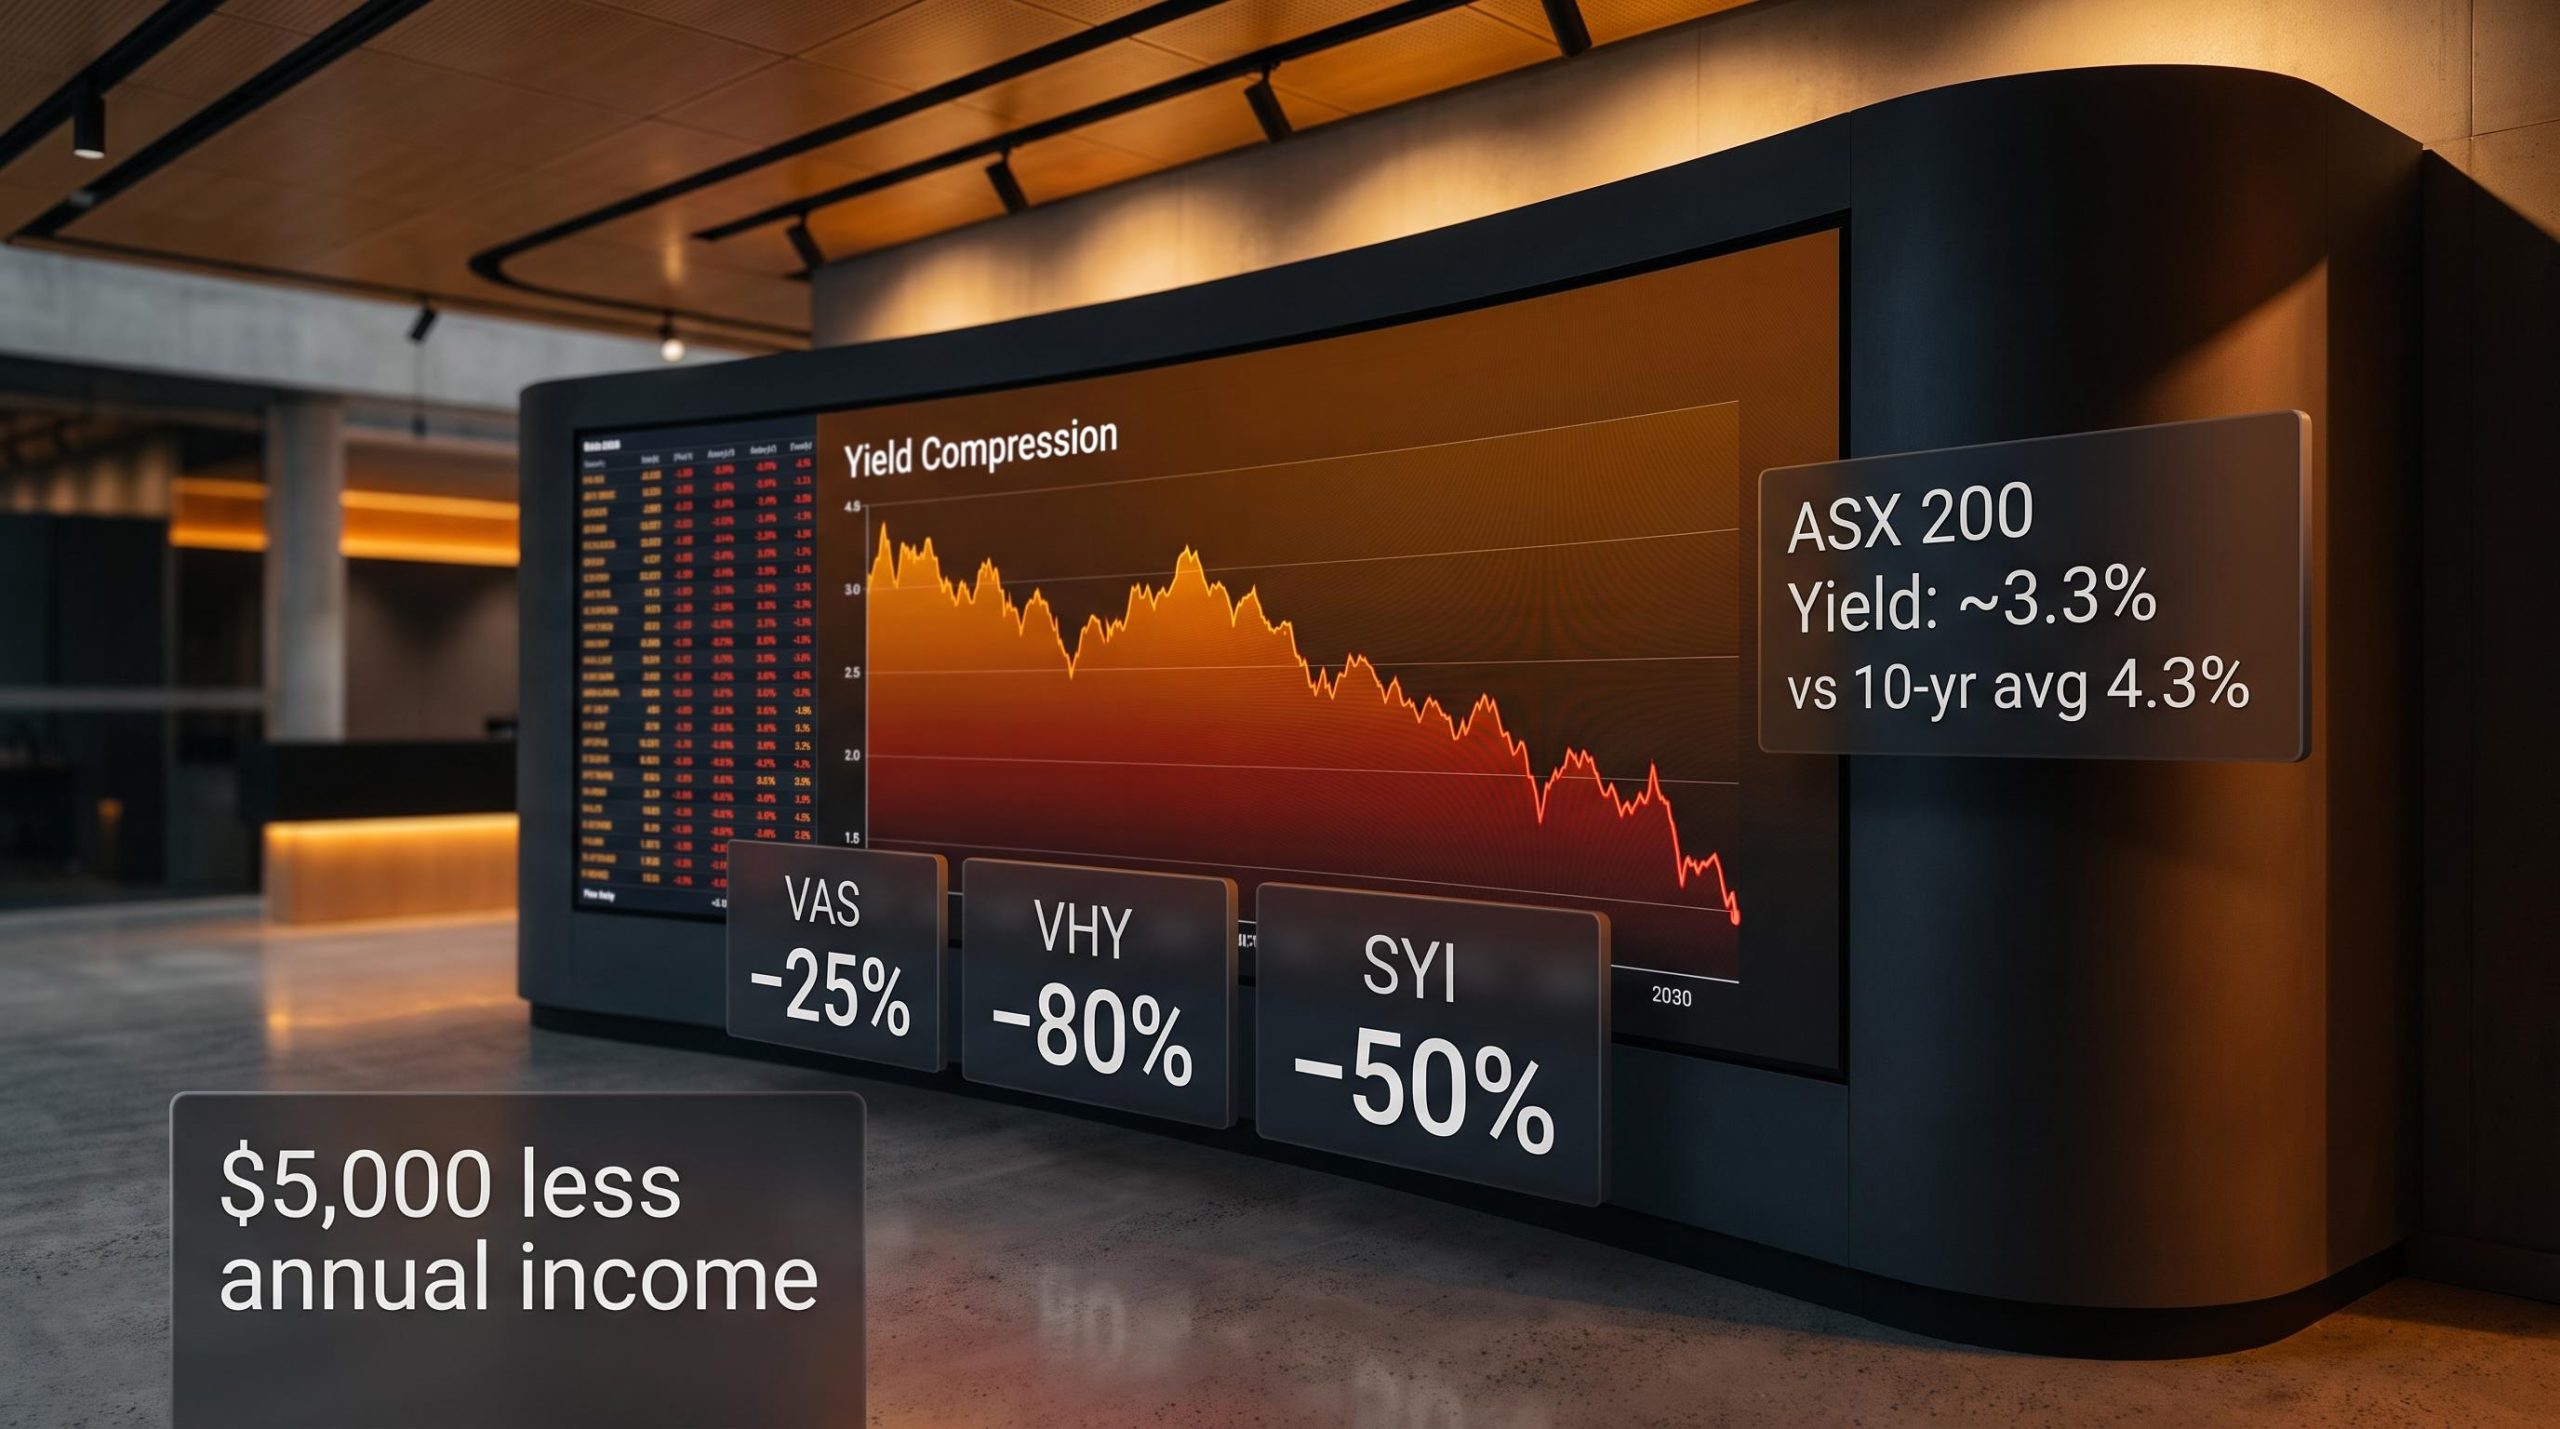
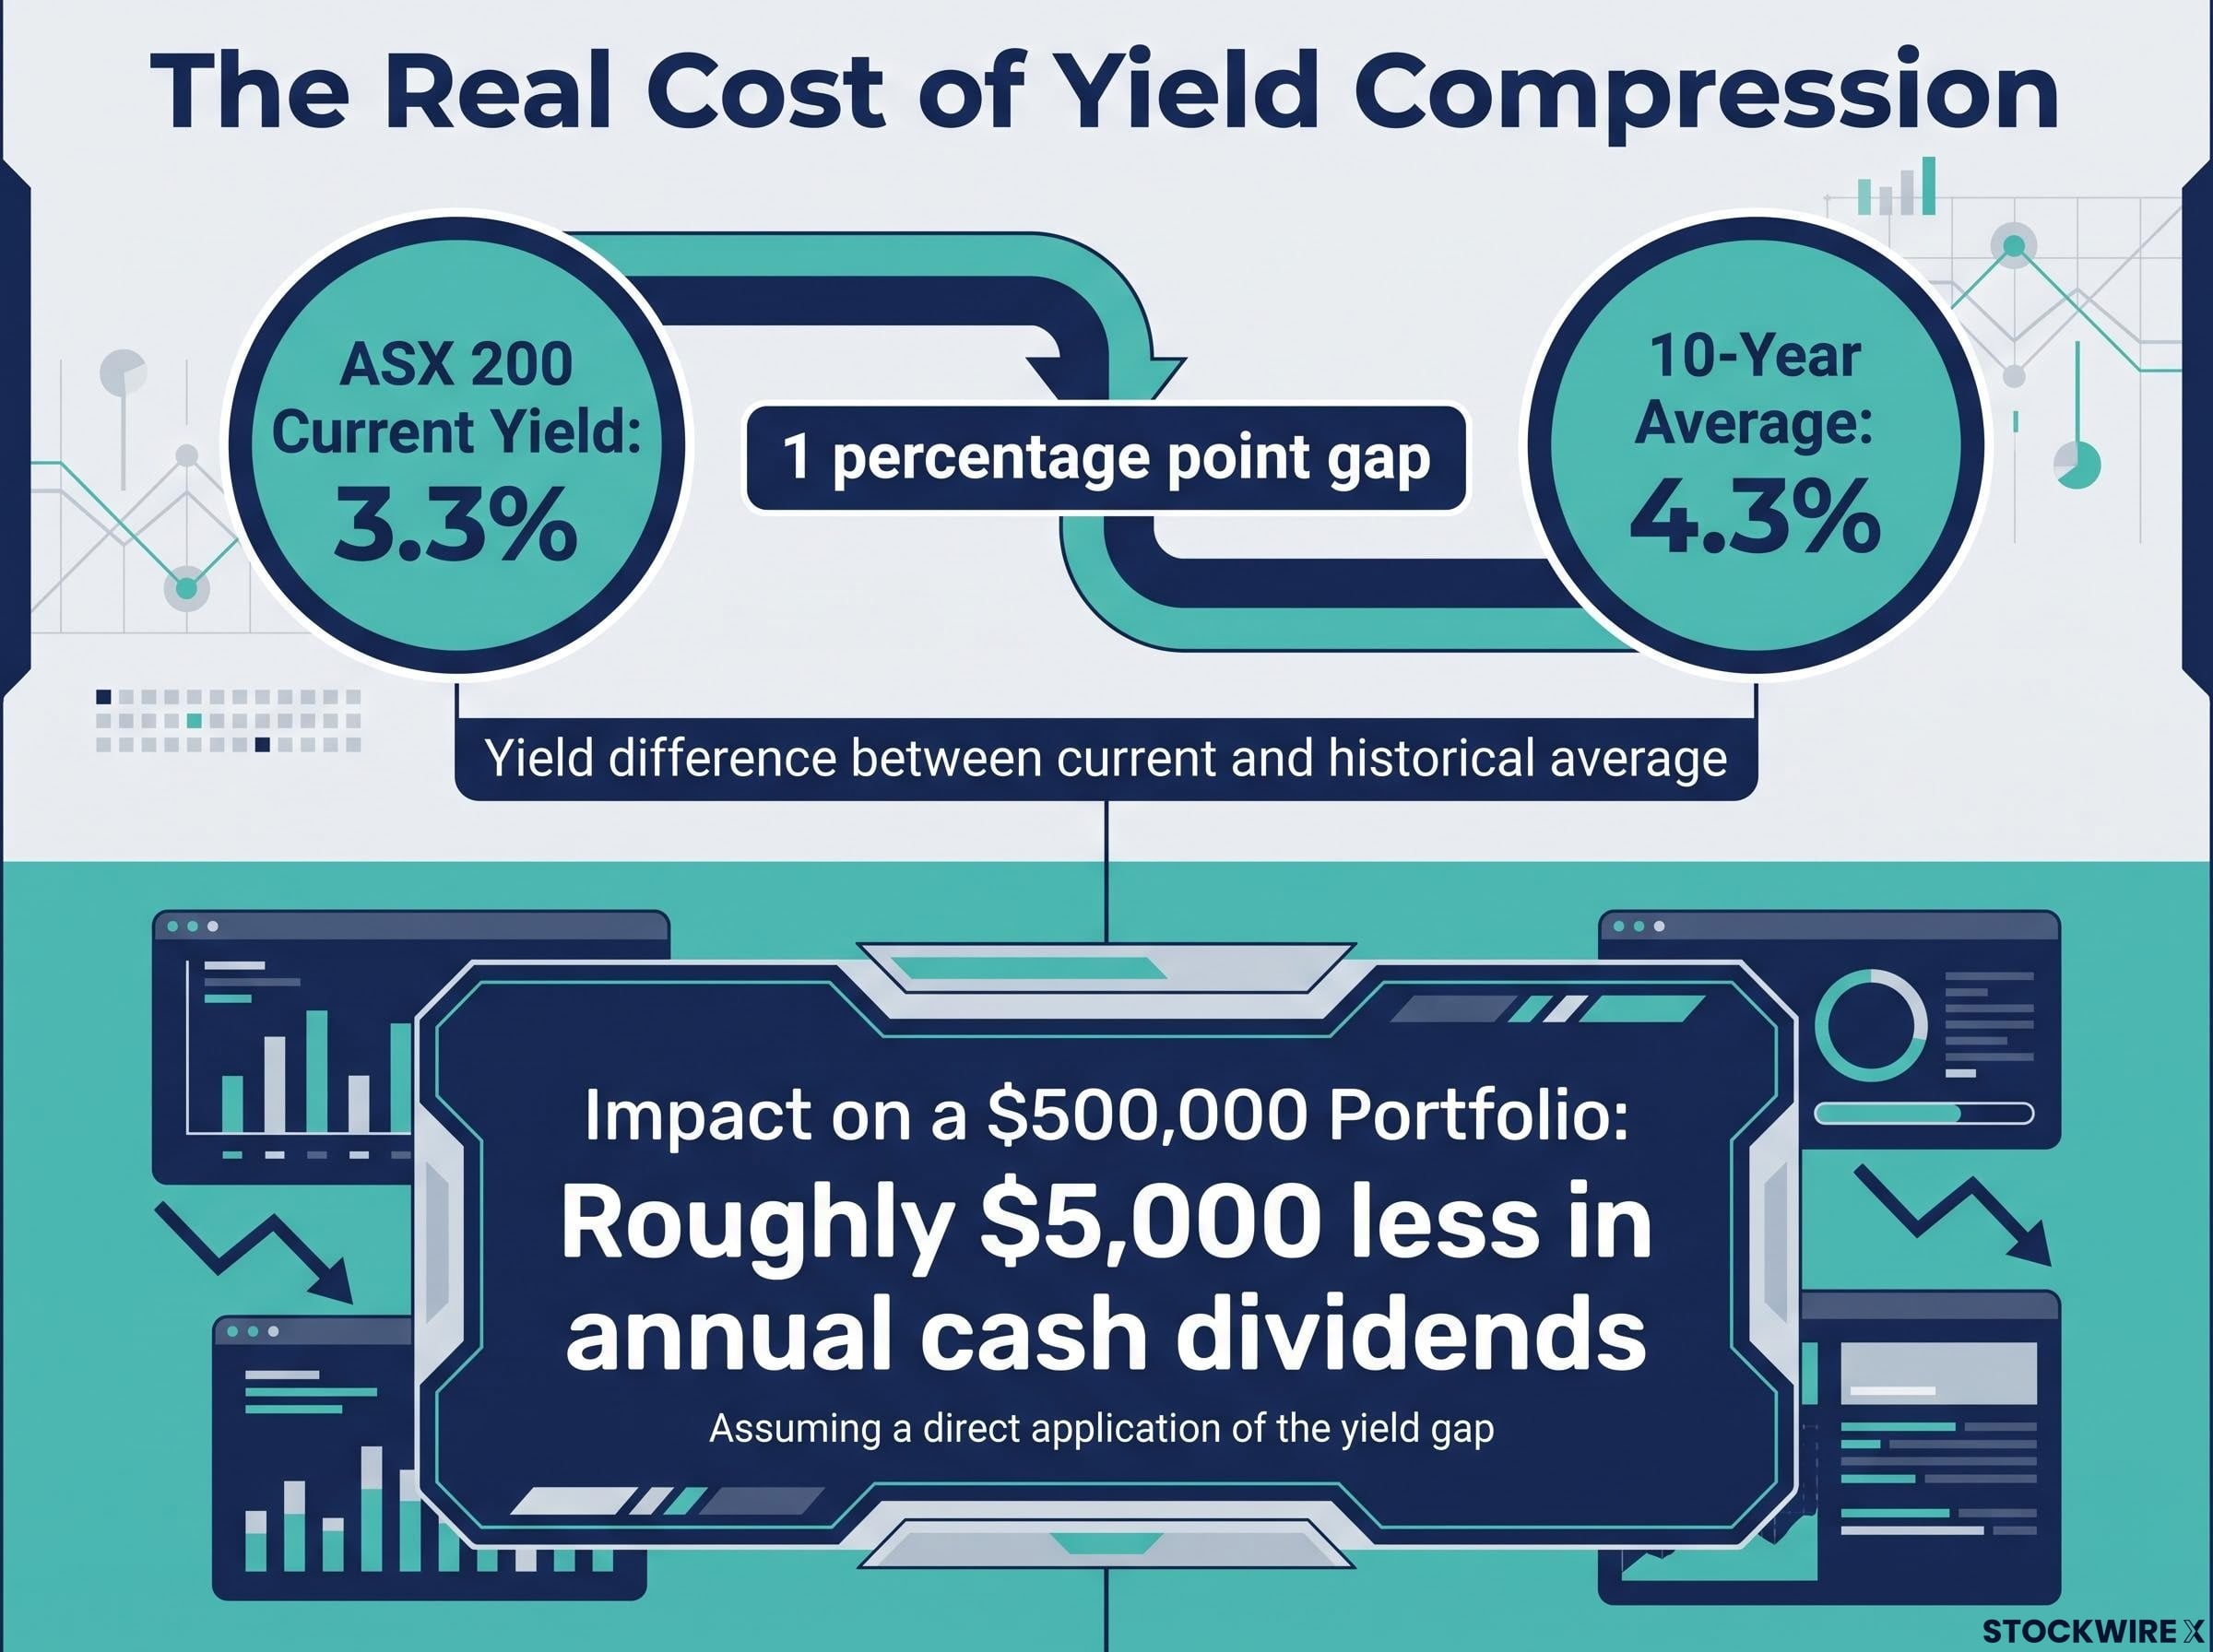
According to Morningstar, the S&P/ASX 200 dividend yield currently sits at approximately 3.3%, calculated on a market-cap-weighted basis. That is roughly 1 percentage point below the 10-year average of approximately 4.3%. It is the cleanest single measure of how far current yields have compressed from their recent norms.
Australian Taxation Office data adds further colour: by early 2026, the All Ordinaries cash dividend yield had slipped under 3%, while the franking rebate yield component had also receded to below 1%. To put that in perspective, the All Ordinaries was delivering a grossed-up yield of approximately 5.79% just two years ago, meaning the current level represents a contraction of around one-third.
Grossed-up yield calculations materially alter the income comparison between franked Australian equities and bond alternatives, because a cash yield of 3.3% on fully franked shares translates to a pre-tax equivalent closer to 4.7% for investors at the 30% marginal rate, a differential that tightens but does not disappear even after the recent compression.
| Measure | Current level | Prior level or benchmark | Source |
|---|---|---|---|
| All Ordinaries cash dividend yield | Below 3% | Part of ~5.79% grossed-up (c. 2024) | ATO |
| All Ordinaries franking rebate yield | Below 1% | Part of ~5.79% grossed-up (c. 2024) | ATO |
| ASX 200 yield (market-cap weighted) | ~3.3% | 10-year average ~4.3% | Morningstar |
| All Ordinaries grossed-up yield | High-3% to low-4% range | ~5.79% (c. 2024) | Morningstar / ATO |
That 1-percentage-point gap between the current ASX 200 yield and its 10-year average is not abstract. For a retiree drawing income from a $500,000 portfolio, it translates to roughly $5,000 less in annual cash dividends than the historical norm would have suggested.
When bonds start paying more than shares
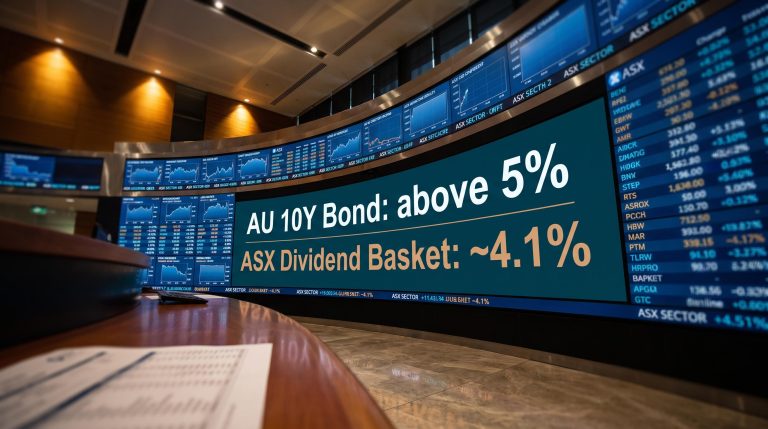
Since mid-2023, fixed-income yields have exceeded equity dividend yields, according to Morningstar. That reverses a long-standing Australian pattern where franked dividends were typically more attractive than bond income on an after-tax basis.
For income investors who built their strategies around that assumption, the reversal is worth acknowledging. Bonds are now a genuine competitor for the income dollar in a way they have not been for years.
Why the yield has fallen: the mechanics behind the compression
The yield on a share or an index is a ratio: dividends divided by price. That means two forces can push it down, and both have been operating simultaneously on the ASX.
- Dividends declined in key sectors. The resources sector is the clearest example. Mining payouts surged during the post-pandemic commodity boom, then normalised as prices and margins retreated. Current comparisons look particularly severe because they are measured against that elevated base. Since conditions across the broader market settled after the pandemic-era disruption in 2022, meaningful dividend growth among the largest ASX companies has been largely absent.
- Prices rose without matching dividend growth. Expectations for rate cuts in 2025 drove strong equity inflows, pushing share prices higher. Over FY2025, the All Ordinaries recorded a price return of 7.55% before dividends, and while the index had edged slightly into negative territory in 2026 year-to-date as at mid-July, that earlier price appreciation had not materially reversed. Morningstar explicitly links greater inflows into dividend-paying shares with downward pressure on yields.
- ETF distribution timing amplified the visible effect. Distributions reflect what a fund actually received in the period. If a large portion of underlying company dividends falls into a different quarter or tax period, the comparable payout can look artificially weak, even if full-year income is less volatile. High-yield strategies like VHY and SYI also rebalance frequently, which can shift realised income between periods and magnify quarter-to-quarter swings.
Understanding that rising prices compress yields means you should not automatically interpret a falling ETF payout as a sign of corporate distress. Sometimes the market has simply priced the income stream higher than its current cash value warrants.
How index concentration shapes income outcomes for passive investors
The Australian market’s income problem has a structural dimension that sits inside every broad-market ETF, whether you have noticed it or not.
Around half of the All Ordinaries index weighting is held within the ten largest ASX companies. That is a remarkable concentration for a supposedly diversified benchmark.
ASX 200 concentration risk is reinforced by the mechanics of market-cap weighting itself: VanEck research cited in broader analyses of index construction shows two stocks alone have historically represented approximately 22% of a typical cap-weighted Australian equity portfolio, meaning a single large-cap payout decision creates a portfolio-wide income event.
BHP and Commonwealth Bank of Australia together carry a combined weight of approximately 19% in the All Ordinaries, giving their payout decisions a disproportionate influence over the income outcomes of every broad-market ETF that tracks or closely mirrors the index.
When those few names stagnate or cut payouts, the income effect radiates across every passive portfolio that holds them at market-cap weight. The word “diversified” in a fund’s marketing materials does not protect against income concentration risk when the index itself is this top-heavy.
Three structural mechanisms reinforce the problem:
- Passive investment flows direct capital according to market-cap weights rather than dividend fundamentals, meaning the largest companies attract inflows irrespective of whether their payout trajectories justify it.
- Large superannuation fund scale limits where capital can realistically be deployed. Australia’s major superannuation funds operate at a size that effectively channels their investments toward the biggest names on the exchange.
- Post-pandemic dividend normalisation in the resources sector has removed the extraordinary payouts that temporarily masked how dependent index-level income is on a handful of companies.
If half the index is concentrated in ten companies whose dividends have stagnated or retreated, your exposure to those few names’ payout decisions is far greater than the diversification label might suggest.
Is this a bad cycle or a new normal? The structural versus cyclical debate
This is the question income investors most need answered, and the honest answer is that it remains unresolved. Morningstar’s own analysis explicitly states that whether current low yields reflect structural shifts or temporary cyclical conditions is an open question.
Both explanations carry real weight.
The cyclical argument
Resource company dividends are inherently volatile, tied to commodity prices, capital expenditure cycles, and payout policy. Miners delivered unusually large payouts during the post-COVID commodity boom, and today’s comparisons appear particularly harsh because they are being taken against that exceptional high point rather than any ordinary historical baseline. Once those exceptional periods roll out of trailing averages, comparisons should moderate.
The structural argument
Several forces point to a more persistent shift. The ASX is heavily concentrated in mature, low-growth companies, many with already-high payout ratios and limited scope for sustainable dividend increases. Persistent passive and superannuation flows support large-cap prices even when earnings are flat, structurally depressing yields. Globally, companies have been trending toward buybacks and earnings retention over high payout ratios. Australia has been slower to follow that trend, partly because of the franking credit system introduced in 1987, but Morningstar notes the ASX dividend environment is clearly “shifting.”
Passive inflow dynamics compound the structural yield problem in a self-reinforcing way: each new dollar entering a cap-weighted fund mechanically bids up the prices of the largest existing holdings, further compressing the dividend yield on those positions without any change in the underlying cash dividends being paid.
Australia historically offered income investors superior dividend yields compared to most global markets. The current compression represents a meaningful departure from that historical norm.
For income investors, the unresolved nature of this debate is itself the signal that matters most. Planning on a swift reversion to 5-6% grossed-up yields across the index is not a conservative assumption. It is an optimistic one that carries real downside risk if structural forces prove dominant.
Building an income plan that fits the current yield environment
The diagnosis is clear enough. The question is what you do with it.
The starting point is recalibrating your baseline. The ASX 200 yield sits at approximately 3.3%. The 10-year average is approximately 4.3%. Planning around 5-6% grossed-up index yields is not supported by current data, and there is no evidence-based reason to assume a rapid reversion to those levels. Use the 3.3-4.3% range as your working assumption until the data shifts.
Morningstar’s dividend pick list identifies a group of shares with forecast average yields of approximately 5.7% over the next two years, with individual names above 6%, comfortably above the current index average.
That gap between 5.7% and 3.3% tells you something important: staying fully passive while lamenting lower distributions is a choice, not an inevitability. Selective yield opportunities exist, although they carry their own risks. Names like APA Group and several major miners are still projected to offer robust grossed-up yields when franking is included, though resource-linked income will remain volatile.
Four practical responses for income-focused investors in this environment:
- Recalibrate yield expectations using current market data, not historical norms that may not return quickly
- Prioritise sustainable yield indicators over headline rates: look for earnings coverage at or above approximately 1.5 times dividends, moderate payout ratios, and stable profits
- Consider selective high-yield opportunities within the ASX where individual stocks offer materially more income than the index average
- Evaluate fixed-income diversification now that bond yields compete directly with equity dividends for the first time in years
This article is for informational purposes only and should not be considered financial advice. Investors should conduct their own research and consult with financial professionals before making investment decisions. Past performance does not guarantee future results.
Recalibrating what Australian income investing looks like from here
The June 2026 distribution cuts are partly mechanical. ETF timing effects, rebalancing artefacts, and quarterly dividend clustering all amplified the visible decline. But the underlying market-level yield compression is genuine, and it reflects forces, from index concentration to post-boom dividend normalisation to persistent passive inflows, that do not reverse quickly.
The distinction between a VAS-level signal and a VHY-level swing matters for how you read your next distribution statement. A 25% decline in a plain vanilla index fund tells you aggregate income has weakened. An 80% decline in a high-yield strategy tells you the fund’s mechanics amplified the effect. Both are real, but they require different responses.
Whether the current yield regime proves cyclical or structural remains genuinely unresolved. That uncertainty is itself worth pricing into any income plan. The environment is testing whether a strategy built for the pre-2023 yield regime still fits your current situation. The answer depends on your specific income needs, your time horizon, and your willingness to move beyond the index, and that is a decision only you can make.
For income-focused retirees wanting to translate the current 3.3% index yield into a concrete capital requirement, our dedicated guide to living off dividends in Australia works through the specific portfolio sizes needed at today’s yields and shows how franking credits reduce the target for investors holding assets inside superannuation.