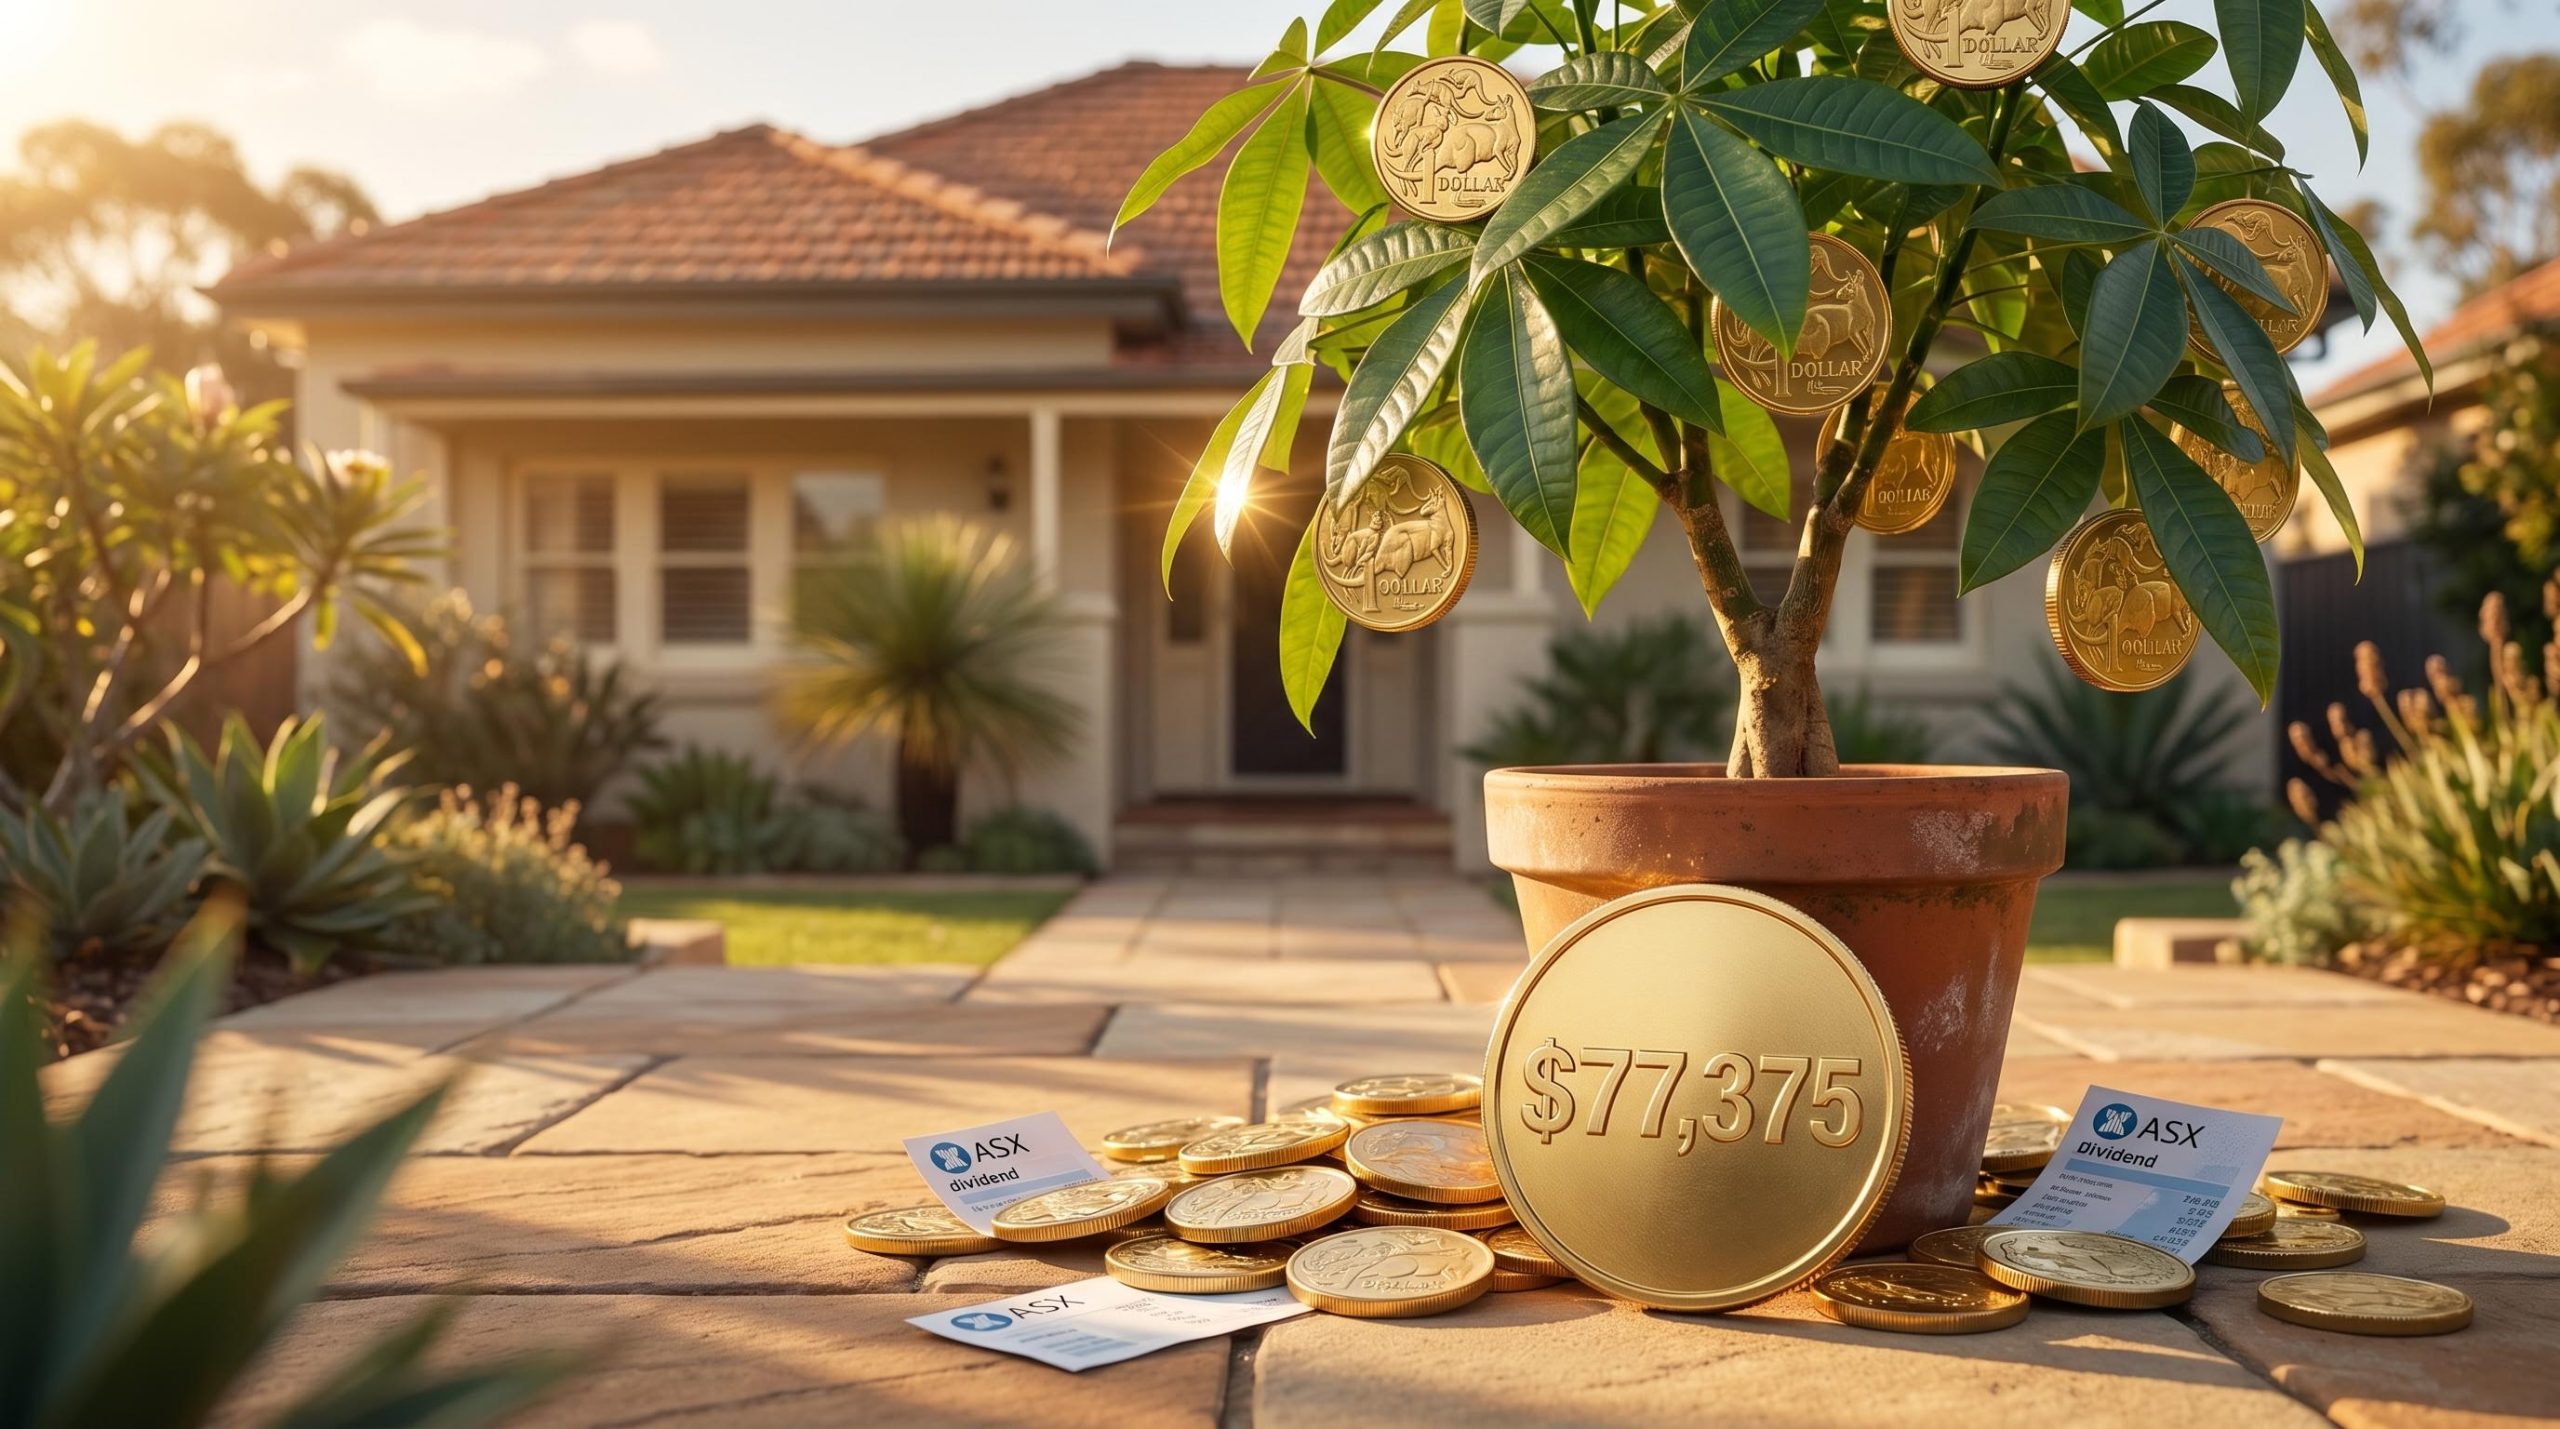
At a 4% cash yield, generating $77,000 a year in dividend income, roughly what the Association of Superannuation Funds of Australia (ASFA) defines as a comfortable retirement for a couple, requires approximately $1.9 million in invested capital. Most Australians will not arrive at that number by accident. Interest in living off dividends in Australia has grown among investors who want income that does not depend on selling shares or timing markets. Yet the full mechanics of building that income, and the real risks that erode it, are rarely assembled in one place. This guide covers the complete architecture: how much capital is realistically needed, how ETFs compare to individual stock selection, what compounding timelines look like on ordinary incomes, why inflation threatens purchasing power more than most income investors acknowledge, and how the super and non-super account structure works to maximise tax efficiency across both accumulation and retirement phases.
Calculating your income target and the capital required to fund it
The starting point is not a portfolio. It is a number: the annual income required to fund the life the investor wants.
ASFA’s Retirement Standard, updated for the December quarter 2025, provides the most widely referenced benchmarks for Australian retirees who own their home. A single person needs $54,840 per year for a comfortable lifestyle and $35,503 for a modest one. A couple needs $77,375 for comfortable and $51,299 for modest.
The ASFA Retirement Standard, updated each quarter, publishes the detailed expenditure breakdowns behind these benchmark figures, covering housing, health, leisure, and transport costs for both singles and couples at comfortable and modest lifestyle levels.
ASFA’s couple comfortable retirement benchmark sits at $77,375 per year, the figure most Australian dividend investors treat as the baseline for financial independence planning.
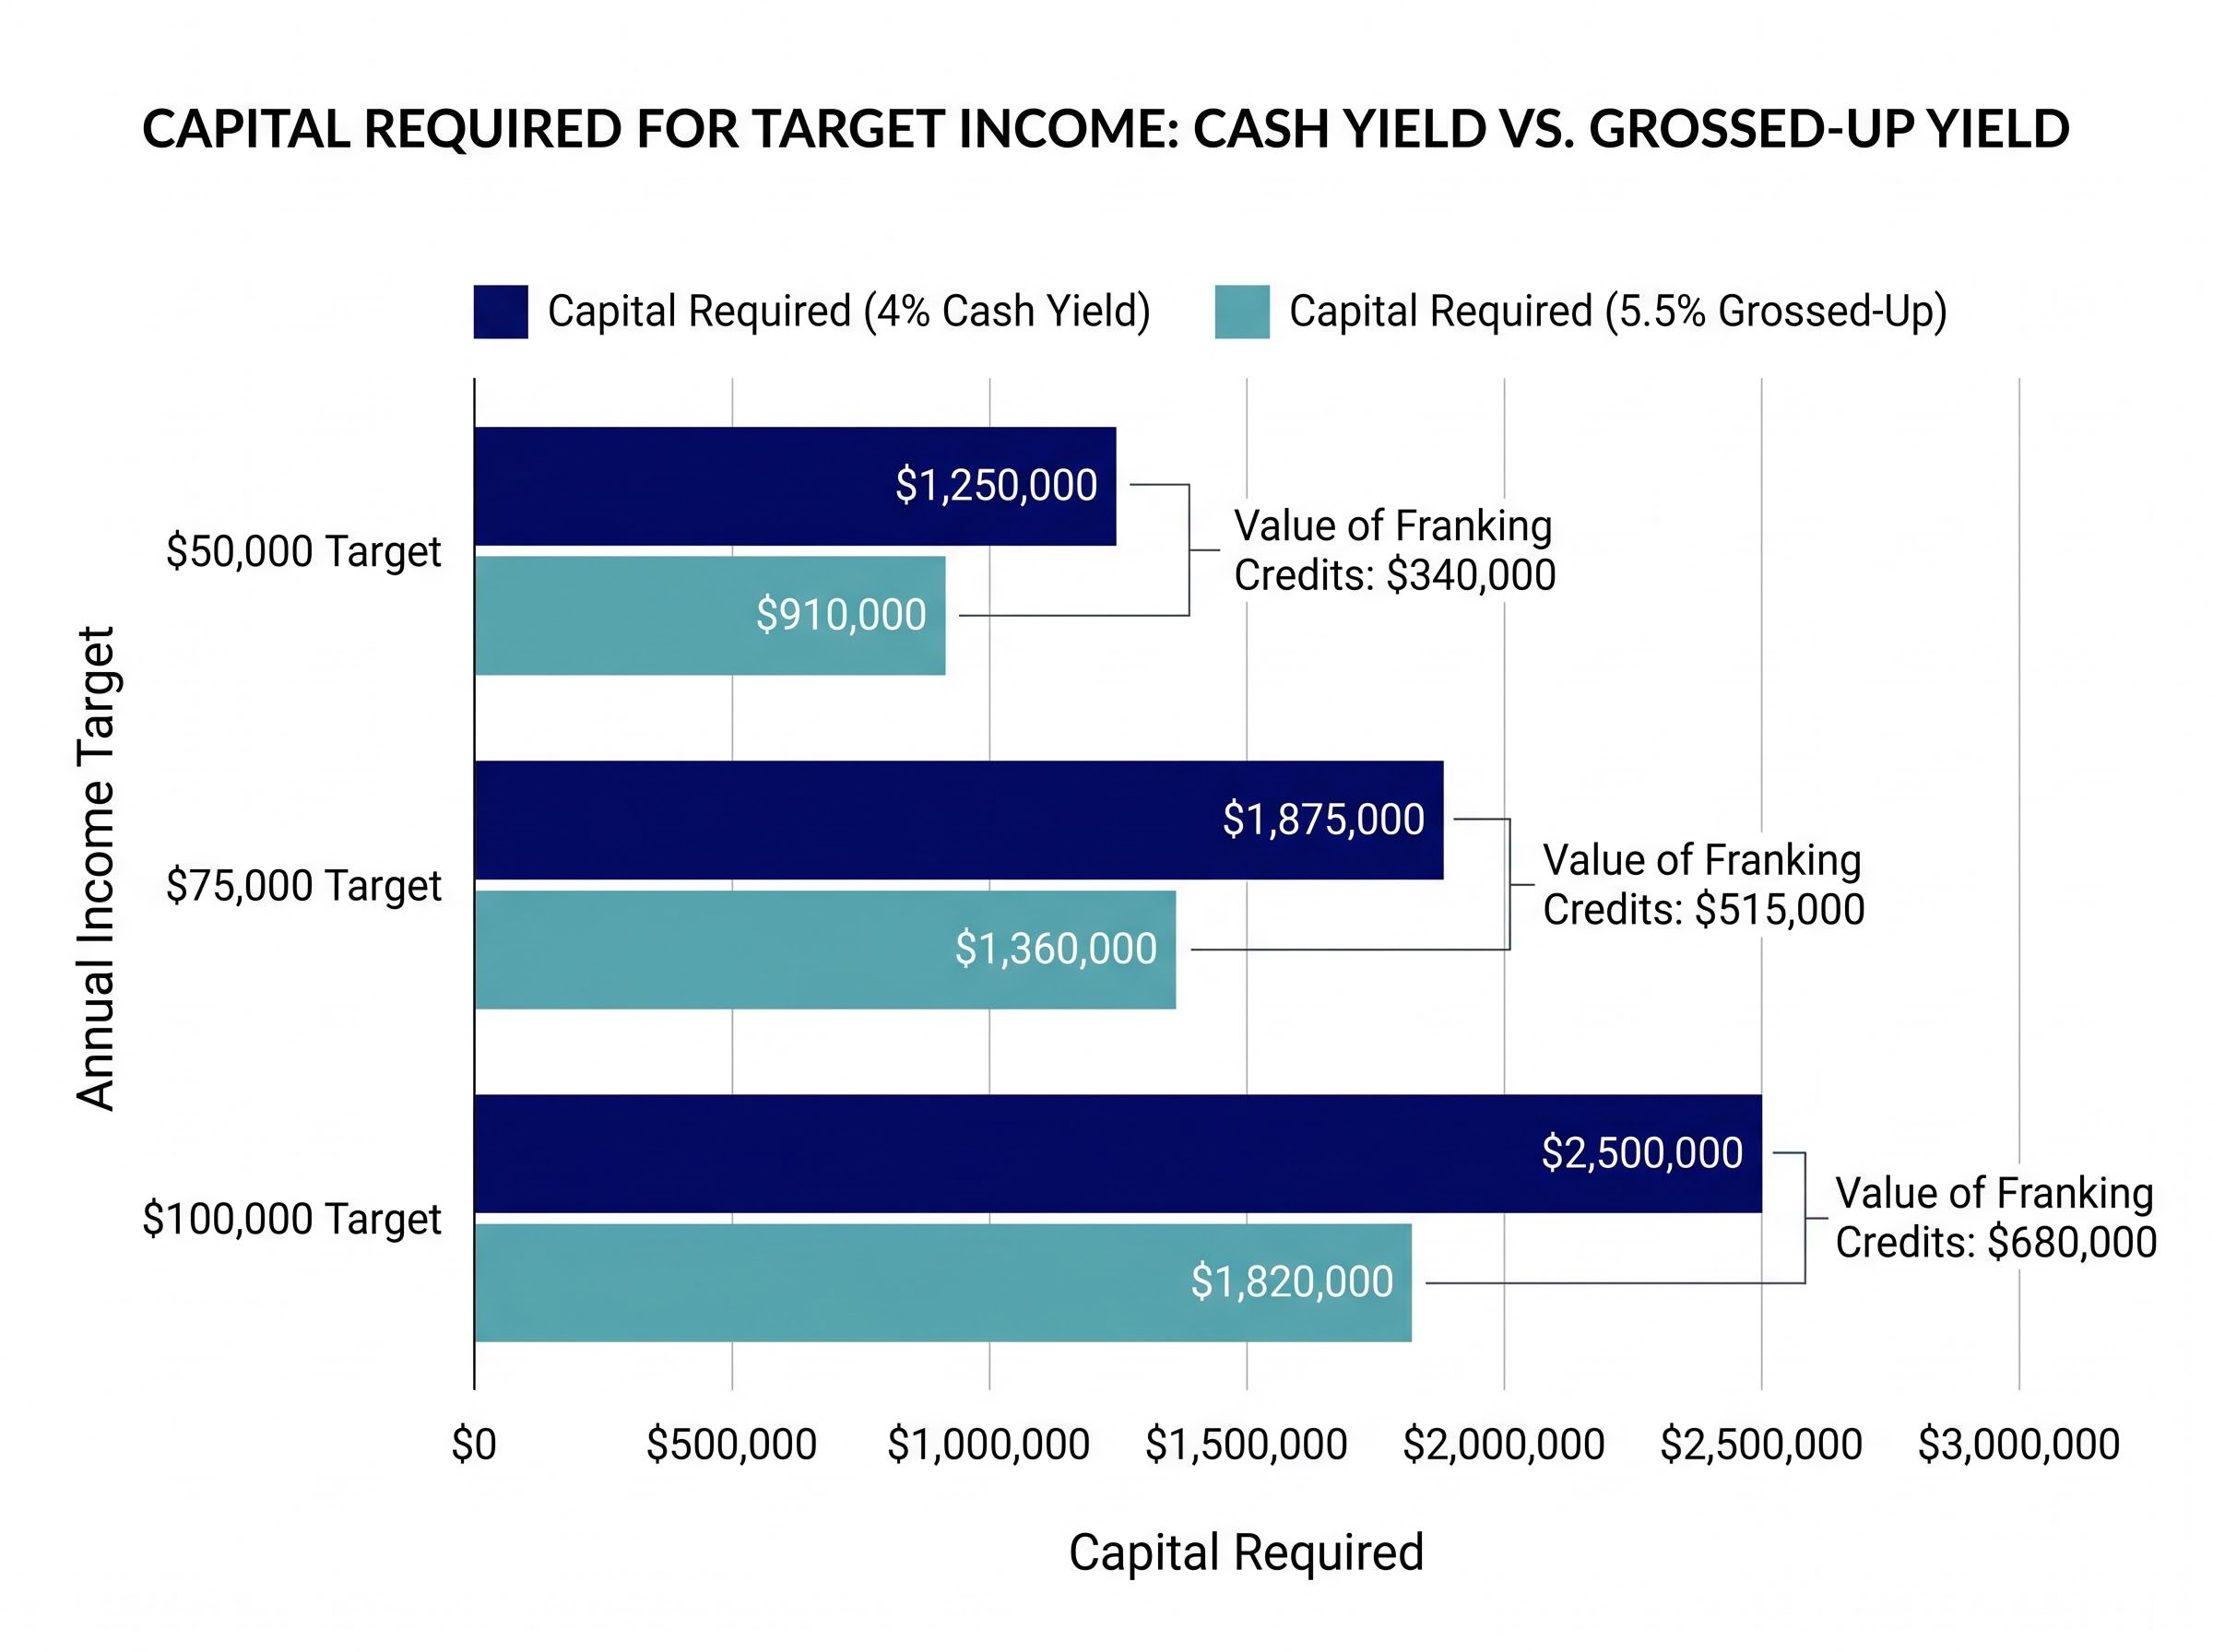
The capital required to generate that income depends entirely on the yield assumption. A conservative 4% cash yield, which strips out franking credits, produces larger capital targets. A 5.5% grossed-up figure, which includes the value of franking credits for Australian tax residents, brings those targets down meaningfully.
| Annual Income Target | Capital Required (4% Cash Yield) | Capital Required (5.5% Grossed-Up) |
|---|---|---|
| $50,000 | $1,250,000 | $910,000 |
| $60,000 | $1,500,000 | $1,090,000 |
| $75,000 | $1,875,000 | $1,360,000 |
| $80,000 | $2,000,000 | $1,455,000 |
| $100,000 | $2,500,000 | $1,820,000 |
The gap between the two columns is the value of franking credits, and it is the reason the next section matters. A dividend income goal is not a single number; it is a range shaped by lifestyle choice and the yield assumption the investor is willing to plan around.
When big ASX news breaks, our subscribers know first
How Australia’s franking credit system changes the income equation
Australia’s dividend imputation system is not a bonus. It is a refund of tax already paid. When an Australian company earns a profit, it pays corporate tax at 30% before distributing dividends. The franking credit attached to that dividend represents the corporate tax the company has already settled on the investor’s behalf.
How franking credits work
The arithmetic is straightforward. A company earns $100 in profit, pays $30 in corporate tax, and distributes the remaining $70 as a fully franked dividend. The investor receives the $70 cash dividend plus a $30 franking credit, giving a grossed-up income of $100. Tax is assessed on the full $100, but the $30 credit is applied against the investor’s personal liability.
The franking credit calculations follow a consistent formula regardless of the investor’s account type: cash dividend multiplied by 30, divided by 70, reflecting the 30% corporate tax rate already settled by the company before distribution, with the resulting credit applied directly against the investor’s personal tax liability or refunded in full where the effective rate falls below zero.
A 4% headline dividend yield on the ASX 200, once franking credits are included, grosses up to approximately 5.5-6%. That differential is worth hundreds of thousands of dollars in reduced capital requirements.
Australia and New Zealand are among the very few countries globally that operate a full dividend imputation system. In the United States and United Kingdom, corporate profits are taxed at the company level and again when dividends reach the shareholder, with no equivalent credit mechanism.
What this means for your tax position
The practical effects of franking credits vary across three investor scenarios:
- Accumulation-phase investor on a marginal tax rate: Franking credits reduce the net tax payable on dividend income, with the benefit increasing as the investor’s marginal rate falls closer to or below the 30% corporate rate.
- Retiree outside super with low income: Investors earning solely fully franked dividends can receive approximately $30,000 annually with near-zero net tax liability, given the $18,200 tax-free threshold and the credit offset.
- Investor inside super in pension phase: Franking credits become fully refundable at the 0% pension-phase tax rate, meaning the fund receives a cash refund for every dollar of credit attached.
The advantage scales with how low the investor’s effective marginal rate sits relative to the 30% corporate rate. For retirees in pension-phase super, the advantage is absolute.
ETFs versus individual stocks: which builds income more reliably?
The vehicle choice is where most new dividend investors either build a durable income stream or begin chasing yield into trouble.
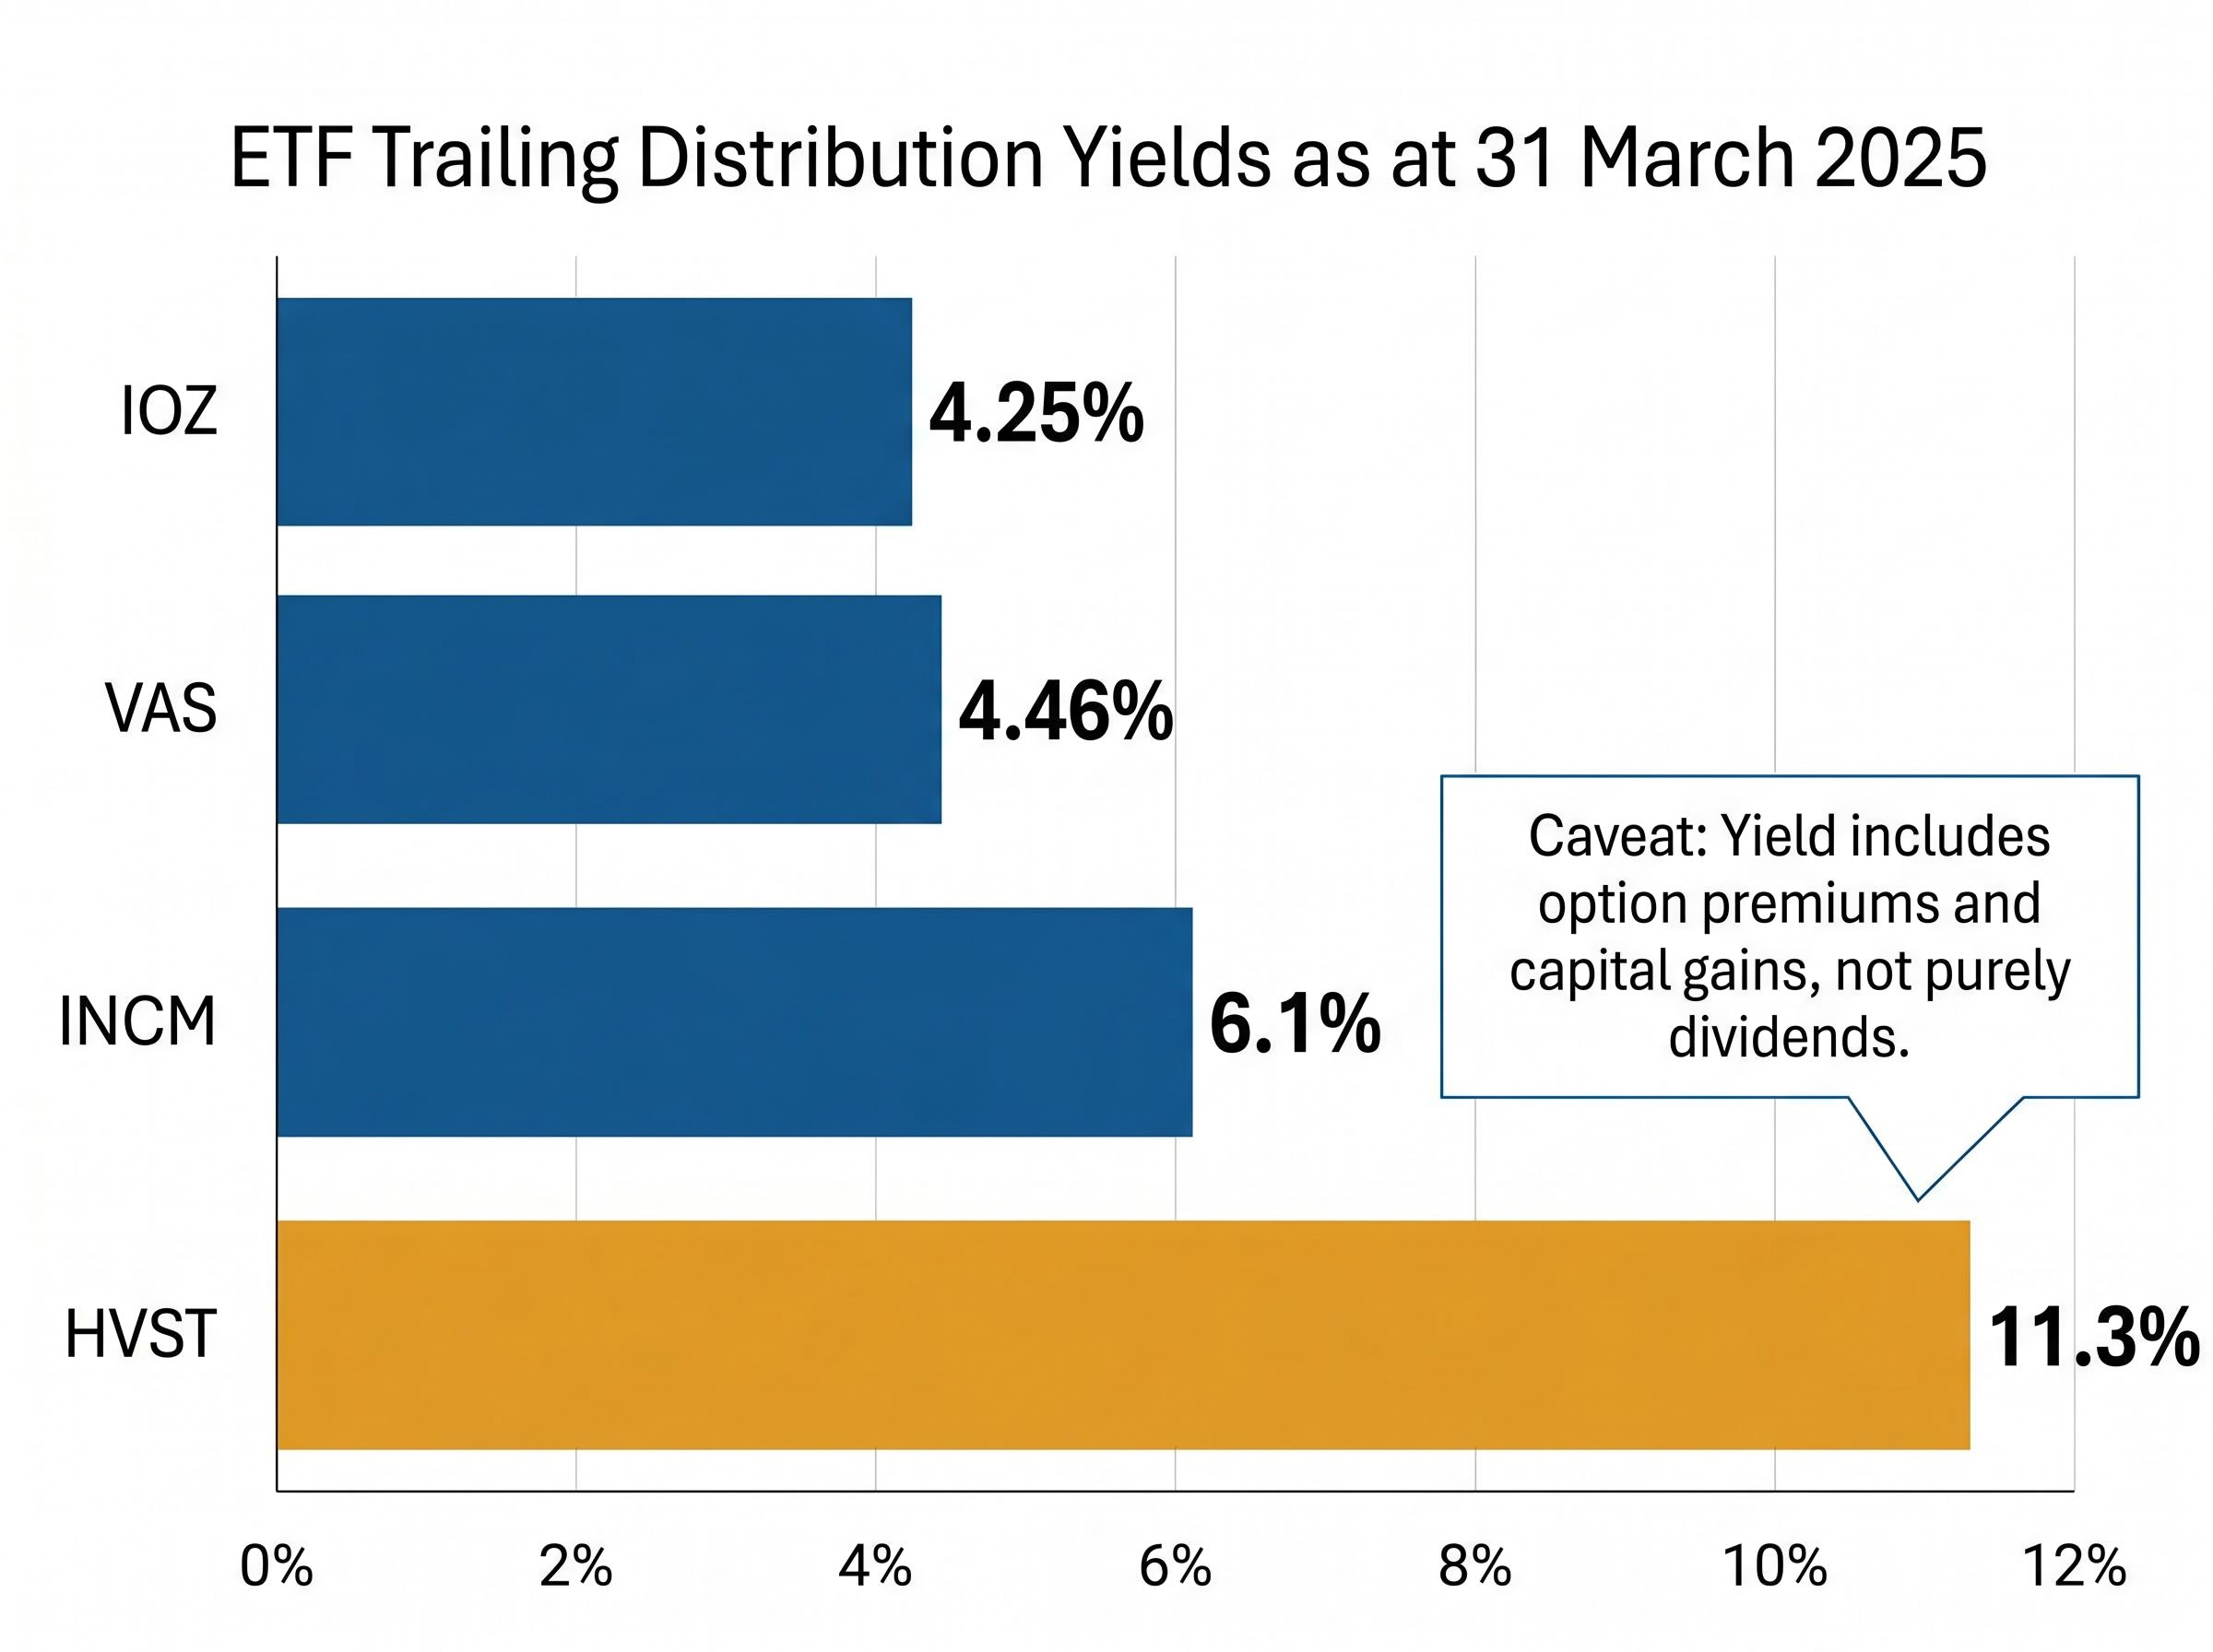
Four ASX-listed ETFs represent the main options, but their headline yields tell very different stories. All figures below are 12-month trailing distribution yields as at 31 March 2025, net of fees and before franking.
| ETF | Trailing Yield | Index / Strategy | Estimated Franking | Key Caveat |
|---|---|---|---|---|
| VAS | 4.46% | ASX 300 broad market | Mostly/fully franked | Broad exposure, not income-optimised |
| IOZ | 4.25% | S&P/ASX 200 | Includes franked dividends | Similar broad exposure to VAS |
| INCM | 6.1% | Income-focused, franked dividend selection | Franked dividend focus | Active income tilt, narrower portfolio |
| HVST | 11.3% | Actively managed dividend harvest | Varies | Yield includes option premiums and capital gains, not purely dividends |
HVST’s headline 11.3% demands scrutiny. That figure includes option premiums and realised capital gains alongside dividends. It is not a like-for-like comparison with VAS or IOZ, which distribute primarily dividend income. Treating it as a pure yield figure is a common and costly error.
Research consistently estimates that a simple two-ETF portfolio outperforms approximately 90% of active stock pickers over a 20-year period. For most investors, ETFs are the higher-probability income vehicle because they deliver diversified, largely franked income without the concentration risk that comes with building a portfolio of individual names.
A more detailed ASX dividend ETF comparison across VHY, SYI, IHD, and several other income-focused products shows that total return inclusive of franking credits diverged by more than 30 percentage points between the best and worst performers in the year to 31 March 2026, a spread that trailing yield figures alone would never have predicted.
Individual stock selection can add yield for investors who understand the risks. The major banks, BHP, Wesfarmers, Telstra, Woolworths, and major insurers all feature in income-focused portfolios. The danger lies in chasing the highest yields without examining why they are high. Warning signs of a yield trap include:
- Very high headline yield relative to sector peers
- Deteriorating earnings over multiple reporting periods
- A rising payout ratio that exceeds sustainable levels
- A sector in structural decline with limited growth runway
Stocks yielding 10-12% on the ASX are frequently priced that way because the market expects a dividend cut. ETFs remain the defensible default for investors who want income reliability over maximum headline yield.
What the compounding timeline actually looks like on a normal income
The capital targets in the first section feel large. The compounding timeline makes them feel reachable.
At an 8% total annual return, which sits below the long-term historical average for the ASX, two modest monthly contribution levels produce the following results:
Contributing $1,500 per month at 8% annual total return reaches approximately $900,000 in roughly 19 years. At $2,000 per month, the same milestone arrives in approximately 17 years.
An investor beginning in their late twenties could potentially reach the $900,000 threshold before age 50 using either contribution level. At a 5.5% grossed-up yield, $900,000 generates approximately $49,500 per year in income, slightly below the $50,000 annual target but within range of the ASFA single comfortable benchmark.
The portfolio lifecycle moves through three distinct phases:
- Accumulation with dividend reinvestment (DRP): All distributions are automatically reinvested into additional units, compounding both yield and capital growth.
- Transition decision: The investor evaluates when distributions alone, without reinvestment, cover the target income requirement.
- Income-drawing phase: DRP is switched off, and distributions flow as cash income.
The role of dividend reinvestment during accumulation
Dividend reinvestment plans work mechanically by converting quarterly distributions into additional ETF or share units at the prevailing price, typically with no brokerage cost. The effect compounds both the distribution yield and any underlying capital growth, accelerating progress toward the capital target.
Knowing when to switch from reinvesting to drawing income
The transition trigger is specific: when distributions alone cover the investor’s target income requirement without needing to reinvest. Many investors make this switch gradually, reducing DRP participation as they approach or enter the income phase rather than switching off all reinvestment at once.
Why inflation is the risk most dividend investors underestimate
A portfolio that generates $50,000 a year today will not buy $50,000 worth of living in a decade. At 3% annual inflation, that same lifestyle costs approximately $67,000 in 10 years and approximately $90,000 in 20 years.
| Starting Income Need | After 10 Years (3% Inflation) | After 20 Years (3% Inflation) |
|---|---|---|
| $50,000 | $67,000 | $90,000 |
| $75,000 | $101,000 | $135,000 |
| $100,000 | $134,000 | $181,000 |
The Australian Bureau of Statistics reported CPI inflation of 3.4% for the year to December 2024 and 3.2% for the year to March 2025. These are not outlier figures; they are the environment dividend income must grow through.
The empirical record offers limited comfort. According to Firstlinks analysis published in May 2024, the ASX 200 dividend compound annual growth rate (CAGR) over the five years to FY2023 was approximately 3-4%, compared with average CPI over the same period of approximately 3.5-4%. Dividend growth barely matched living costs.
The picture narrows further for bank-heavy portfolios. According to Morningstar analysis published in November 2024, the big four banks’ five-year dividend per share CAGR to FY2024 was approximately 2-3%, against a five-year average CPI of approximately 3%.
“If inflation runs at 3-4% and your dividend growth is only 2-3%, your real income is going backwards,” noted one Australian income manager cited by Livewire Markets.
Three sector categories offer comparatively stronger real dividend growth for investors seeking to mitigate this risk:
Inflation-resilient ASX positioning in 2026, with Australia’s headline CPI running at 4.6% for the 12 months to March 2026, extends beyond the resource and infrastructure tilts described here and includes specific ETF allocations across capital preservation, bond income, and quality equity strategies that can protect real purchasing power while maintaining income distribution levels.
- Resource stocks with commodity-linked revenues that tend to rise during inflationary periods
- Infrastructure stocks with inflation-linked revenue contracts or regulated pricing mechanisms
- Diversified income ETFs with active management that can rotate toward sectors with stronger real growth
A portfolio sized for today’s income need, without an inflation buffer built into the capital target, will be structurally insufficient within a decade.
Tax-efficient account structuring and how it determines what you keep
The single most powerful tax lever available to Australian dividend investors is the difference between the 15% accumulation-phase tax rate inside super and the 0% pension-phase rate. Structuring capital across both environments is not an advanced technique; it is the logical response to the super system’s constraints.
Inside super: the core income engine
In accumulation phase, franking credits offset the fund’s 15% tax on investment earnings. In pension phase, the tax rate drops to 0%, and franking credits become fully refundable, meaning the fund receives a cash payment for every dollar of credit attached to its dividends.
Prioritising fully franked Australian equity ETFs inside super maximises both the tax offsets during accumulation and the refunds during pension phase. This is why financial advisers consistently recommend positioning high-yield franked equities inside super up to the transfer balance cap.
| Parameter | Current Setting |
|---|---|
| Accumulation phase tax rate | 15% |
| Pension phase tax rate | 0% |
| Transfer balance cap (to 30 June 2025) | $1.9 million |
| Transfer balance cap (from 1 July 2025) | $2 million |
| Concessional contributions cap (from 1 July 2024) | $30,000 per year |
| Non-concessional contributions cap (from 1 July 2024) | $120,000 per year (bring-forward: up to $360,000 over 3 years) |
| Preservation age | 55-60 (depending on date of birth) |
The transfer balance cap, which increases from $1.9 million to $2 million from 1 July 2025, determines how much capital can sit in the 0% pension-phase environment. Balances above the cap remain in accumulation at 15%, making deliberate asset location decisions necessary for investors with larger portfolios.
Contribution caps ($30,000 concessional, $120,000 non-concessional per year from 1 July 2024) are generally described in industry commentary as helpful but not transformative for pre-retirees attempting to shift capital into super quickly.
For investors who want to act on the contribution strategy before the financial year closes, our dedicated guide to 2026 superannuation cap changes covers the exact mechanics of carry-forward concessional contributions, the July 2026 cap increases to $32,500 concessional and $130,000 non-concessional, and the conditions under which unused FY2020-21 cap amounts expire permanently on 30 June 2026.
Outside super: bridging income and flexibility
The outside-super portfolio serves two functions. First, it provides income access before preservation age (55-60 depending on birth year), since investors cannot draw on superannuation until that threshold is reached. Second, it houses global growth assets and any capital above the transfer balance cap.
Franking credits still reduce personal tax liability outside super, particularly for investors with low marginal rates. The outside-super portfolio also provides estate-planning flexibility that super does not.
The recommended asset location hierarchy, drawn from multiple Australian financial planning sources, follows this order:
- High-yield franked Australian equities inside super up to the transfer balance cap, maximising the 0% pension-phase tax benefit
- Growth and global assets in taxable accounts outside super, where franking is less relevant and capital gains discount applies
- Excess capital above the cap held in accumulation phase inside super or in the outside-super portfolio, depending on the investor’s marginal rate and liquidity needs
Building the portfolio is the beginning, not the destination
The architecture described in this guide is a framework, not a fixed plan. Income targets shift as living costs change. Super rules are periodically updated. The transfer balance cap has already been adjusted and will likely move again. Dividend yields compress and expand with market cycles.
Six decisions define the structure of an Australian dividend income strategy:
- The income target, informed by ASFA benchmarks and personal lifestyle requirements
- The yield assumption used for capital planning (conservative 4% cash or 5.5% grossed-up)
- The vehicle choice between ETFs and individual stocks
- The monthly contribution level that maps to a specific compounding timeline
- The inflation buffer built into the capital target to protect real purchasing power
- The inside/outside-super structure that determines how much of the income stream is kept after tax
Calculate a specific income target. Derive the capital number from a conservative yield assumption. Map it to a monthly contribution that fits current capacity, and treat the compounding timeline as the commitment horizon. The portfolio is the instrument; the discipline is the strategy.
This article is for informational purposes only and should not be considered financial advice. Investors should conduct their own research and consult with financial professionals before making investment decisions. Past performance does not guarantee future results. Financial projections are subject to market conditions and various risk factors.