CBA, Wesfarmers, and Telstra have each reported first-half FY2026 results in recent months, and across all three, interim dividends rose by more than 4% year on year. For investors building long-term income positions on the ASX, that consistency within a single reporting season carries more analytical weight than any individual yield figure.
Australian income investors face a structural choice: chase the highest current yield available, or target companies that systematically grow their payouts over time. With all three companies having delivered H1 FY2026 results and carrying analyst forecasts through FY2026 (and in Telstra’s case to FY2030), the reporting season creates an analytically rich moment to examine what drives durable dividend compounding on the ASX. What follows is an assessment of the specific earnings evidence, management commitment, and risk considerations underpinning dividend growth at each company, and an explanation of why payout growth rate matters more than starting yield for long-term income compounding.
Why dividend growth rate beats starting yield for long-term income investors
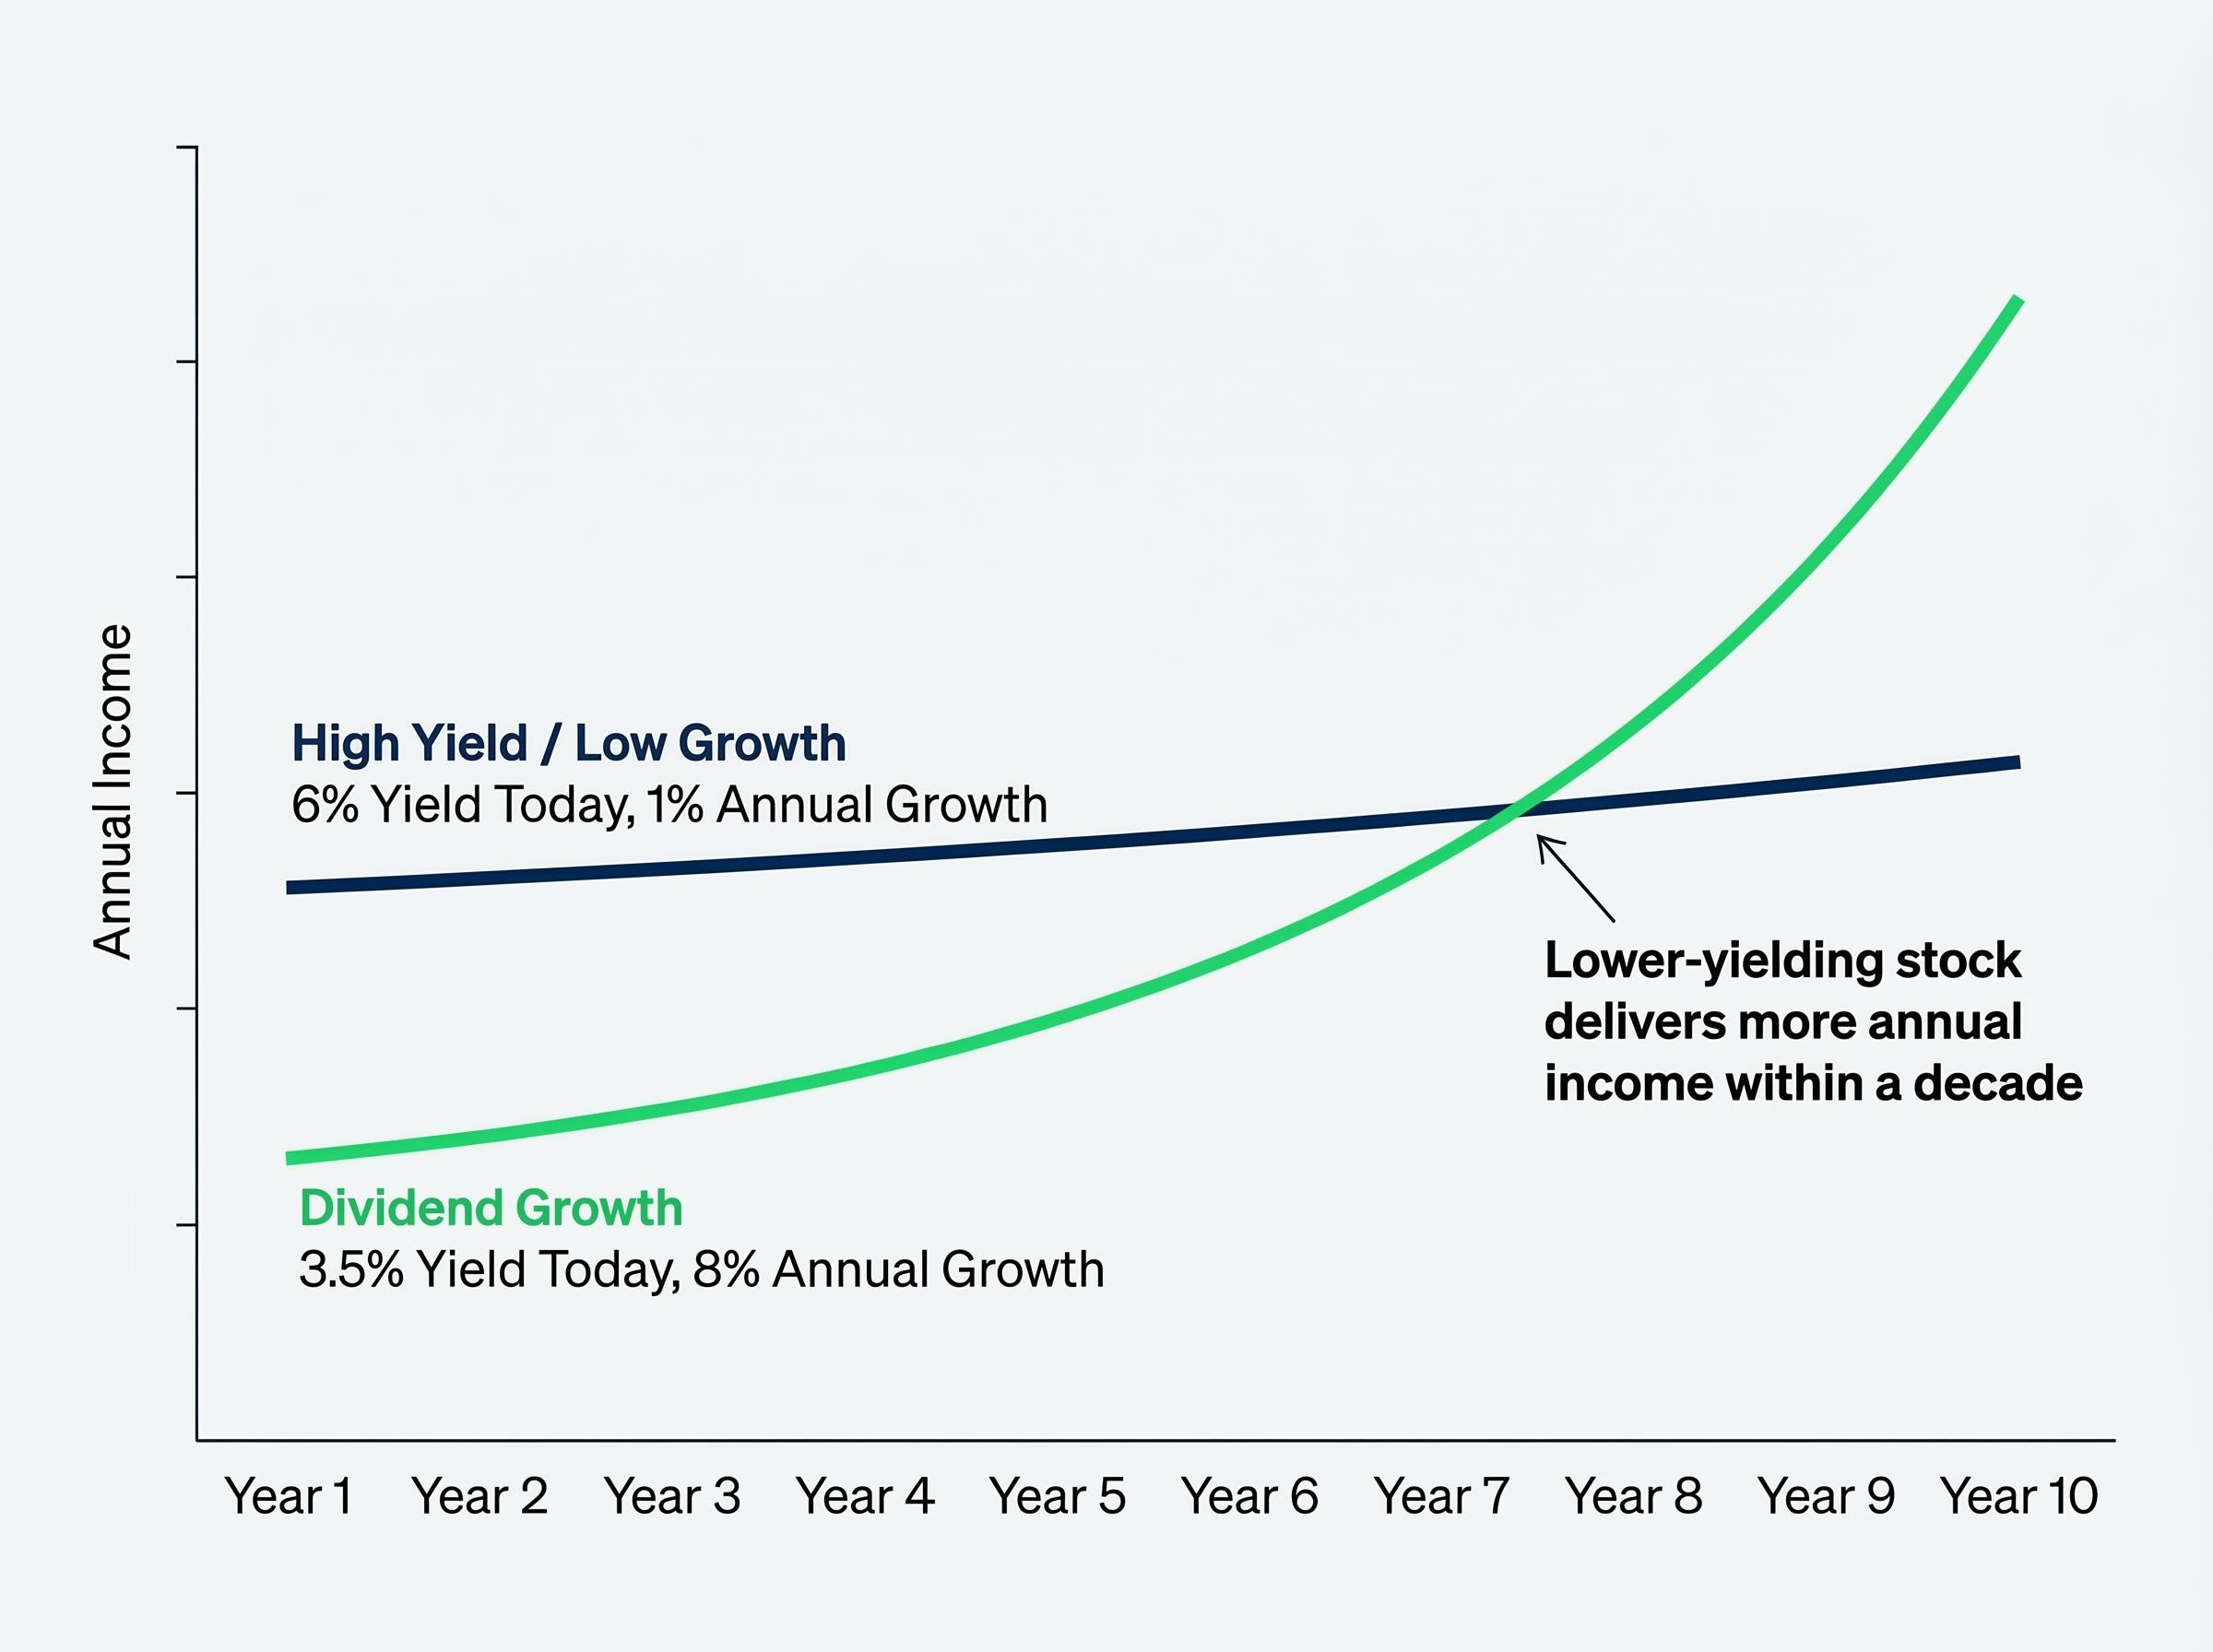
Consider two hypothetical stocks. One yields 6% today but grows its dividend at 1% annually. The other yields 3.5% but compounds its payout at 8% per year. Within a decade, the lower-yielding stock delivers more annual income on the original investment, and the gap widens every year thereafter. The growth rate, not the starting yield, is the variable that determines long-term income outcome.
Applying a total return lens to dividend investing reframes the question from ‘what yield does this stock pay today’ to ‘what combination of income growth and price behaviour will this holding deliver over a decade,’ a distinction that explains why the compounding crossover illustrated above is the more useful analytical frame.
Two distinct investor archetypes coexist on the ASX:
- High-yield investors typically favour REITs, utilities, and mature financials offering elevated current income, higher payout ratios, limited reinvestment capacity, and greater vulnerability to earnings pressure from rate movements or regulation.
- Dividend-growth investors target companies with lower starting yields, stronger balance sheets, moderate payout ratios that retain earnings for reinvestment, and demonstrated multi-year records of increasing distributions per share.
The structural hallmark of sustainable dividend growth is a moderate payout ratio, not a maximum one. Companies that retain a meaningful share of earnings fund the business capacity, whether through reinvestment, acquisition, or debt reduction, that drives future increases in dividends per share.
All three companies examined in this analysis carry lower starting yields than the highest-yielding ASX names. Each has established a multi-year streak of rising distributions. The earnings evidence from their H1 FY2026 results explains why.
When big ASX news breaks, our subscribers know first
CBA’s 4.4% interim dividend lift anchors a five-year payout growth streak
Commonwealth Bank of Australia declared a fully franked interim dividend of $2.35 per share for H1 FY2026, a 4.4% increase on the prior corresponding period. The bank has now restored and grown its dividend annually across five consecutive years following the pandemic-era reduction.
$2.35 per share, fully franked, up 4.4% year on year. CBA’s interim dividend extends the longest active payout growth streak among the major banks.
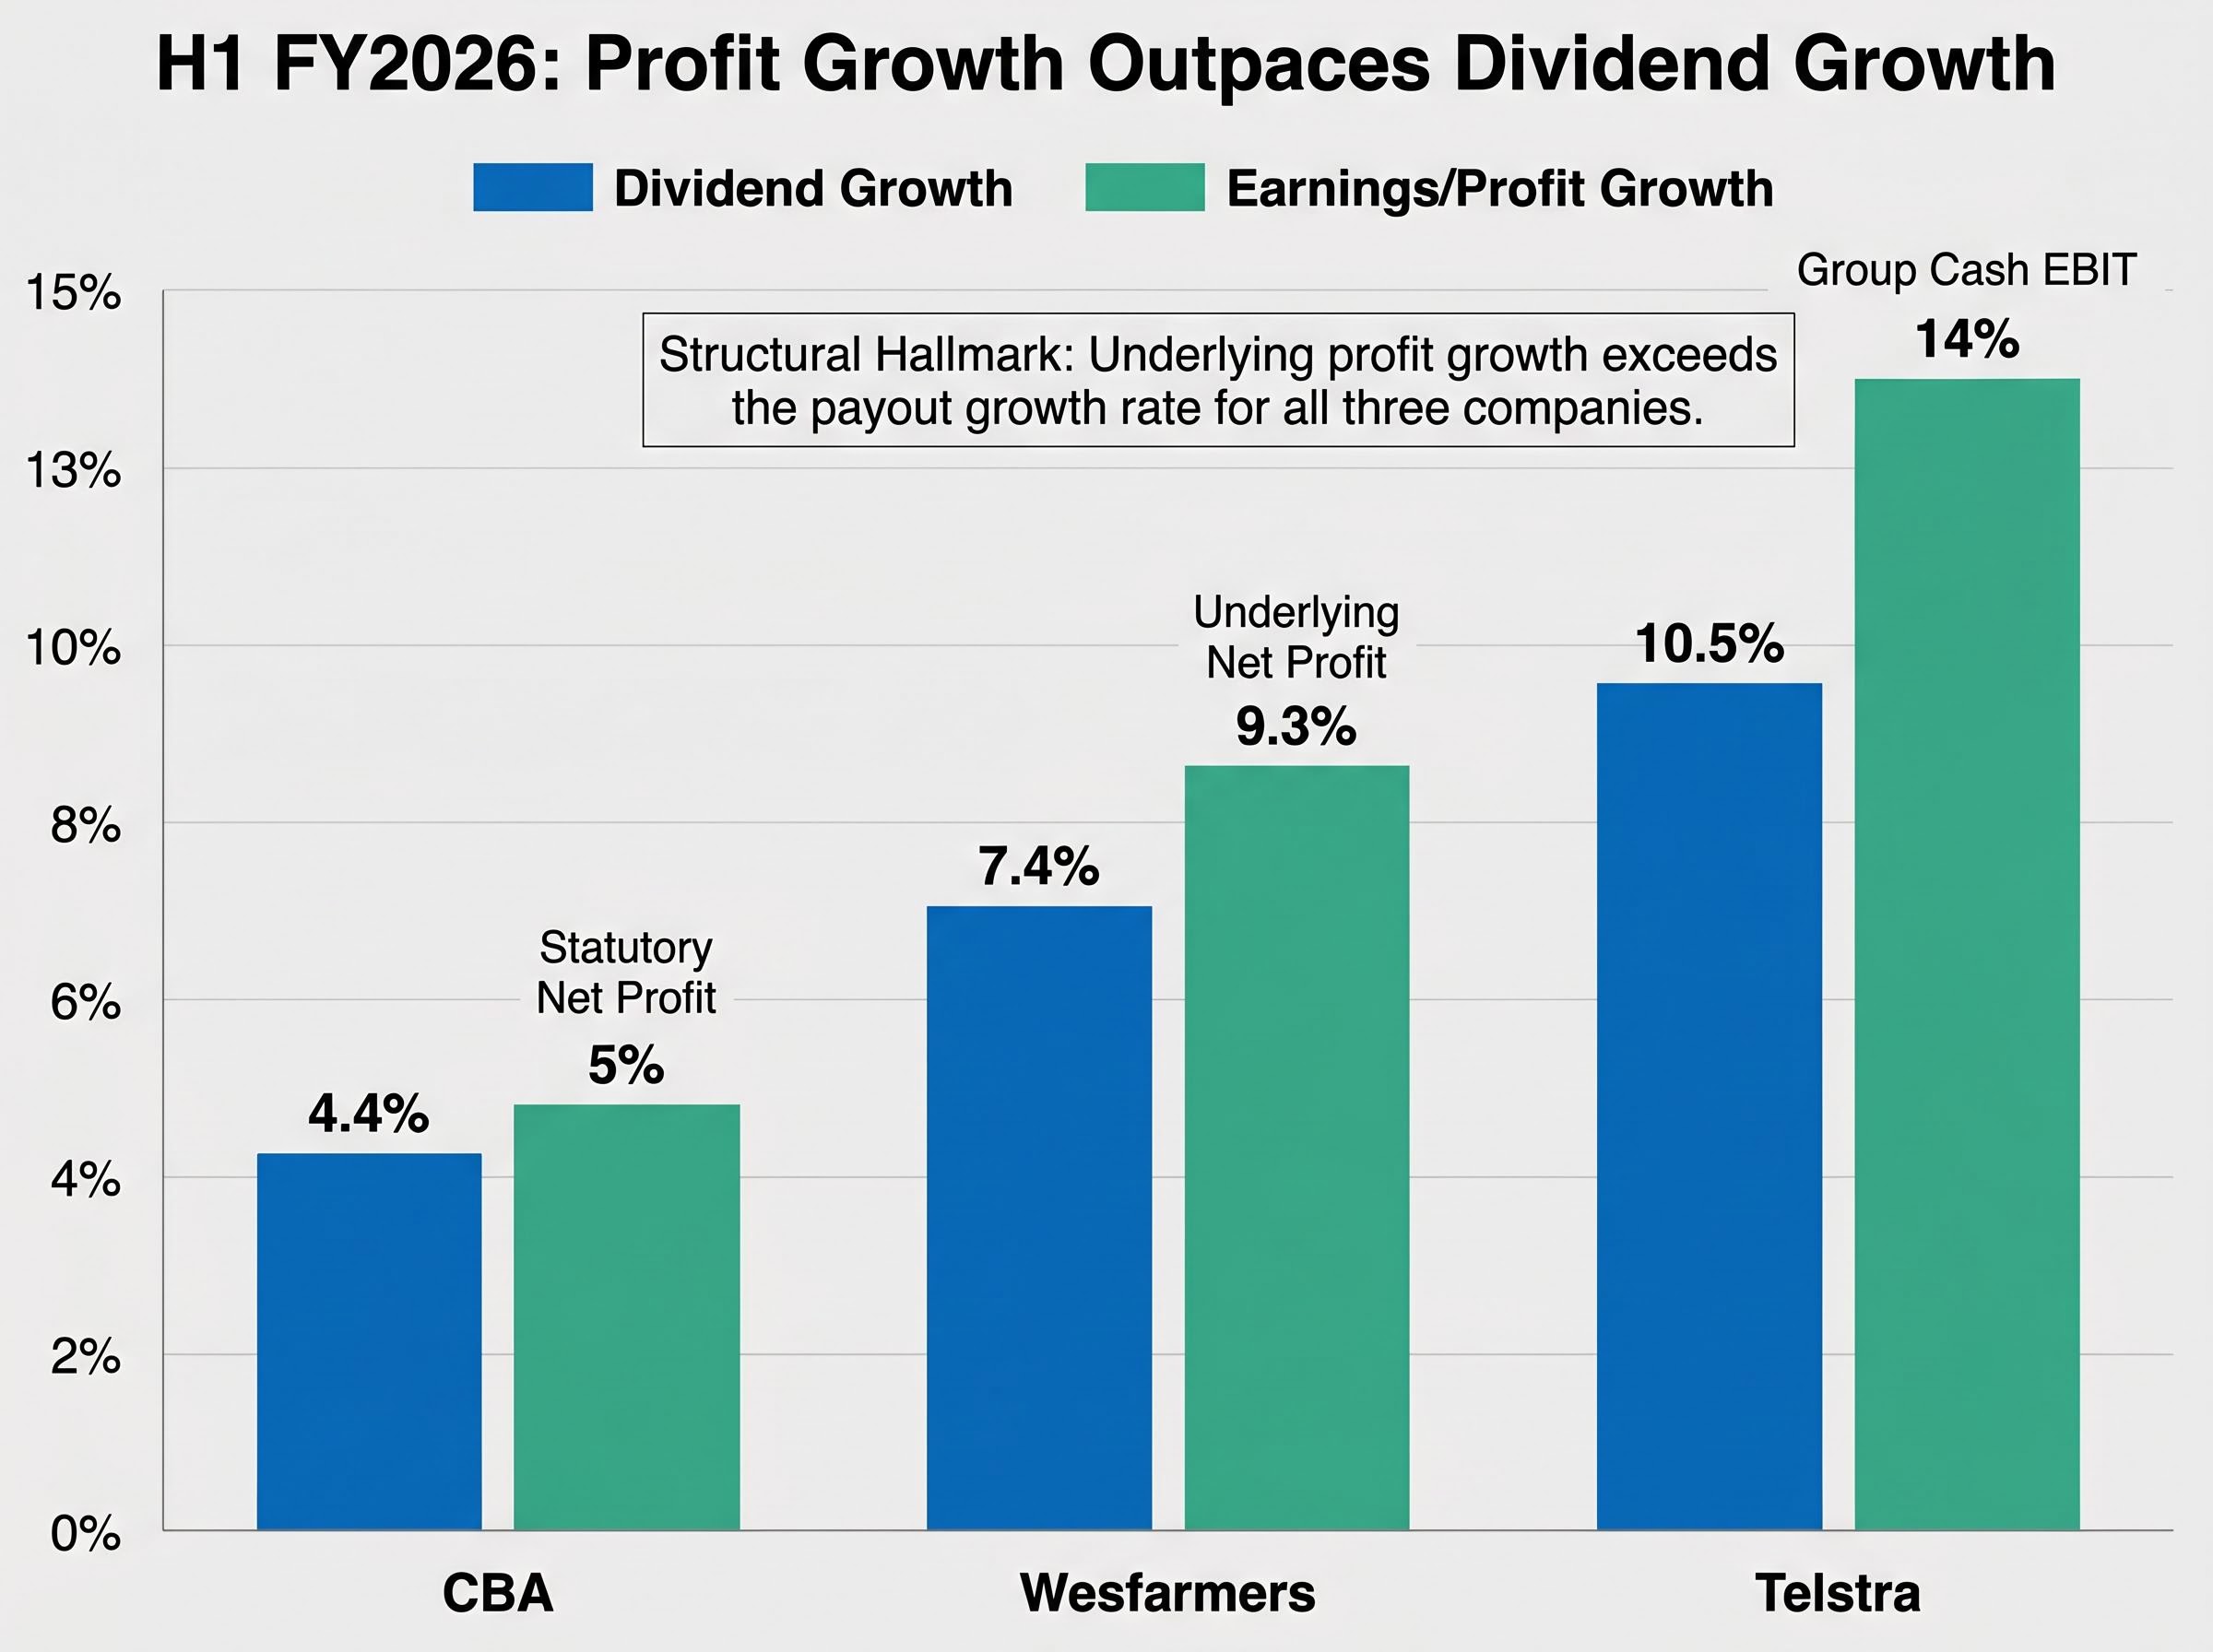
The increase was earnings-funded. Statutory net profit for the half reached $5.41 billion, up 5% year on year. That profit growth rate exceeded the dividend growth rate, preserving payout headroom rather than stretching it. With approximately 800,000 individual shareholders, CBA remains the single most widely held stock among Australian retail income investors.
Forward outlook and key risks to CBA’s dividend trajectory
Market consensus has shifted upward through 2026. The FY2026 full-year dividend forecast now sits at approximately $5.15 per share (fully franked), above the earlier February 2026 projection of $5.05 from CMC Invest. FY2027 consensus has moved to approximately $5.45 per share. Full-year FY2026 results are scheduled for 12 August 2026, the next major data point for income investors tracking the trajectory.
The grossed-up dividend yield, inclusive of franking credit value, implies approximately 4.5% at current levels. Three categories of risk bear monitoring: credit cycle deterioration and rising impairment charges if unemployment increases; net interest margin compression from RBA rate movements and competitive mortgage pricing; and APRA capital framework constraints that could limit payout ratios if risk-weighted assets grow. These are ongoing headroom considerations rather than near-term threats to the dividend.
The grossed-up yield on CBA, inclusive of the 30% corporate tax credit attached to its fully franked dividends, produces a materially higher after-tax income figure than the headline cash yield for investors in lower tax brackets and pension-phase SMSF accounts, a structural advantage that makes like-for-like comparisons against term deposit rates or international equities misleading without the franking adjustment.
Wesfarmers posts the strongest interim dividend growth of the three, up 7.4%
Wesfarmers declared a fully franked interim dividend of $1.02 per share for H1 FY2026, a 7.4% increase year on year. That makes it the fastest grower among the three companies for this reporting period, and the payout sits on a profit base that grew even faster.
Underlying net profit for the half rose 9.3% to $1.6 billion. The dividend growth rate ran below the earnings growth rate, a signal that management is funding distributions from profit expansion rather than stretching the balance sheet.
Bunnings and Kmart each delivered strong contributions to first-half earnings. The Covalent Lithium joint venture’s refinery was completed under budget and is now producing high-grade lithium hydroxide, adding an emerging revenue stream to the portfolio. The earnings base spans:
- Bunnings: The dominant home improvement and hardware retailer, leveraged to housing activity and renovation spend.
- Kmart/Target: Discount retail operations with improving cost efficiencies.
- Chemicals and fertilisers: Industrial inputs with cyclical but diversifying earnings.
- Covalent Lithium: Early-stage production contributing a new commodity exposure.
Management has stated a commitment to growing dividends in line with earnings and cash flow, an explicit policy anchor rather than an implied expectation. Wesfarmers has raised its annual dividend every year since the 2020 Coles divestiture.
Household spending risks and the outlook for Wesfarmers DPS
Analyst projections forecast a total FY2026 annual dividend of $2.20 per share, according to CMC Invest estimates reported in May 2026. Sustained cost-of-living pressure or a decline in housing turnover could moderate Bunnings revenue growth in the second half. Wage inflation and logistics costs represent margin-compression risks across the discount retail divisions. These factors may temper the pace of future DPS increases without necessarily reversing the growth trajectory.
Telstra’s 10.5% interim dividend increase makes it the fastest grower in this cohort
Telstra’s interim dividend for H1 FY2026 rose 10.5% to 10.5 cents per share, paid March 2026. That growth rate is the highest among the three companies, and it is not an isolated number. It sits on a profit trajectory that makes it structurally explicable.
Group cash EBIT grew 14% in the first half, with mobile services revenue expanding 5.6% over the same period. Telstra’s mobile division continues to generate earnings growth through a combination of price increases and subscriber base expansion, and a disciplined cost-reduction programme supports the capacity to sustain future dividend increases. The company has now raised its annual dividend in each of the past four consecutive years.
According to UBS, Telstra is forecast to deliver annual dividend increases continuing through FY2030, the longest forward visibility window among the three companies examined here.
CMC Invest projects a FY2026 full-year dividend of 21 cents per share, representing over 10% growth relative to the 19-cent full-year payout in FY2025. Macquarie holds an Outperform rating on the stock with a price target of $5.04.
Franking, capex risks, and the mobile competition question
The H1 FY2026 interim dividend carried 90.5% franking rather than full franking. For Australian income investors comparing after-tax yields across the three stocks, this distinction affects grossed-up return calculations relative to the fully franked payouts from CBA and Wesfarmers.
Australia’s dividend imputation system, as explained in the Parliamentary Budget Office’s budget explainer on franking credits, allows shareholders to use attached franking credits as an offset against personal tax liabilities, meaning the grossed-up yield calculation materially affects after-tax return comparisons between fully franked and partially franked dividends.
Three risk categories remain relevant: aggressive competition from other carriers and mobile virtual network operators (MVNOs) could weigh on average revenue per user (ARPU); regulatory and infrastructure uncertainty around NBN arrangements and spectrum costs may alter earnings; and sustained heavy investment in 5G and fibre networks competes with cash available for distributions if returns on that capital are slower than anticipated.
Comparing the three: growth rates, forecasts, and what the data reveals
Placing the three results side by side reveals how a single analytical thesis (earnings-backed payout growth) expresses itself differently across banking, diversified retail, and telecommunications.
| Company | H1 FY2026 Interim DPS | Year-on-Year Growth | FY2026 Full-Year Forecast | Key Analyst Note |
|---|---|---|---|---|
| CBA | $2.35 (fully franked) | +4.4% | ~$5.15 | Full-year results 12 Aug 2026; FY2027 consensus ~$5.45 |
| Wesfarmers | $1.02 (fully franked) | +7.4% | $2.20 | Management committed to DPS growth in line with earnings |
| Telstra | 10.5¢ (90.5% franked) | +10.5% | 21¢ | Macquarie Outperform, $5.04 target; UBS growth to FY2030 |
The structural characteristics shared across the three companies reinforce the pattern:
Distinguishing genuine payout growth from dividend trap warning signs requires tracking whether yield increases are driven by rising DPS or by a falling share price; a yield rising because the stock has de-rated on deteriorating fundamentals is the opposite signal to the earnings-backed payout expansion documented across these three companies.
- All three increased interim dividends by more than 4%, funded by underlying profit growth that exceeded the payout growth rate.
- All three maintain moderate payout ratios, retaining earnings to reinvest in the business capacity that drives future DPS increases.
- Management at each company has either explicitly stated or consistently demonstrated a commitment to growing shareholder distributions over time.
- The three companies span banking, diversified retail and industrial, and telecommunications, offering meaningful sector diversification within a single dividend-growth strategy.
What Australian income investors should watch through the rest of FY2026
The H1 results establish the trajectory. The second half determines whether full-year forecasts hold. Income investors tracking these three names should monitor the following signposts in order of proximity:
- CBA full-year FY2026 results, 12 August 2026: The single most important near-term event. Confirmation of the ~$5.15 full-year DPS consensus, any commentary on APRA capital framework developments, and the trajectory of net interest margins under the prevailing RBA rate environment will shape the FY2027 outlook.
- Wesfarmers second-half consumer spending trends: Australian household expenditure data through the remainder of FY2026 will indicate whether Bunnings and Kmart revenue growth sustains the earnings momentum needed to deliver the $2.20 full-year forecast.
- Telstra full-year result confirming the 21-cent FY2026 DPS: Any mobile ARPU data and commentary on 5G capex allocation will indicate whether the 10%+ growth rate is repeatable or a peak.
- UBS Telstra dividend forecast revisions through FY2030: The longest-dated forward view among the three stocks. Any downward revision to this forecast would signal a structural change in Telstra’s income profile.
- RBA rate decisions and macro conditions: Rate movements affect CBA’s NIM directly and consumer spending conditions for Wesfarmers indirectly. The macro environment is the shared variable across all three positions.
Earnings trajectory and management commitment are the two lenses through which each upcoming result should be assessed. Yield comparison alone does not capture the variables that drive payout durability.
Earnings momentum, management commitment, and the compounding case for all three
The H1 FY2026 reporting season delivered a cohort result: CBA at +4.4%, Wesfarmers at +7.4%, Telstra at +10.5%. Different growth rates, different sectors, the same underlying pattern. Each increase was funded by profit growth that ran ahead of the payout increase. Each company retains sufficient earnings to reinvest in the business. Each has a management team with a stated or demonstrated commitment to growing distributions over time.
The multi-year evidence base extends beyond a single half. CBA has restored and grown its payout across five consecutive years. Wesfarmers has increased its dividend every year since the 2020 Coles divestiture. Telstra has delivered four straight years of annual increases, with UBS projecting that streak to continue through FY2030. Analyst coverage depth varies, from CBA’s FY2027 consensus to Telstra’s UBS FY2030 outlook to Wesfarmers’ management policy commitment, but the direction is consistent.
None of the three is a risk-free holding. Credit cycles, consumer conditions, mobile competition, and capital allocation decisions remain live considerations. For long-term Australian income investors, the metric that determines real income outcome is payout growth rate compounded over years. These three companies currently represent the ASX cohort most clearly demonstrating that thesis through reported earnings.
For investors wanting to translate the payout growth evidence examined here into a structured long-term investing framework, our dedicated guide to building a dividend portfolio that compounds over decades covers payout ratio screening as a quality gate, free cash flow coverage thresholds, DRIP mechanics as the compounding engine, and how to identify high-yield traps before they damage an income portfolio.
This article is for informational purposes only and should not be considered financial advice. Investors should conduct their own research and consult with financial professionals before making investment decisions. Past performance does not guarantee future results. Financial projections are subject to market conditions and various risk factors.