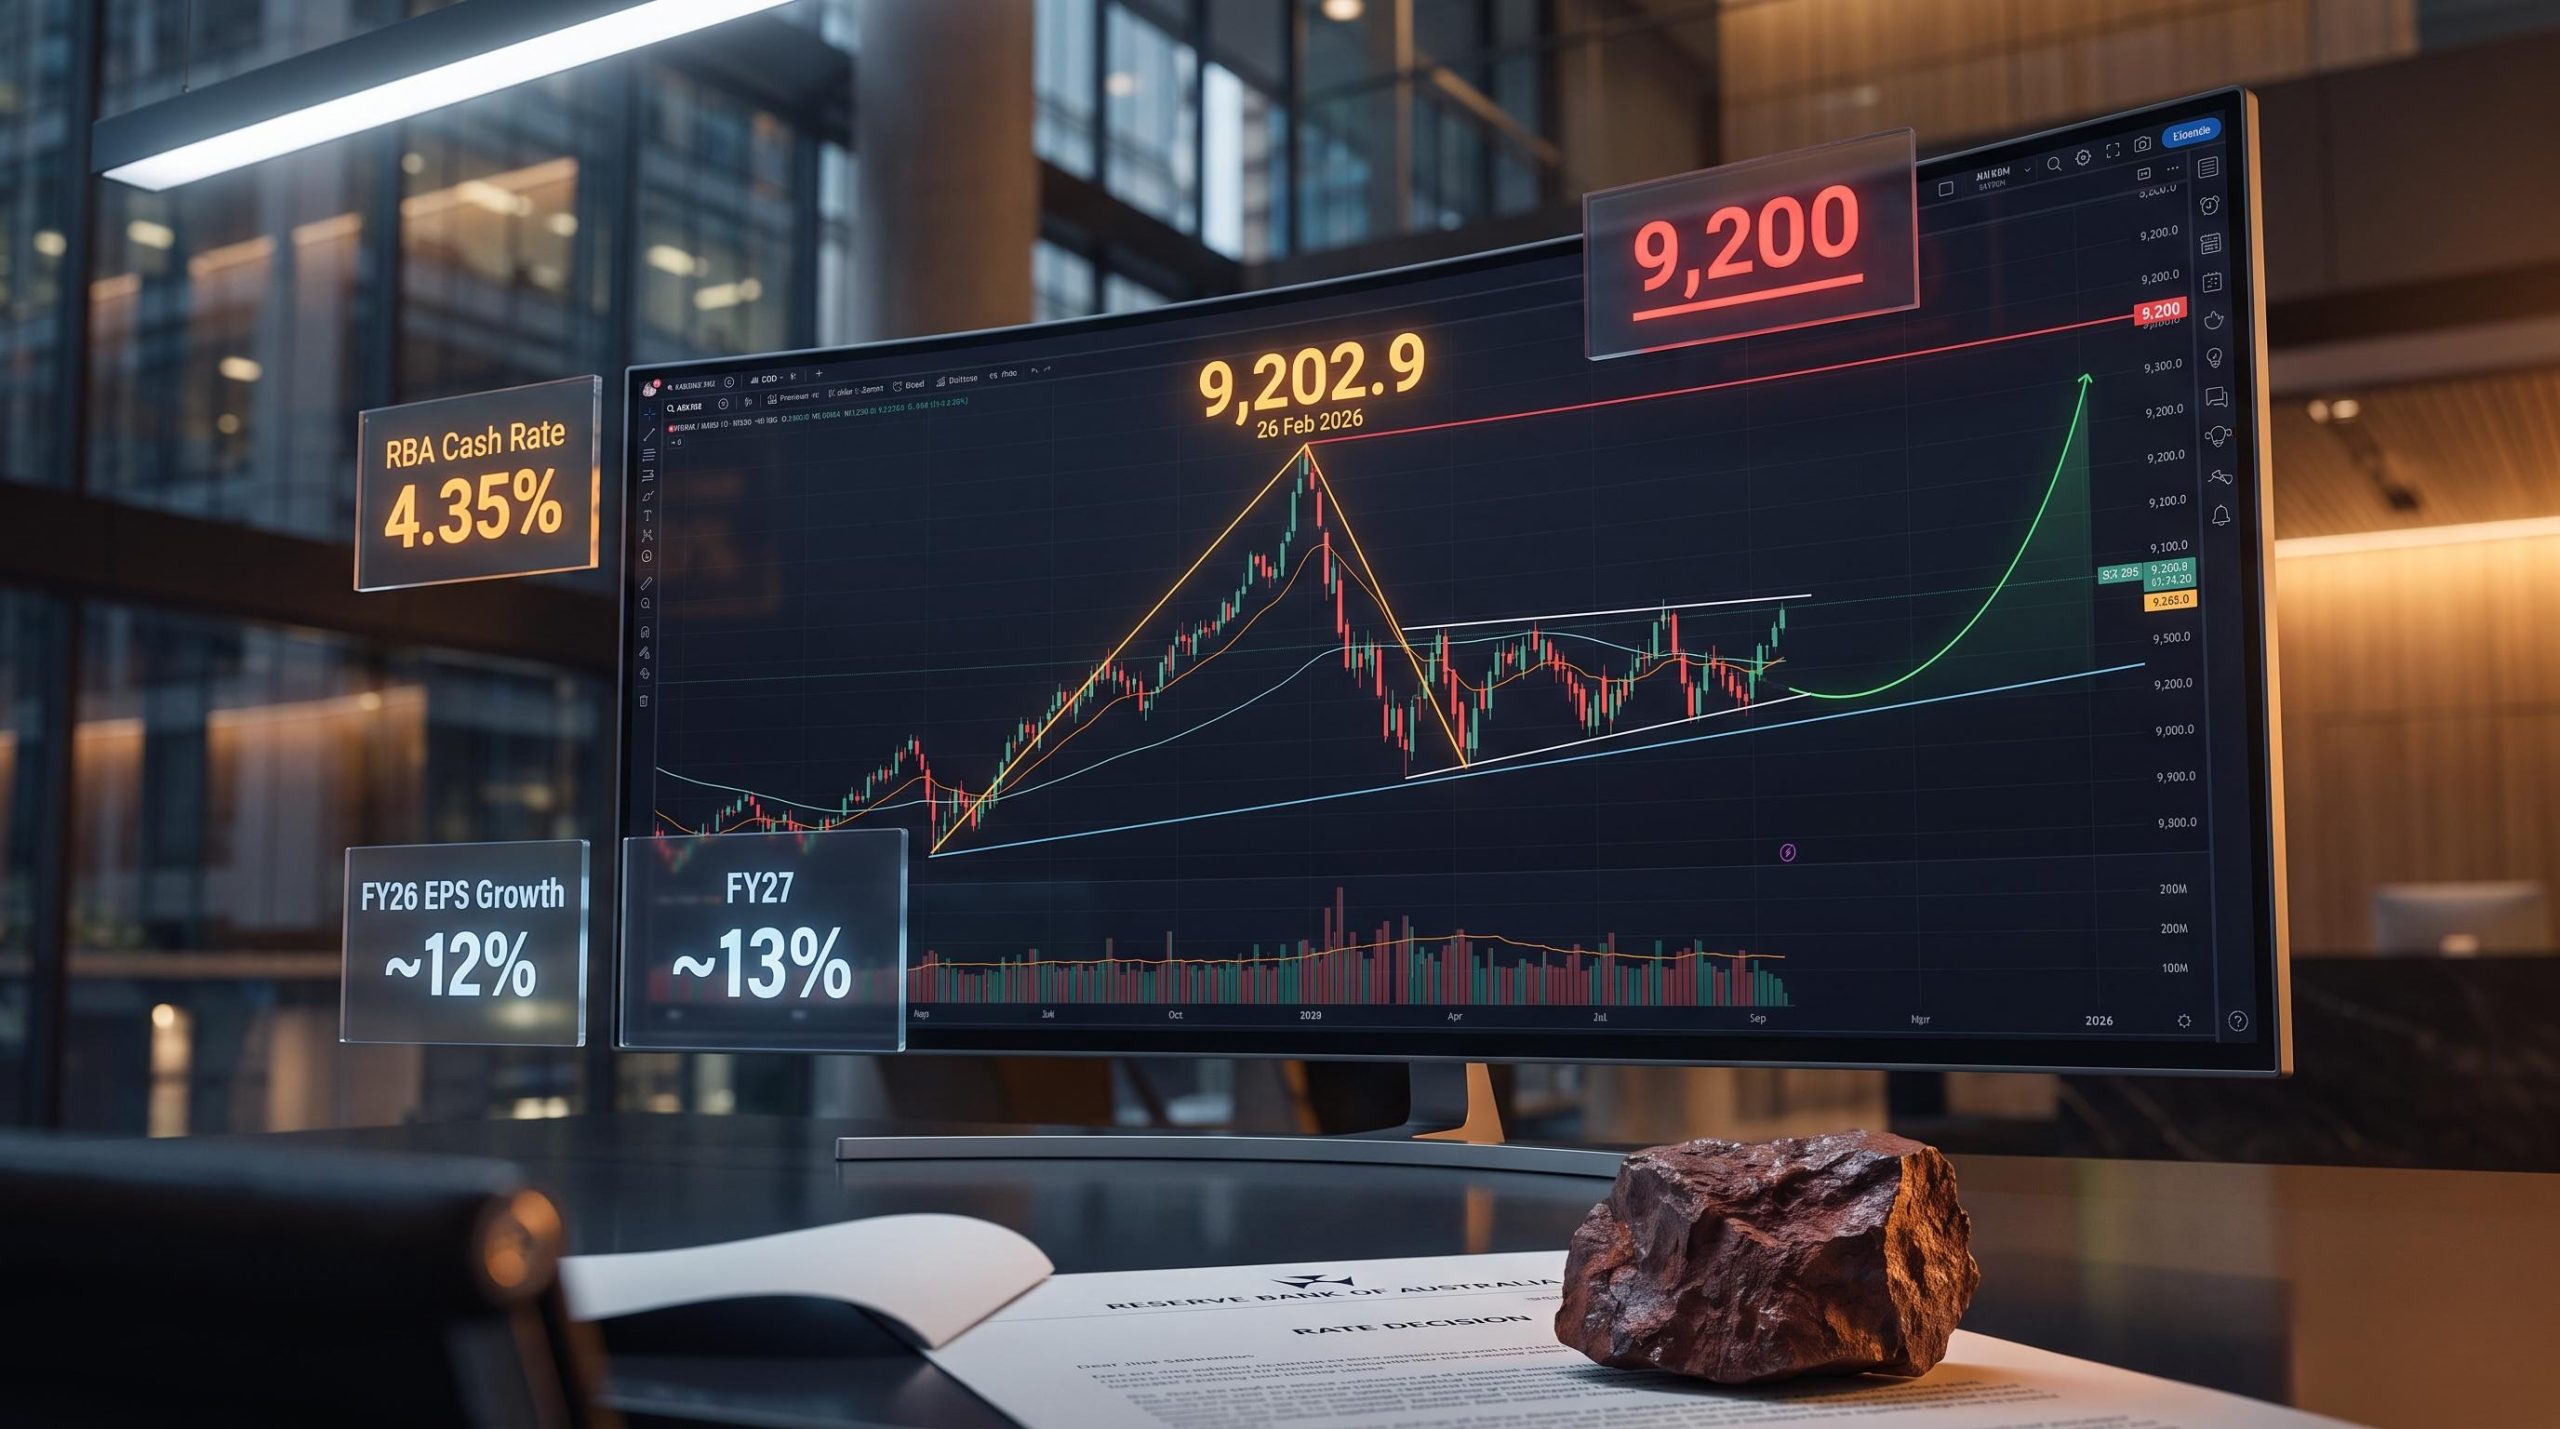
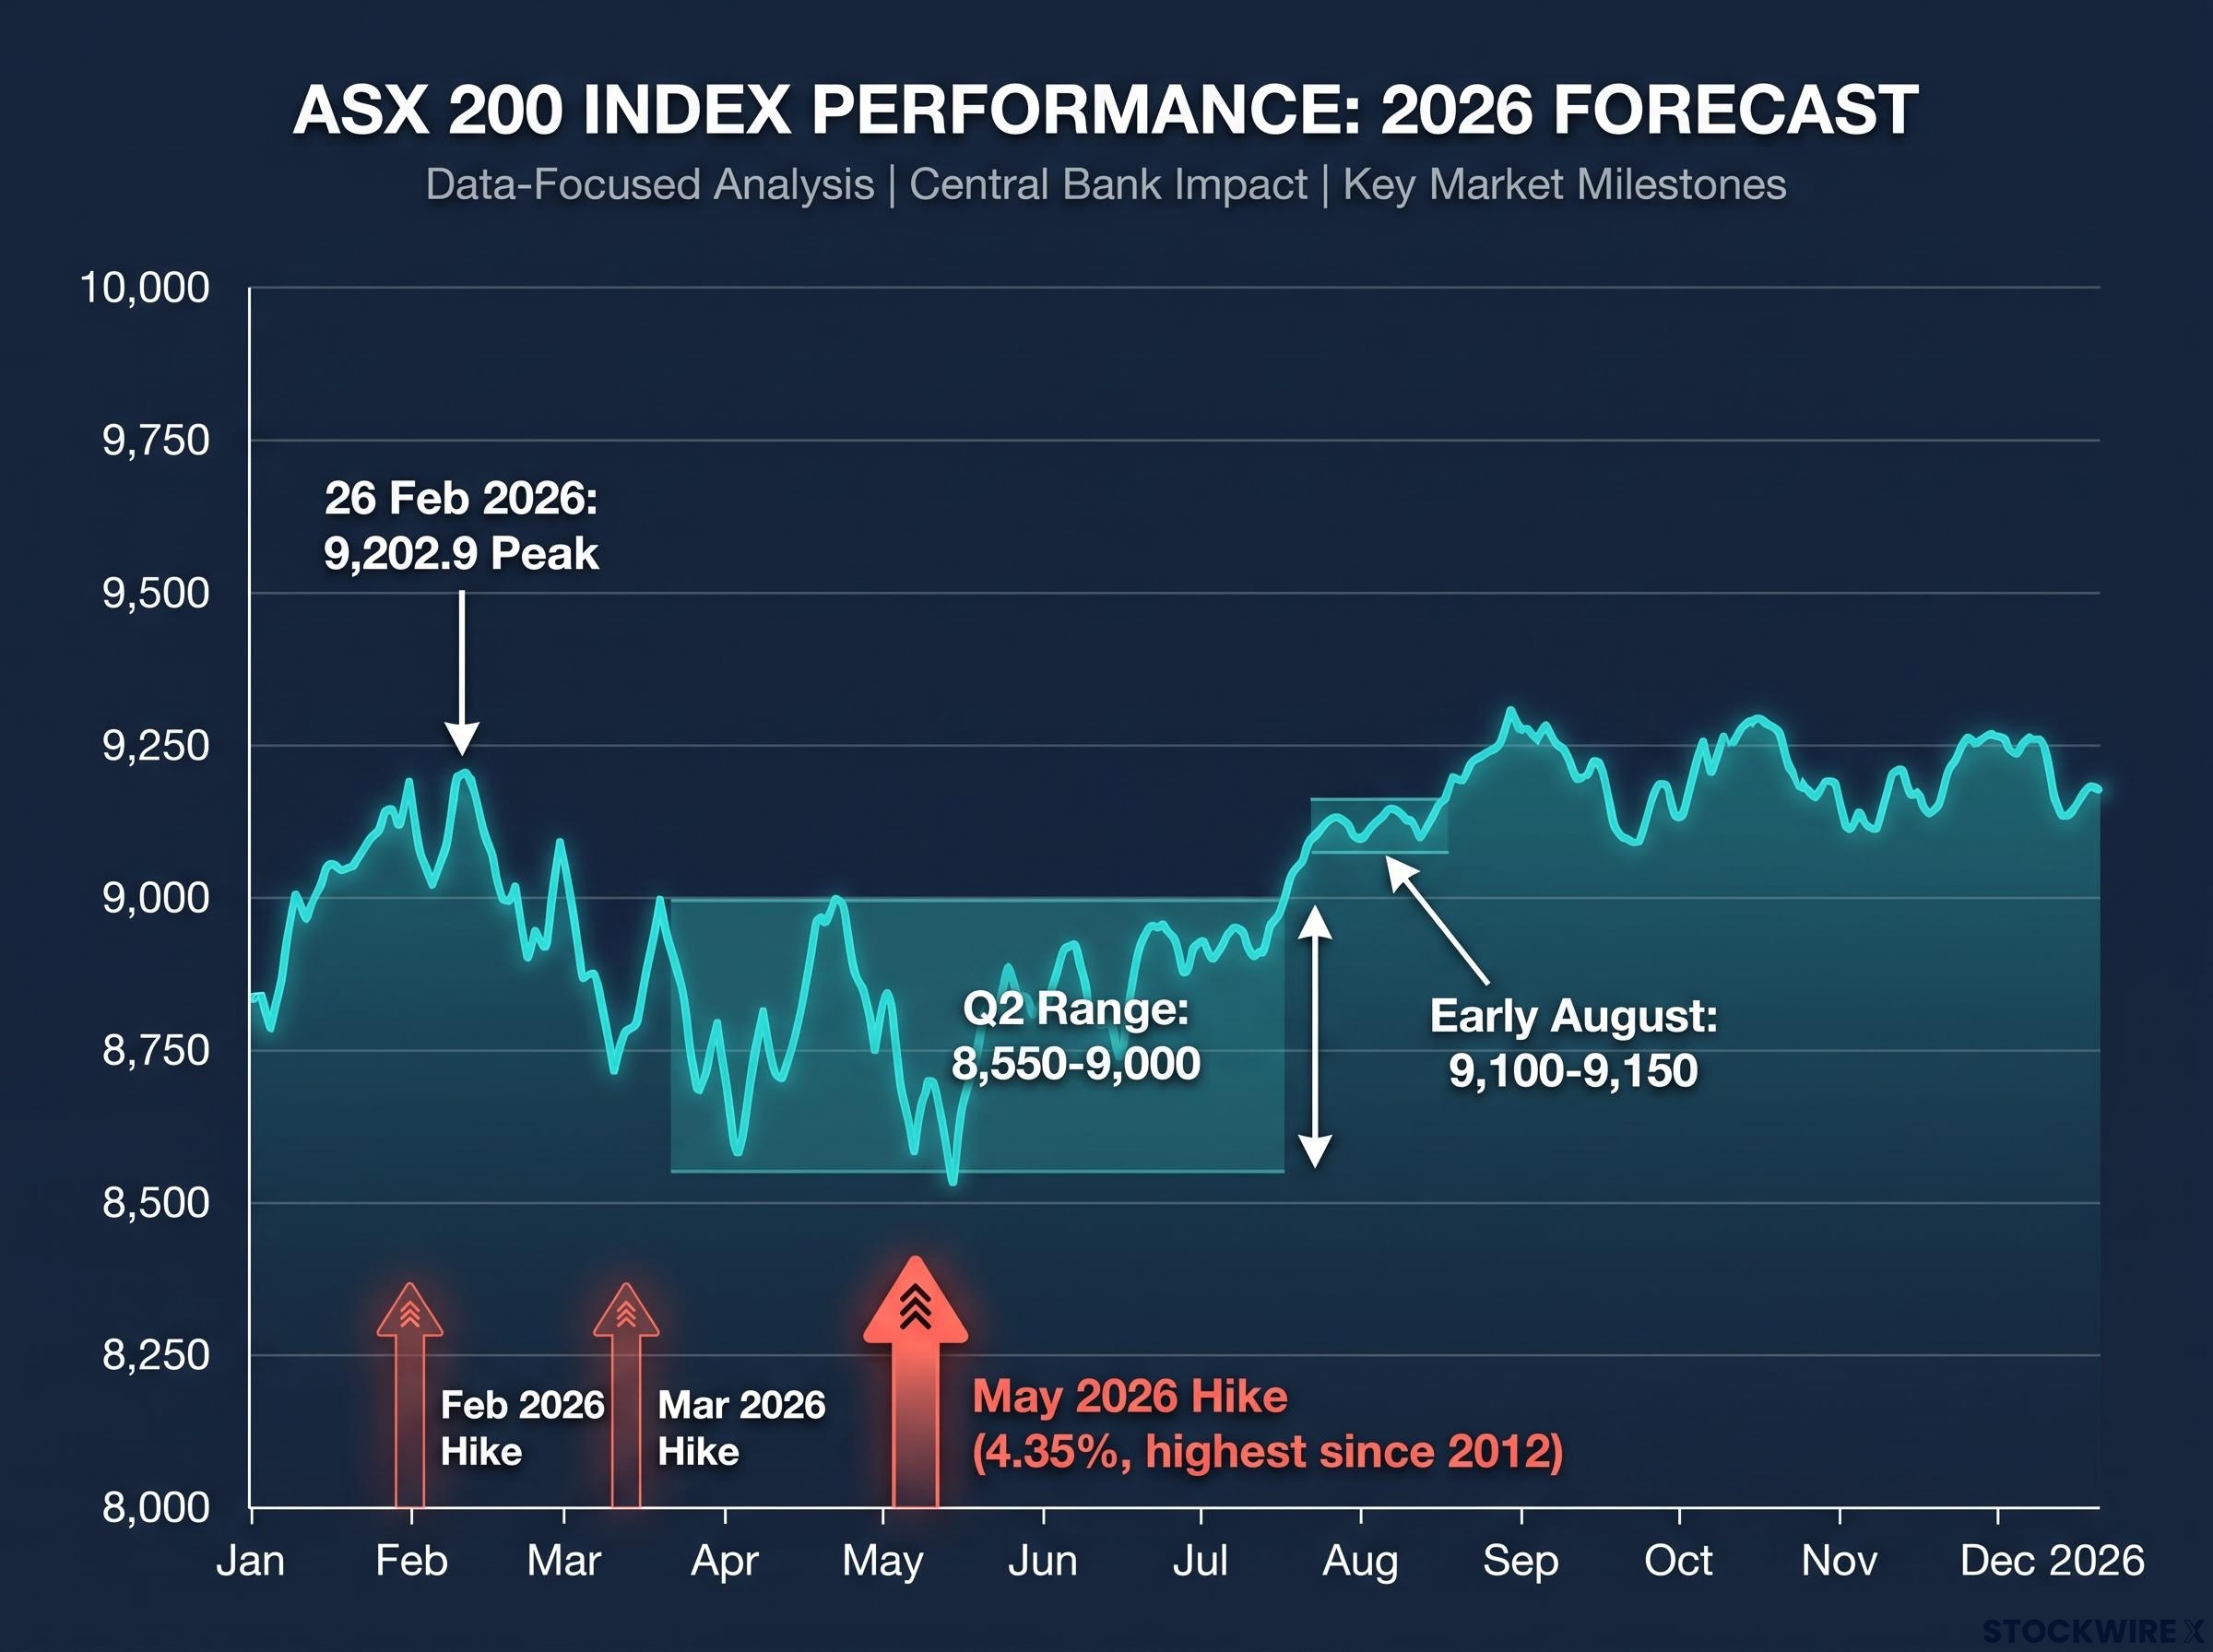
The ASX 200 hit 9,202.9 on 26 February 2026, a number that mattered because it capped a breakout from nearly a year of sideways drift. Within weeks, it became a ceiling the market could not clear again.
Three RBA rate hikes in four months pushed the index into a Q2 trading range of roughly 8,550-9,000. By early August it had recovered to approximately 9,100-9,150, sitting close enough to the record that the question of whether a fresh breakout is coming is now live. Understanding why the February high happened, and why reclaiming it has proven harder than expected, requires working through the specific earnings, rate, commodity, and global forces that were operating simultaneously.
Here is a clear read on which forces built the February record, which forces dismantled it, and what conditions would need to align for the index to push convincingly through 9,200 again. This is analytical grounding, not a prediction.
How the ASX 200 broke to an all-time high in February 2026
ASX 200 all-time intraday high: 9,202.9, set on 26 February 2026.
The record did not arrive out of nowhere. The index had spent roughly a year trading sideways before momentum began building in the second half of 2025, particularly in materials and financials. By the time February’s reporting season delivered its results, the conditions for a breakout were already in place. The earnings were the catalyst, not the cause.
What made the February move convincing was its breadth. The key contributors tell the story:
- BHP traded at record levels around the February peak, confirming the materials sector was firing
- NAB and Westpac both printed record highs in the same period, giving the financials sector genuine weight in the move
- Energy and consumer staples stocks delivered solid reporting season results, widening the rally beyond just two sectors
- Post-February, some strategists lifted their ASX 200 index targets into the 9,400-9,500 range
That breadth matters. When miners, banks, energy, and consumer staples are all moving together on the back of earnings delivery, the breakout has conviction behind it. It was not a single-stock story or a momentum-only push. Which is exactly what makes the subsequent reversal so striking.
When big ASX news breaks, our subscribers know first
What consensus earnings forecasts were telling the market
The earnings picture in February gave investors a reason to pay higher prices. At that time, market forecasts pointed to approximately 12% EPS growth in FY26 and 13% in FY27 for the ASX 200, with Materials as the primary engine of that expansion and Financials contributing meaningfully alongside it.
| Metric | Value | Attribution |
|---|---|---|
| FY26 consensus EPS growth | Approximately 12% | Kerry Sun, Market Index (5 August 2026); should be independently verified |
| FY27 consensus EPS growth | Approximately 13% | Kerry Sun, Market Index (5 August 2026); should be independently verified |
| Primary driving sector | Materials | Consistent across multiple sources |
| Strategist price targets | 9,400-9,500 | Post-February strategist revisions |
When double-digit earnings growth looks credible, it does two things for equity prices. It justifies the valuations the market is already trading at, and it creates room for further multiple expansion if the growth is delivered. That is the scaffolding under the index targets that were being lifted into the 9,400-9,500 range after February.
For a reader watching the index hover near 9,100 in early August, those projections are not historical curiosities. They represent the fundamental justification for the market trading above 9,000 at all. If earnings delivery disappoints or forecasts are cut during the upcoming reporting season, the valuation case for the current level softens.
The earnings sentiment divergence entering August 2026 is striking: the same 12% EPS growth forecast that underpins current valuations sits alongside investor sentiment readings at the 95th percentile of all historical survey observations, with the bull-bear spread swinging from positive 5.8 to negative 21.5 percentage points in a single week.
Why the RBA became the market’s biggest obstacle
The same month the ASX 200 set its all-time high, the Reserve Bank of Australia began the tightening cycle that would cap it. The timing was not coincidental; it was the central tension of the first half of 2026.
The inflation backdrop that justified the tightening sequence was itself concentrated: headline CPI surged to 4.6% in March 2026, nearly double the top of the RBA’s 2-3% target band, while trimmed mean held at 3.3%, suggesting volatile energy prices were amplifying the headline rather than a broad deterioration in underlying price pressures.
The sequence was rapid:
- February 2026: First rate hike, coinciding with the index’s record run
- March 2026: Second consecutive hike, momentum already fading
- May 2026: Third hike in four months, pushing the cash rate to 4.35%, the highest since 2012
That three-hike sequence converted the February breakout into a Q2 trading range of roughly 8,550-9,000. The index gave back much of the February gains and spent the better part of three months stuck below 9,000.
What higher rates do to equity valuations
The mechanism is direct. Higher interest rates raise the risk-free rate, which is the baseline return available from government bonds. When that baseline climbs, the hurdle rate for equities rises with it. Investors demand more return from shares to justify the additional risk, which compresses the price-to-earnings multiples they are willing to pay.
This is why a market can face simultaneous positive earnings growth and a falling index. If the multiple contraction from rising rates outpaces the earnings expansion, the index goes down even while companies are reporting better profits.
As of 5 August 2026, the cash rate remains at 4.35%. The next RBA decision is scheduled for 11 August 2026. For anyone watching the index recover toward 9,100-9,150, that date is not background noise. It is the single most immediate catalyst that could either validate the recovery or reassert the ceiling that has held since February.
The global forces that built the floor under Australian equities
The RBA story explains why the index stopped going up. It does not explain why it stopped going down. The floor under Australian equities through Q2 came from offshore.
Several global macro inputs were operating as supporting forces, even as domestic rates were tightening:
- Global AI and infrastructure investment: The AI theme lifted equity markets broadly through early 2026 and into May, providing a supportive risk-appetite backdrop that partially offset domestic rate headwinds
- Lower oil prices: Falling oil eases headline inflation (which reduces pressure on central banks to keep hiking) and improves margins for energy-intensive sectors and consumer discretionary spending
- US corporate earnings health: According to Kerry Sun at Market Index, a strong US earnings season supported global risk-on sentiment, though the specific contribution has not been independently detailed
- July 2026 tech and AI positioning reset: The same source reports that technology and AI-related equity markets sold off during July, unwinding elevated positioning that had built up in those names and potentially clearing the way for further gains. This has not been independently confirmed in available research.
The oil price channel is worth isolating. Lower oil prices work through two pathways simultaneously: they ease headline CPI, which reduces the case for further rate hikes, and they improve margins for companies with high energy input costs. Both pathways are constructive for equities.
The global support picture tells you why the RBA-driven selloff had a floor. When global risk appetite is constructive and US corporate earnings are healthy, Australian equities benefit from inflows and sentiment that partially offset domestic headwinds. The ASX 200 does not move on domestic conditions alone, and the Q2 floor proves it.
What history says about investing when an index is near its peak
The ASX 200 sits approximately 50-100 points below its all-time high. For many investors, that proximity to a record triggers a specific instinct: wait for a pullback before putting money to work. The long-run evidence challenges that instinct.
Research from Dimensional Fund Advisors and broader academic and asset-allocation literature has consistently found that returns following an all-time high tend to be somewhat softer in the near term but compare favourably to returns from any other entry point when measured over a twelve-month horizon. The finding holds when measured over long horizons and across multiple market cycles.
Dimensional Fund Advisors research on all-time high returns finds that record-high entry points have not, on average, produced materially worse twelve-month outcomes than any other entry point, a finding that holds across multiple market cycles and challenges the instinct to defer investment while waiting for a drawdown.
The mechanism is straightforward. Markets spend a large proportion of time at or near all-time highs during secular bull markets. Systematically avoiding those periods means sustained underinvestment during extended growth phases, and that underinvestment carries a documented opportunity cost.
Cash drag compounds the problem: UBS survey data shows investors holding approximately 22% of total assets in cash equivalents even as indices approach record territory, and at 3% average annual inflation, the real purchasing power loss on idle capital is material over a 10-30 year horizon regardless of what the index does in any single quarter.
Applying the historical pattern to the current ASX 200 level
The current situation is precisely the kind of near-peak context this evidence addresses. The index recovered from a 10-11% Q2 drawdown and now sits just below the February record. Deferring investment in the hope of a more substantial drawdown may feel like the cautious approach, but the long-run data shows it has not, on average, delivered meaningfully better entry points.
Two caveats matter here. The finding assumes the investor has a long time horizon; short-term volatility around record levels remains real. And the 2026 rate environment adds a specific risk variable, a cash rate at 4.35% with genuinely uncertain direction, that the long-run average does not eliminate. The historical evidence does not tell you to buy now. It tells you that near-peak discomfort is a known psychological bias with a documented cost.
Whether the conditions for a new ASX 200 record are in place
The gap between the current level of approximately 9,100-9,150 and the February all-time high of 9,202.9 is not large in index terms. But the conditions required to close it are specific, and several remain unresolved.
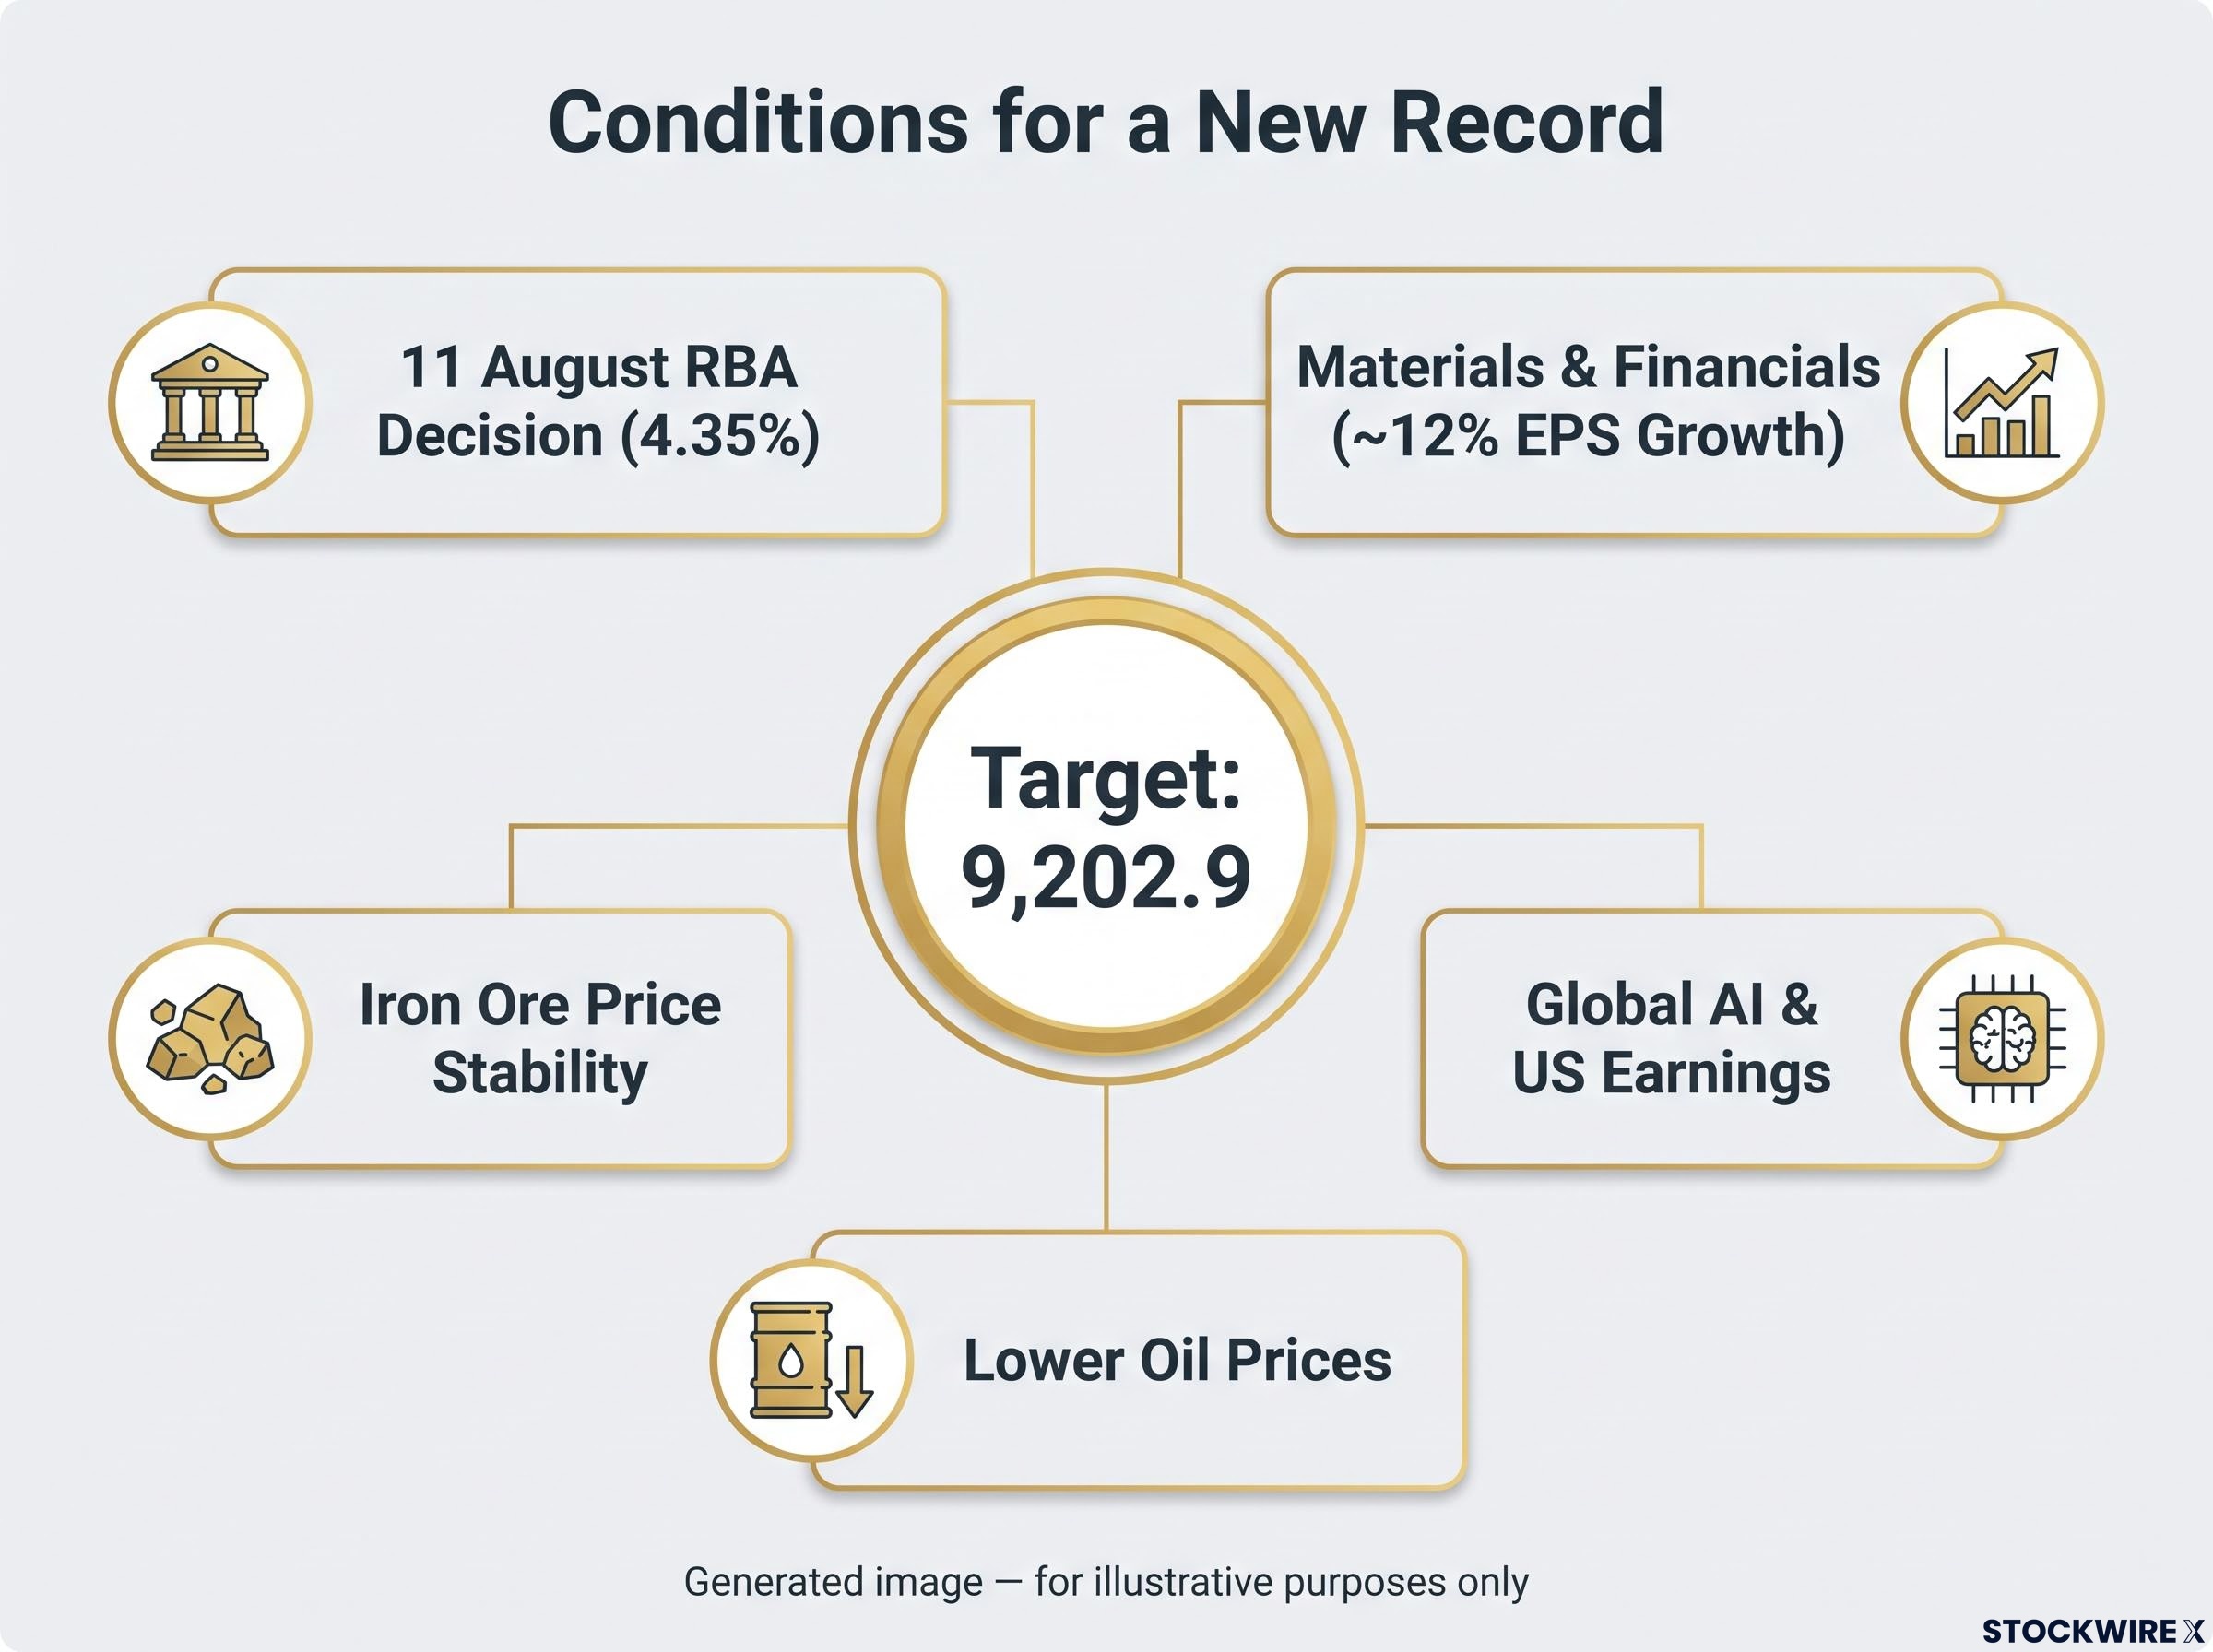
| Variable | Current status | Implication for new record |
|---|---|---|
| RBA rate decision (11 August) | Cash rate at 4.35%; hold, hike, or dovish language all possible | A hold or end-of-cycle signal removes the most significant ceiling; a hike likely reasserts the 8,550-9,000 range |
| Earnings delivery (Materials, Financials) | FY26 reporting season approaching | Confirmation of ~12% EPS growth validates current valuations; misses would soften the case for 9,000+ |
| Commodity prices (iron ore) | Volatile through mid-2026 | Stability supports the materials earnings outlook; further weakness undermines the primary EPS growth driver |
| Global AI and US earnings sentiment | Currently constructive | Sustained enthusiasm supports risk appetite and inflows; a shift would remove the floor that held through Q2 |
| Oil prices | Trending lower | Eases inflation pressure and supports consumer margins; a reversal would complicate the rate outlook |
No single variable is sufficient on its own. The RBA decision on 11 August is the most proximate binary event. The earnings delivery case depends on whether Materials and Financials can confirm the FY26 and FY27 growth projections during the upcoming reporting season, with iron ore stability as the key variable on the materials side. Global inputs, including AI investment sentiment, US earnings health, and oil prices, are currently constructive but not guaranteed to remain so.
The roughly 50-100 point gap looks modest. The conditions required to close it are not. The current recovery is promising but contingent.
For investors wanting a sector-by-sector framework for tracking results as they land, our full explainer on August 2026 ASX earnings season maps which bank result dates, guidance signals, and macro calendar events carry the most share price impact given the thin 80 basis point equity risk premium.
What the February record and the recovery tell you about reading this market
The 2026 ASX 200 story is a specific case study in how a genuine earnings-driven breakout, one with sector breadth, double-digit growth projections, and global tailwinds behind it, can be stalled by a single domestic policy variable. Three RBA hikes in four months overrode all of it.
The path back to and beyond 9,202.9 requires a combination of rate normalisation (or at minimum a credible end-of-cycle signal from the RBA), earnings delivery from Materials and Financials confirming the approximately 12% FY26 and 13% FY27 growth projections attributed to Kerry Sun at Market Index, and sustained global risk appetite. None of those conditions is individually sufficient.
What to monitor between now and the end of the FY26 reporting season: the 11 August RBA decision and any accompanying language on the tightening cycle; iron ore price stability as the leading indicator for materials earnings; and whether US earnings and AI sentiment hold their current constructive tone.
The February record was structurally sound. Reclaiming it is conditional. Understanding the difference between those two statements is what separates a reactive investor from an informed one.
This article is for informational purposes only and should not be considered financial advice. Investors should conduct their own research and consult with financial professionals before making investment decisions. Past performance does not guarantee future results. Earnings projections cited in this article are subject to market conditions and various risk factors, and specific EPS growth figures should be independently verified before relying on them as standalone data points.