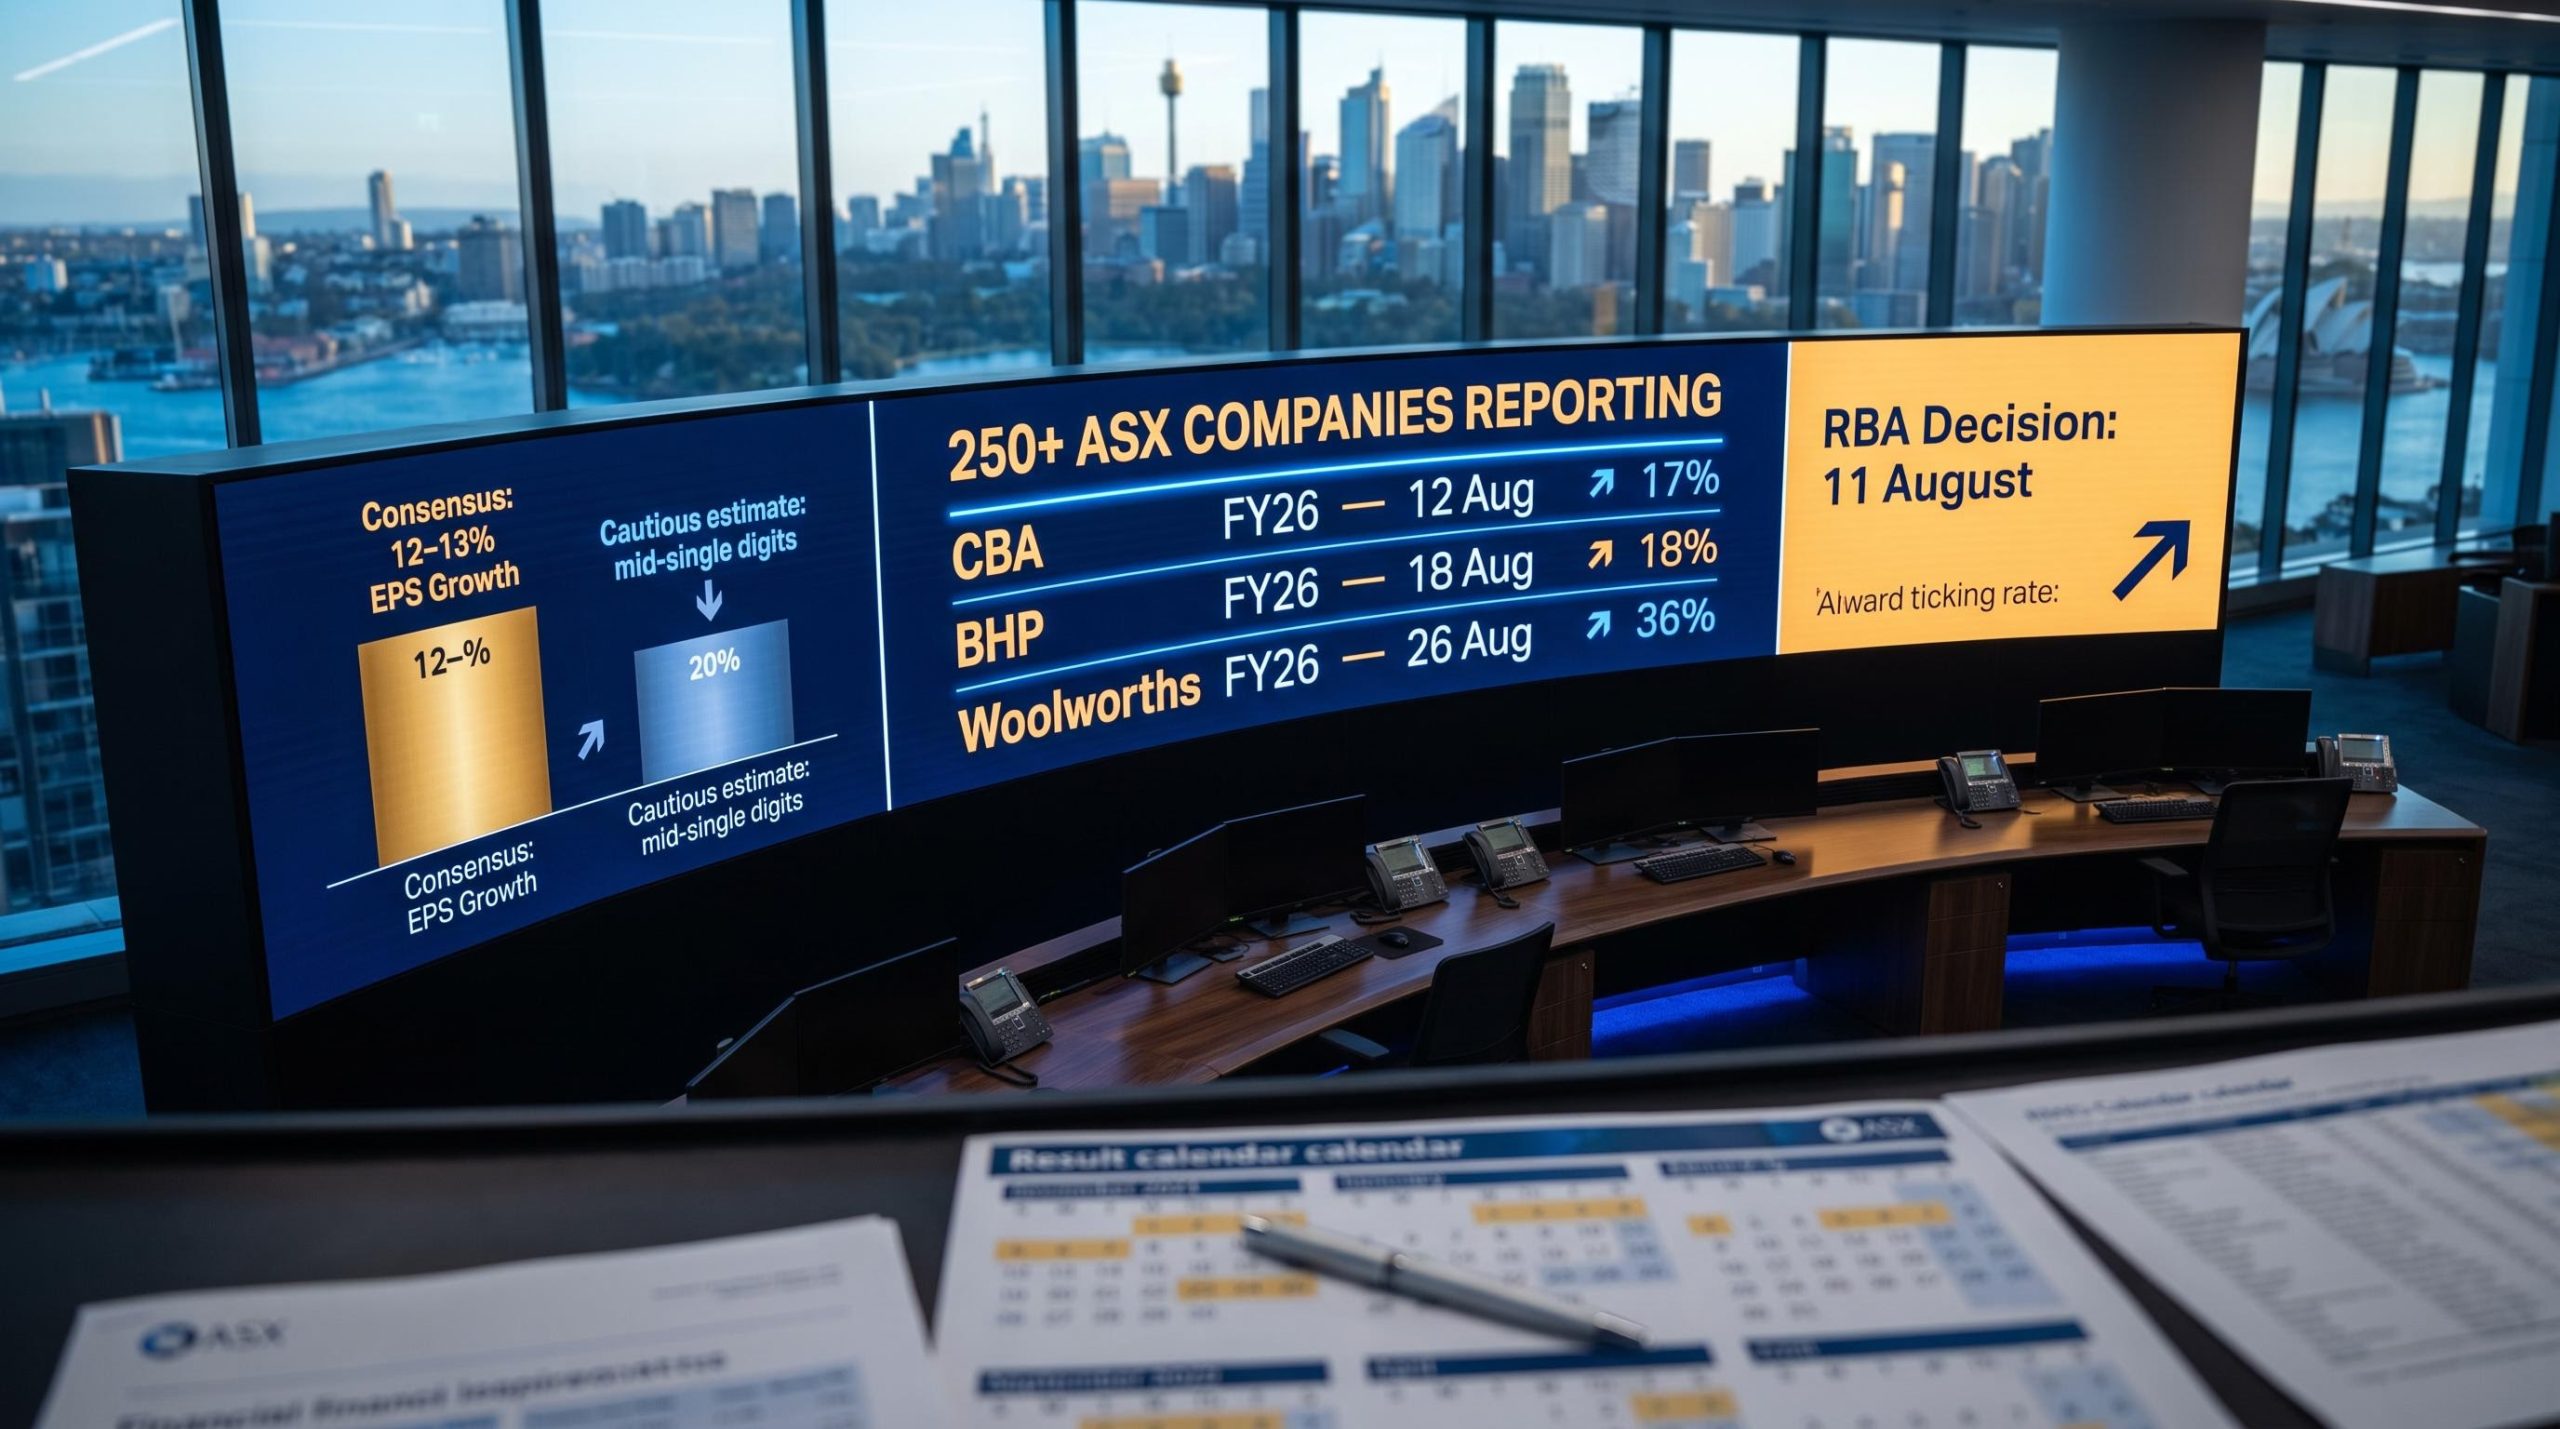
More than 250 ASX companies will deliver full-year results this August, and the consensus view says earnings grew 12-13% in FY26. The cautious view, from strategists who have watched three RBA rate rises land since February, says mid-single digits is closer to reality. That gap between optimism and evidence is where the real story of this reporting season sits.
This is not a routine August. FY26 captures a full 12 months under elevated rates and cost-of-living pressure, making it the first complete ledger on whether corporate Australia absorbed the rate shock or is beginning to crack under it. A possible fourth rate rise on 11 August lands in the same fortnight as the major bank results.
Here is a sector-by-sector framework for reading the season as it unfolds: the specific numbers to interrogate, the guidance signals that will actually move share prices, and the macro calendar events that could reprice strong results before the ink dries. Think of this as your preparation map before the first announcement drops.
What the August reporting window actually represents
August is the main full-year reporting window for ASX-listed companies. Most release results for the financial year ended 30 June 2026, making this the single most concentrated period of corporate disclosure on the Australian calendar. More than 250 companies report during the month, with the heaviest cluster falling in weeks two through four.
What makes this season structurally different is the rate environment it captures. FY26 is the first complete financial year where higher interest rates were present for the entire 12 months, not just a portion. Three RBA rate rises have landed since February 2026 (in February, March, and May), and a fourth is possible at the 11 August meeting. Every result you read this month reflects the full cumulative weight of that tightening.
The consensus expects approximately 12-13% year-on-year earnings per share (EPS) growth for the ASX 200. More cautious strategist estimates sit at mid-single digits. That divergence tells you the market may be pricing in an optimism that reported numbers could swiftly revise downward, which means you should weight forward guidance over backward-looking headline beats when assessing individual results.
The earnings forecast disconnect heading into August is particularly acute this year: the 12% headline growth figure is heavily sourced from Mining and Financials, and stripping both sectors out narrows the ex-sector growth rate to approximately 2.5%, which reframes the beat-or-miss stakes for portfolios weighted toward industrials, healthcare, or consumer stocks.
Here are the major reporting dates to mark on your calendar:
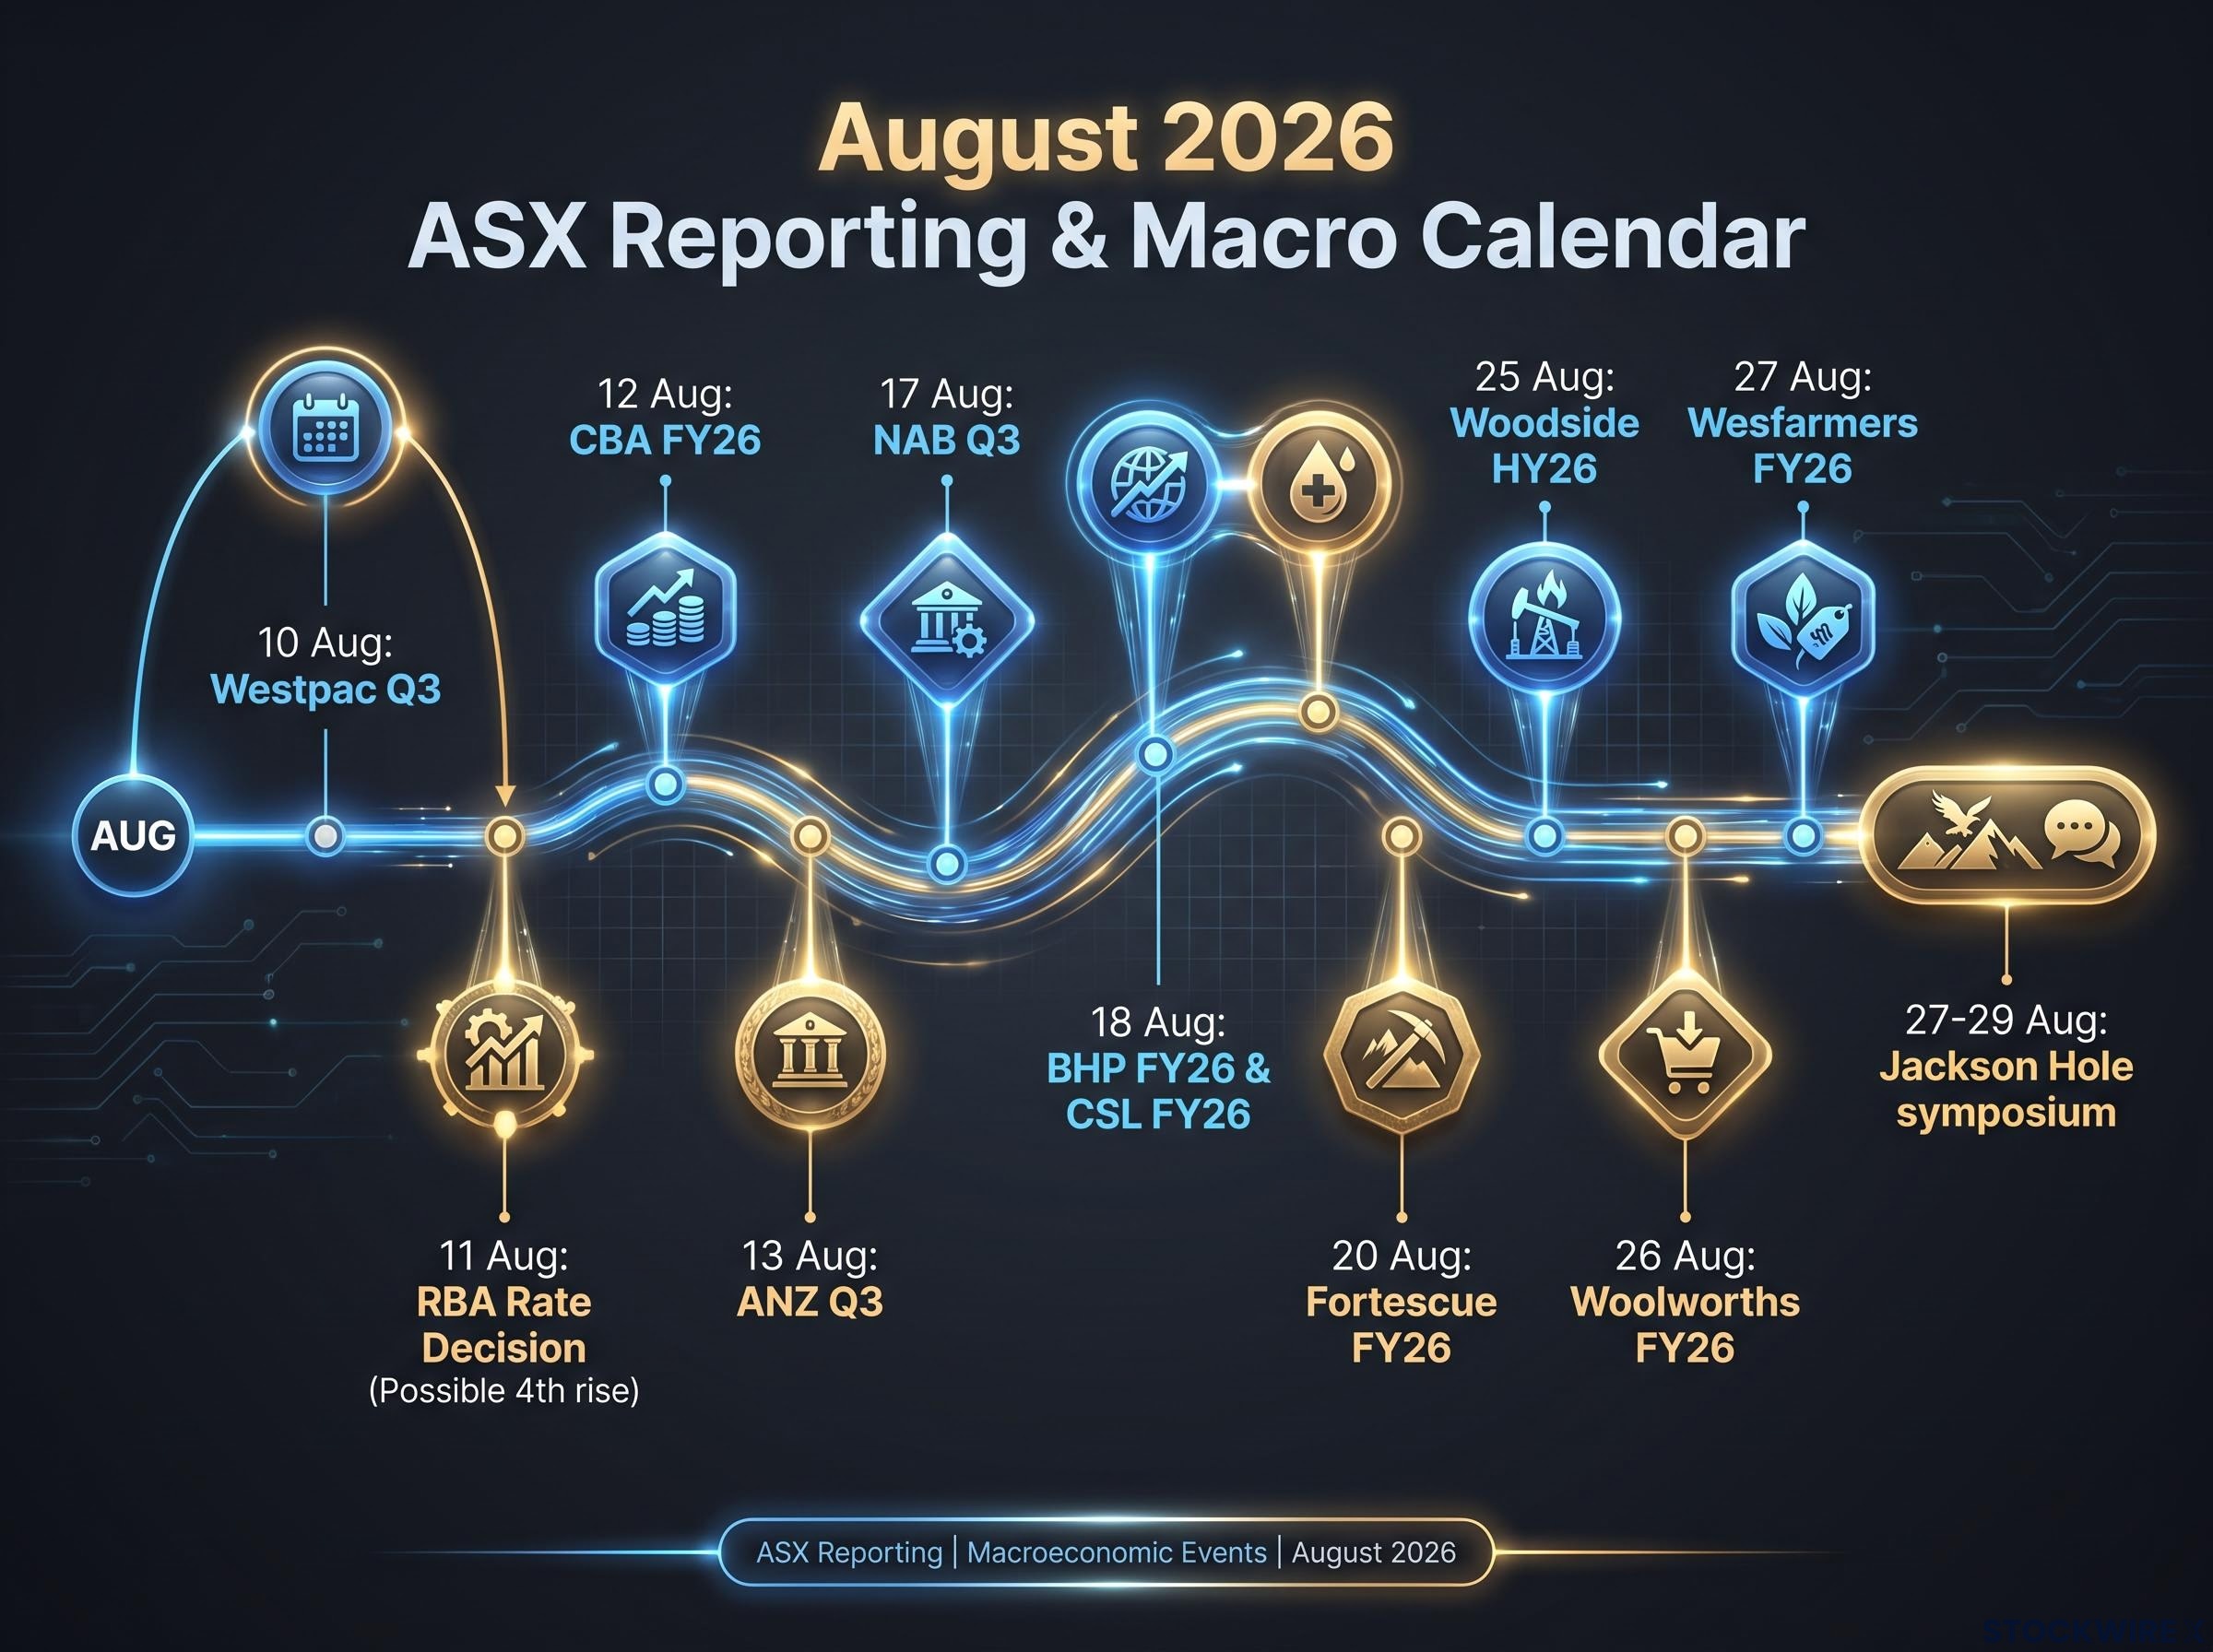
- Banks: Westpac Q3 (10 Aug), CBA FY26 (12 Aug), ANZ Q3 (13 Aug), NAB Q3 (17 Aug)
- Resources and energy: BHP FY26 (18 Aug), Fortescue FY26 (20 Aug), Woodside HY26 (25 Aug)
- Healthcare and infrastructure: CSL FY26 (18 Aug), Cochlear, Sonic Healthcare, Transurban, Goodman Group (week of 17-21 Aug)
- Retail and consumer: Woolworths FY26 (26 Aug), Wesfarmers FY26 (27 Aug), JB Hi-Fi, Super Retail Group, Breville (week of 17-21 Aug)
| Company | Sector | Report date |
|---|---|---|
| Westpac | Banking | 10 Aug |
| CBA | Banking | 12 Aug |
| ANZ | Banking | 13 Aug |
| NAB | Banking | 17 Aug |
| BHP | Resources | 18 Aug |
| CSL | Healthcare | 18 Aug |
| Fortescue | Resources | 20 Aug |
| Woodside | Energy | 25 Aug |
| Woolworths | Retail | 26 Aug |
| Wesfarmers | Retail | 27 Aug |
Rio Tinto’s HY26 result, released in late July 2026, has already set the early tone for the mining sector ahead of the main season.
When big ASX news breaks, our subscribers know first
Banking results as the rate-shock barometer
Banks sit at the intersection of household finances, mortgage stress, and business credit conditions. That makes their August results the clearest single window into whether the rate shock has moved from theoretical pressure to realised credit stress across the economy.
The early dynamics favoured the banks. Wider net interest margins (NIMs), the gap between what banks charge borrowers and pay depositors, boosted profitability in the first half of FY26. By August, that dynamic is expected to have shifted. Competitive pressure for deposits and customers moving savings into higher-yield products are compressing those margins, and the key question is whether the rate environment is still net-positive for bank profitability or has peaked.
The real signal from bank results is not the headline profit number. It is whether mortgage arrears, impairment charges, and forward provisions show household stress accelerating or holding steady. Any uptick from CBA or Westpac is not just a bank-specific metric; it tells you rate pressure has crossed from balance-sheet resilience into realised household stress, which matters for every domestic-facing stock in your portfolio.
Here are the specific line items to interrogate in every bank result:
Translating those line items into a structured view of whether a bank is creating or destroying value requires a grasp of the bank valuation metrics that analysts apply: net interest margin for earnings quality, return on equity relative to the cost of equity, and CET1 for capital efficiency, each of which tells a different part of the story behind the headline profit figure.
- Net interest margins: Expanding, stable, or compressing under deposit competition
- Mortgage arrears rates: Whether late payments are rising in frequency or severity
- Loan-loss provisions: Forward-looking reserves for expected credit losses
- Credit growth trajectory: Whether demand for new housing and business lending is slowing
The RBA’s 11 August decision falls in the same fortnight as CBA (12 Aug), ANZ (13 Aug), and NAB (17 Aug). That collision makes bank management commentary on funding costs and household resilience land within days of the RBA’s own assessment, giving you a dual-signal read that neither source provides alone.
In the February 2026 season, banks acknowledged cost-of-living pressure in parts of the customer base. August will show you whether that acknowledgement has deepened into something the numbers can no longer absorb.
What retail and consumer results reveal about real household demand
Banking results tell you about systemic stress. Retail results tell you what people are actually doing at the checkout. This is where macroeconomic theory meets the spending decisions Australians are making week to week.
The first layer to apply to any retail result is the volume-versus-value distinction. In an inflationary environment, a retailer can post higher nominal sales while selling fewer units. Like-for-like growth figures that look healthy on the surface can mask falling volumes underneath. Your job is to separate the two: is the consumer genuinely spending more, or simply paying more for less?
The second layer is margin discipline. Whether gross margins are holding or contracting under discounting and input cost pressure reveals how much pricing power retailers actually retained in FY26. Heavy discounting to clear excess inventory would confirm that demand was overestimated in parts of the year.
Woolworths FY26 (26 Aug) and Wesfarmers FY26 (27 Aug) are the headline retail reports. JB Hi-Fi, Super Retail Group, and Breville are concentrated in the week of 17-21 August. The February 2026 season already showed discretionary retailers under pressure from cost-of-living headwinds while staples and services held up better.
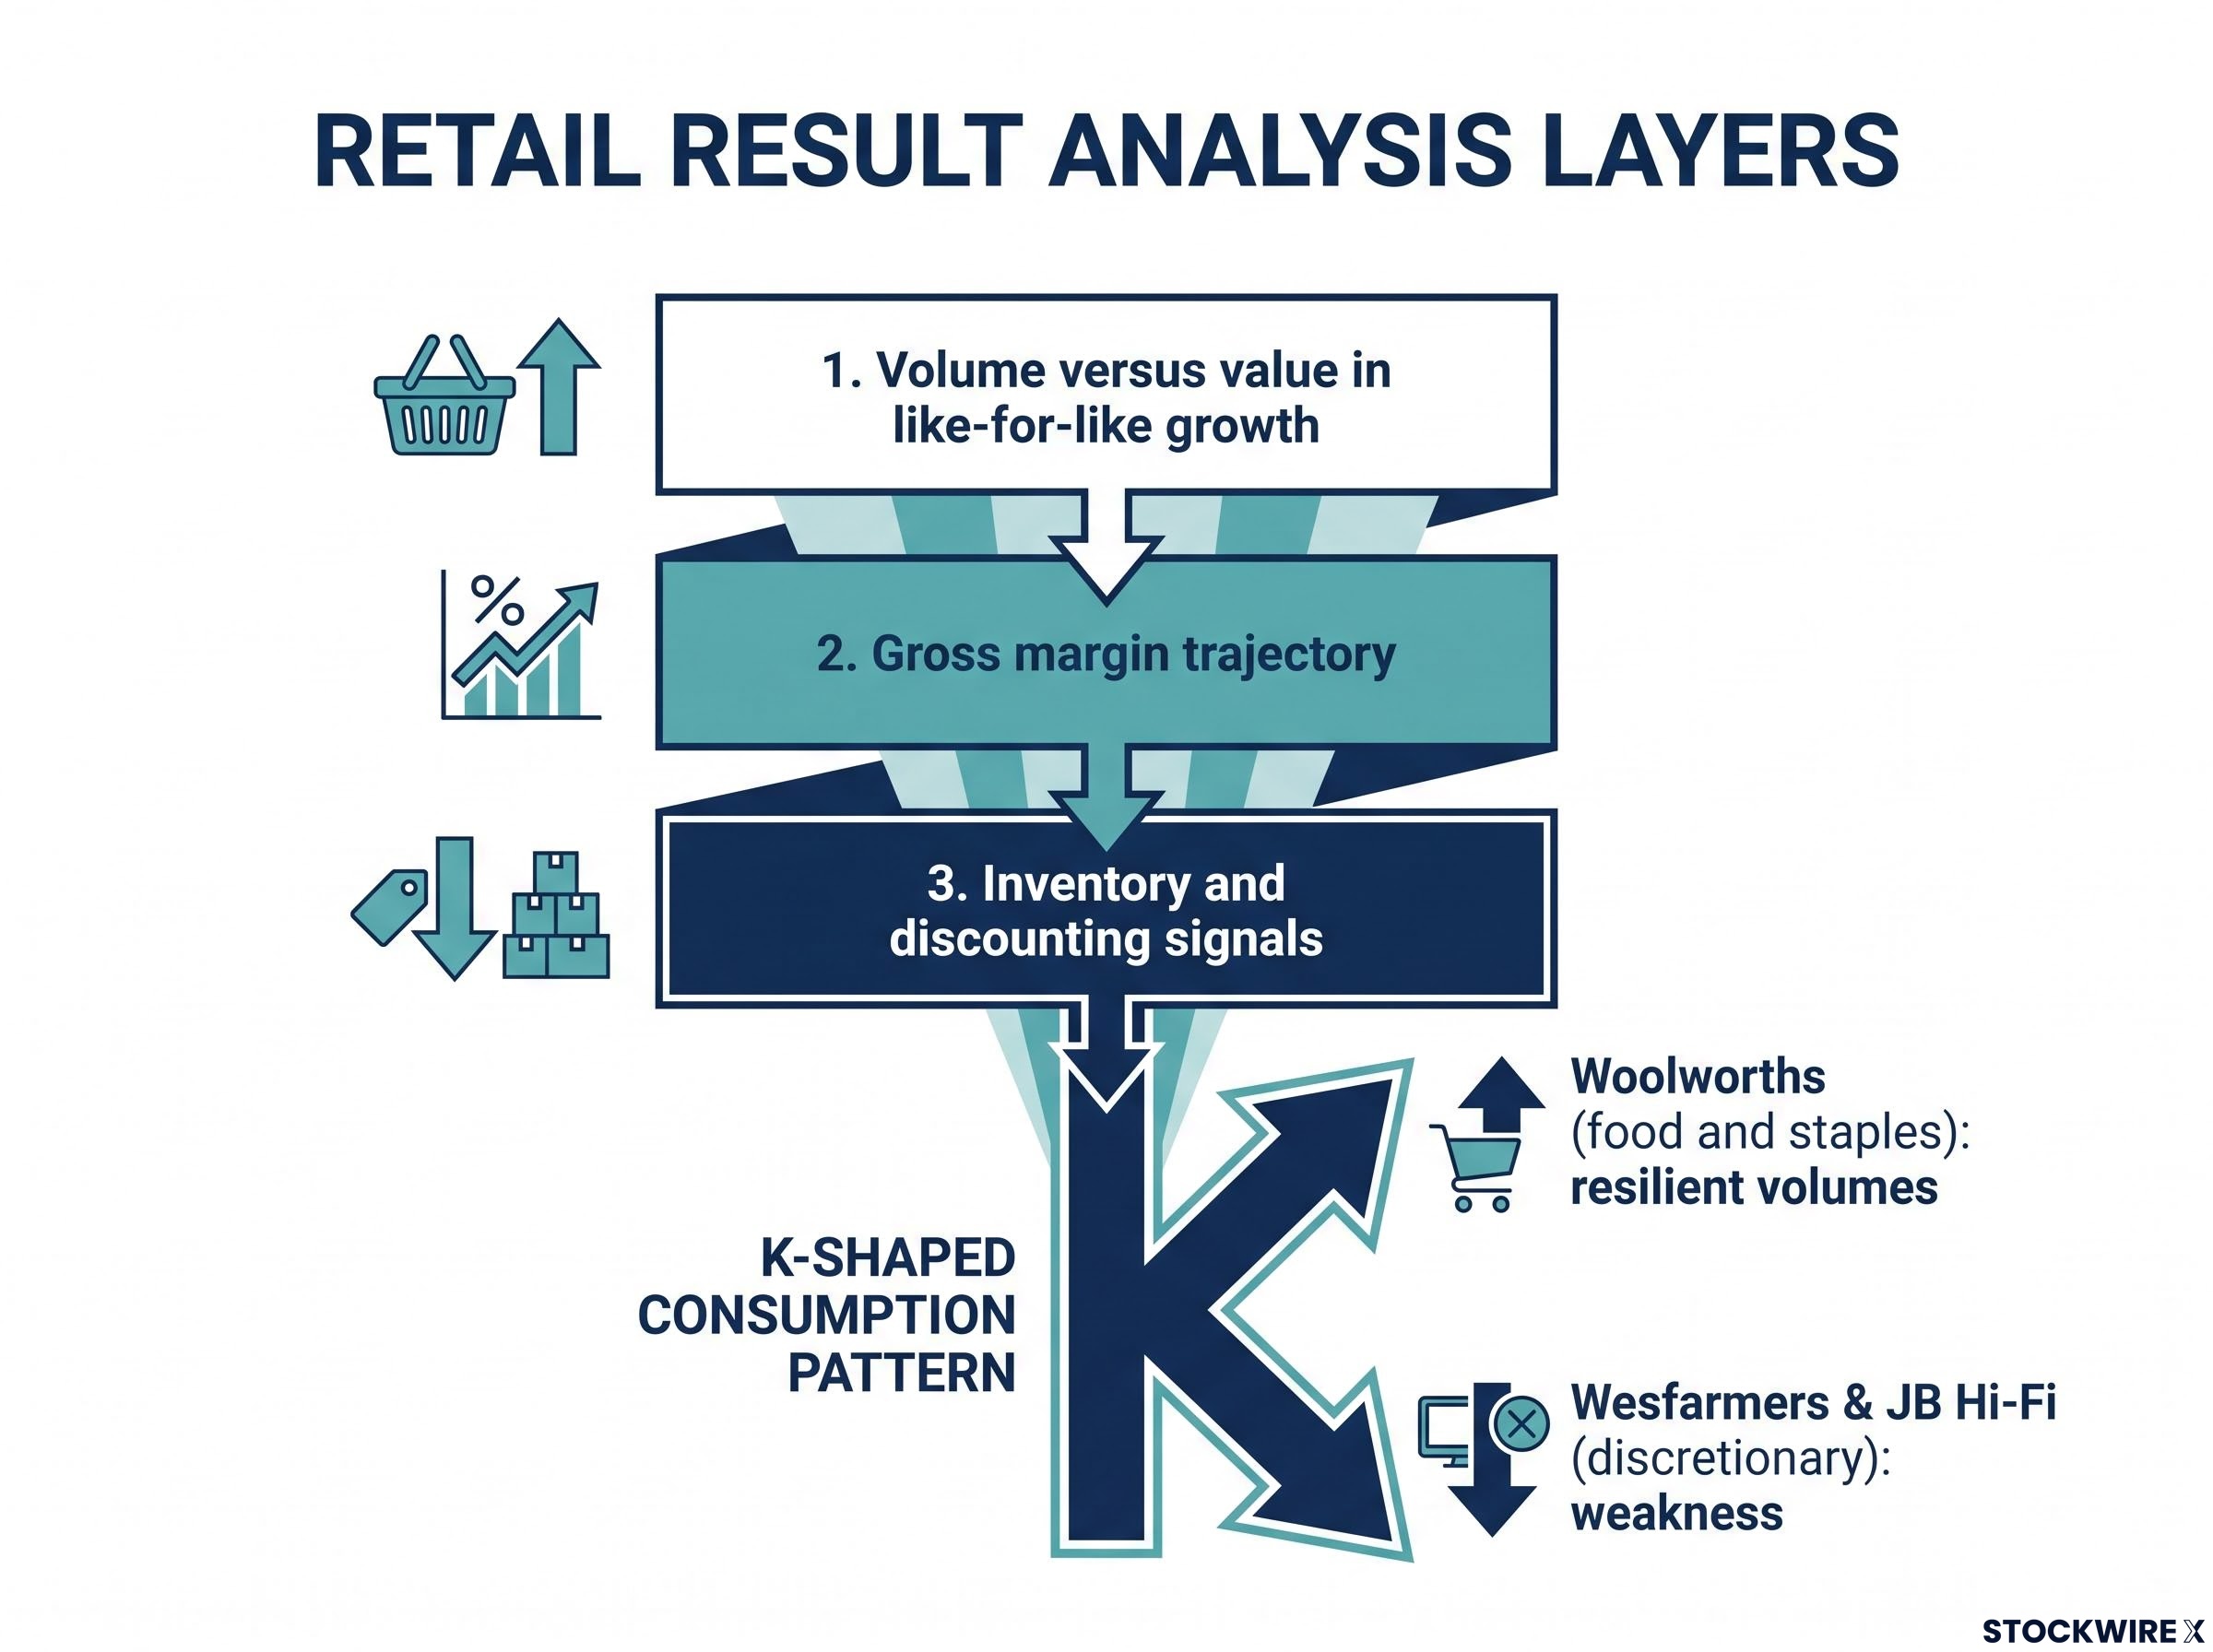
Apply these three analytical layers to every retail result:
- Volume versus value in like-for-like growth: Are unit volumes rising or falling behind nominal sales growth?
- Gross margin trajectory: Are margins holding, compressing, or being propped up by discounting?
- Inventory and discounting signals: Is excess stock being cleared at lower margins, indicating demand was weaker than planned?
The discretionary-staples gap as a portfolio signal
If Woolworths (food and staples) posts resilient volumes while Wesfarmers’ discretionary chains and JB Hi-Fi show weakness, that confirms a K-shaped consumption pattern: essentials protected, non-essentials cut back. A widening gap between staples outperformance and discretionary underperformance is not just a retail sector observation. It is a signal for your broader sector allocation.
A pattern of higher nominal sales but weaker unit volumes at discretionary retailers would confirm that households are cutting back on goods rather than simply paying more for the same basket. If you hold consumer cyclical exposure, August results will tell you whether that positioning still has a basis in evidence, or whether it needs reassessing before FY27 guidance resets expectations.
How to read resources and healthcare results in a rate-sensitive market
Resources and healthcare sit in different corners of the market, but they share a common question this August: do their results justify the valuations they currently carry?
For resources, the analytical framework has three pillars. First, realised prices versus spot prices: FY26 results crystallise the prices BHP, Fortescue, and Woodside actually received for iron ore, energy, and other commodities, which can diverge meaningfully from current spot levels due to contracts and timing. Second, production volumes and unit costs: in a high-rate world, miners are price-takers, so cost discipline is where genuine margin resilience shows up. Third, capital allocation: decisions to maintain or trim growth capex, adjust exploration budgets, or lean more heavily into buybacks and special dividends reveal how confident boards are in medium-term demand.
If resources companies signal caution on China demand or trim growth capex while simultaneously leaning toward buybacks, that tells you boards are prioritising capital return over growth confidence, a more defensive posture than current valuations may imply.
For healthcare and infrastructure names (CSL, Cochlear, Sonic Healthcare, Transurban, Goodman Group), the rate pressure works differently. These sectors have historically enjoyed valuation premiums based on earnings quality and perceived defensiveness. Higher bond yields directly challenge those premiums by raising the discount rate (the rate used to calculate the present value of future earnings) applied to their long-duration cash flows. Earnings quality must demonstrably justify the premium multiple, or the premium shrinks.
Watch China demand commentary closely. Qualitative remarks from BHP, Rio Tinto, and Fortescue on steel production, property activity, and order books function as a forward indicator beyond official data. When miners talk about what their customers are actually ordering, that is real-economy signal that commodity price charts do not always capture.
| Dimension | Resources | Healthcare and infrastructure |
|---|---|---|
| Key rate sensitivity driver | Commodity prices and AUD movements partly offset domestic rate pressure | Higher bond yields raise the discount rate on long-duration cash flows, compressing valuation premiums |
| What to look for in results | Realised prices vs spot; unit cost trends; capex vs buyback allocation; China demand commentary | Organic revenue growth; labour and energy cost pressures; refinancing profiles; dividend coverage |
| What a negative signal looks like | Trimmed growth capex, cautious China commentary, shift from investment to buybacks | Margin contraction from cost pressures; rising interest expenses from refinancing; dividends maintained at the expense of balance sheet strength |
Broker playbooks for this season highlight balance sheet refinancing profiles as a specific scrutiny point for infrastructure names. Companies that have already refinanced at higher coupons may face structurally higher interest expenses, while those with large near-term maturities will face pointed questions about how they plan to manage the next step up in funding costs.
Why guidance will move share prices more than reported numbers
The single most common mistake investors make during reporting season is fixating on whether a company beat or missed FY26 consensus. The market has already moved past FY26. What moves share prices from here is the forward-looking signal: what management says about FY27, what they are doing with capital spending, and how they describe the current trading environment since 1 July.
FY26 estimates were set before the full effect of recent RBA hikes and federal budget changes was visible. A company can beat backward-looking consensus and still see its share price fall the next morning if FY27 guidance is subdued. That is not irrational. It is the market repricing forward earnings, which is the actual variable that sets valuations.
The divergence between top-down forecasts (12-13% EPS growth) and bottom-up cautious estimates (mid-single digits) makes any guidance revision this season particularly significant. Downgrades from domestic banks, retailers, or housing-related stocks would tell you where reality is converging.
The valuation context makes guidance commentary even more consequential: the equity risk premium on the ASX 200 sits at approximately 80 basis points, a historically thin buffer that leaves the index priced for near-perfect earnings delivery, meaning any FY27 guidance disappointment carries outsized repricing risk relative to the typical reporting season.
How executives describe the next 12-24 months may drive share prices more than whether they beat FY26 consensus by a few percentage points. The commentary layer is where the market’s forward positioning lives.
Here are the four specific guidance signals to interrogate in any result:
- Explicit FY27 earnings guidance or outlook statement: Does management commit to a range, or do they hedge with qualitative language?
- Current trading commentary since 1 July: This is the highest-value forward indicator, as it captures conditions after the balance date
- Capex and hiring plan changes: Pull-backs in expansionary spending or headcount signal management is preparing for slower demand or prolonged higher funding costs
- Tone and specificity of management language on consumer demand: Vague reassurance is weaker than specific data points on order books, pipeline, or sales run-rates
Investors who know how to weight guidance over headline EPS beats will avoid the common trap of chasing results that look strong on the surface but are already pricing in deterioration underneath.
The global macro calendar and how it shapes ASX results interpretation
Company results do not land in a vacuum. The macro calendar surrounding August 2026 can reprice entire sectors independent of what individual companies report, and three transmission channels connect global developments directly to your ASX holdings.
- AUD/USD movements: When the US dollar strengthens, the Australian dollar tends to weaken, which benefits exporters and resources companies but pushes up the cost of imported goods and can signal broader risk-off conditions across equity markets
- Global bond yields: A rise in yields increases the discount rate applied to future earnings streams, weighing most heavily on growth, healthcare, and infrastructure stocks whose valuations rely on long-duration cash flows, while also placing pressure on non-yielding assets such as gold
- Fed communication on the rate path: Signals from the US Federal Reserve that rate cuts are being pushed out, or that additional tightening remains possible, keep the global high-rate regime in place and amplify the domestic cost pressures already being absorbed by Australian companies
The Jackson Hole central banking symposium, scheduled 27-29 August 2026, is the pivotal late-season macro event. A hawkish signal from the Fed would extend the high-rate regime globally. A softer signal would support the view that the most severe phase of the rate shock has passed. Either outcome could reprice strong results downward or upward by compressing or expanding valuation multiples, meaning you need to track macro calendar risk alongside individual company calendars.
The RBA decision on 11 August as the season’s opening macro event
The RBA’s 11 August meeting falls in the same fortnight as the major bank results, creating a dual-signal moment. Three rate rises have already been delivered since February 2026 (in February, March, and May), and a fourth is possible at this meeting.
A fourth rate rise would intensify scrutiny of bank arrears and retail consumption commentary released in that same window. Read the pair together: the RBA’s statement and bank management commentary in the same week give you more signal than either source alone. The central bank tells you where it sees the economy heading; the banks tell you what they are actually seeing in their loan books. When those two views align or diverge, that is actionable information.
Building your August watchlist: what to track across the season
The sector-by-sector analysis above gives you the lenses. This section converts them into a structured framework you can apply to each result as it lands, from the first bank update in week two through to the final retail reports in week four.
The season’s heaviest concentration falls in weeks two through four. Five sector lenses covered in this piece (banking, retail, resources, healthcare and infrastructure, guidance and macro overlay) give you the interpretive structure. Here is the five-point framework for applying them:
- Go beyond beat or miss: Examine what drove the result (margins, volumes, provisions, capex), not just whether consensus EPS was met. The components tell you more than the headline.
- Weight guidance and current trading commentary heavily: Prioritise outlook statements for FY27 and remarks on trading since 1 July. These carry more information about where earnings are heading than backward-looking FY26 numbers.
- Map rate sensitivity by sector: Watch domestic banks, consumer discretionary, housing-related, and heavily leveraged names most closely for rate-related pressure. Contrast them with resources and exporters that may benefit from currency and commodity tailwinds.
- Track macro in parallel: Note the timing of the 11 August RBA decision, US CPI and payrolls releases, and Jackson Hole speeches (27-29 August). Rapid moves in bond yields or the AUD can change how the market prices even strong results.
- Watch for within-sector divergence: In every sector, some companies will show better cost control, stronger balance sheets, and more credible growth plans than peers. These divergences, once revealed in August, often persist in relative performance well into FY27.
Rate-sensitivity categories to keep front of mind:
- Most exposed to rate pressure: Domestic banks, consumer discretionary retailers, housing-related names, heavily leveraged balance sheets
- Potential currency or commodity offsets: Resources producers, exporters, companies with substantial USD-denominated revenue
Investors who track divergence within sectors, rather than treating each sector as a single bloc, will identify the relative positioning opportunities that August 2026 is particularly likely to surface, given the uneven impact of higher rates across business models even within the same industry.
For investors wanting to build a reusable decision framework before the season intensifies, our full explainer on reading earnings reports when good news tanks stocks covers the four behavioural traps that cause reactive trading at results and the pre-earnings decision plan used to counter them.
What August 2026 results will ultimately confirm
This reporting season will answer a single question that matters more than any individual company’s headline number: has corporate Australia genuinely adapted to a full year of elevated rates, or have the cracks that appeared in February widened into something structural?
The guidance and confidence signals from August will shape market positioning heading into the RBA’s September meeting and the broader FY27 outlook. That makes this season a pivot point, not a routine check-in. What management teams say about the next 12 months, and what their capital allocation decisions reveal about conviction, will set the terms for how the market values domestic earnings through the rest of the financial year.
Your edge as an investor is preparation. Track the right signals across sectors, monitor the macro calendar alongside the results calendar, and read within-sector divergence rather than sector-level headlines. August gives you the evidence. The framework in this piece gives you the structure to act on it.
This article is for informational purposes only and should not be considered financial advice. Investors should conduct their own research and consult with financial professionals before making investment decisions. Past performance does not guarantee future results. Financial projections are subject to market conditions and various risk factors.
—