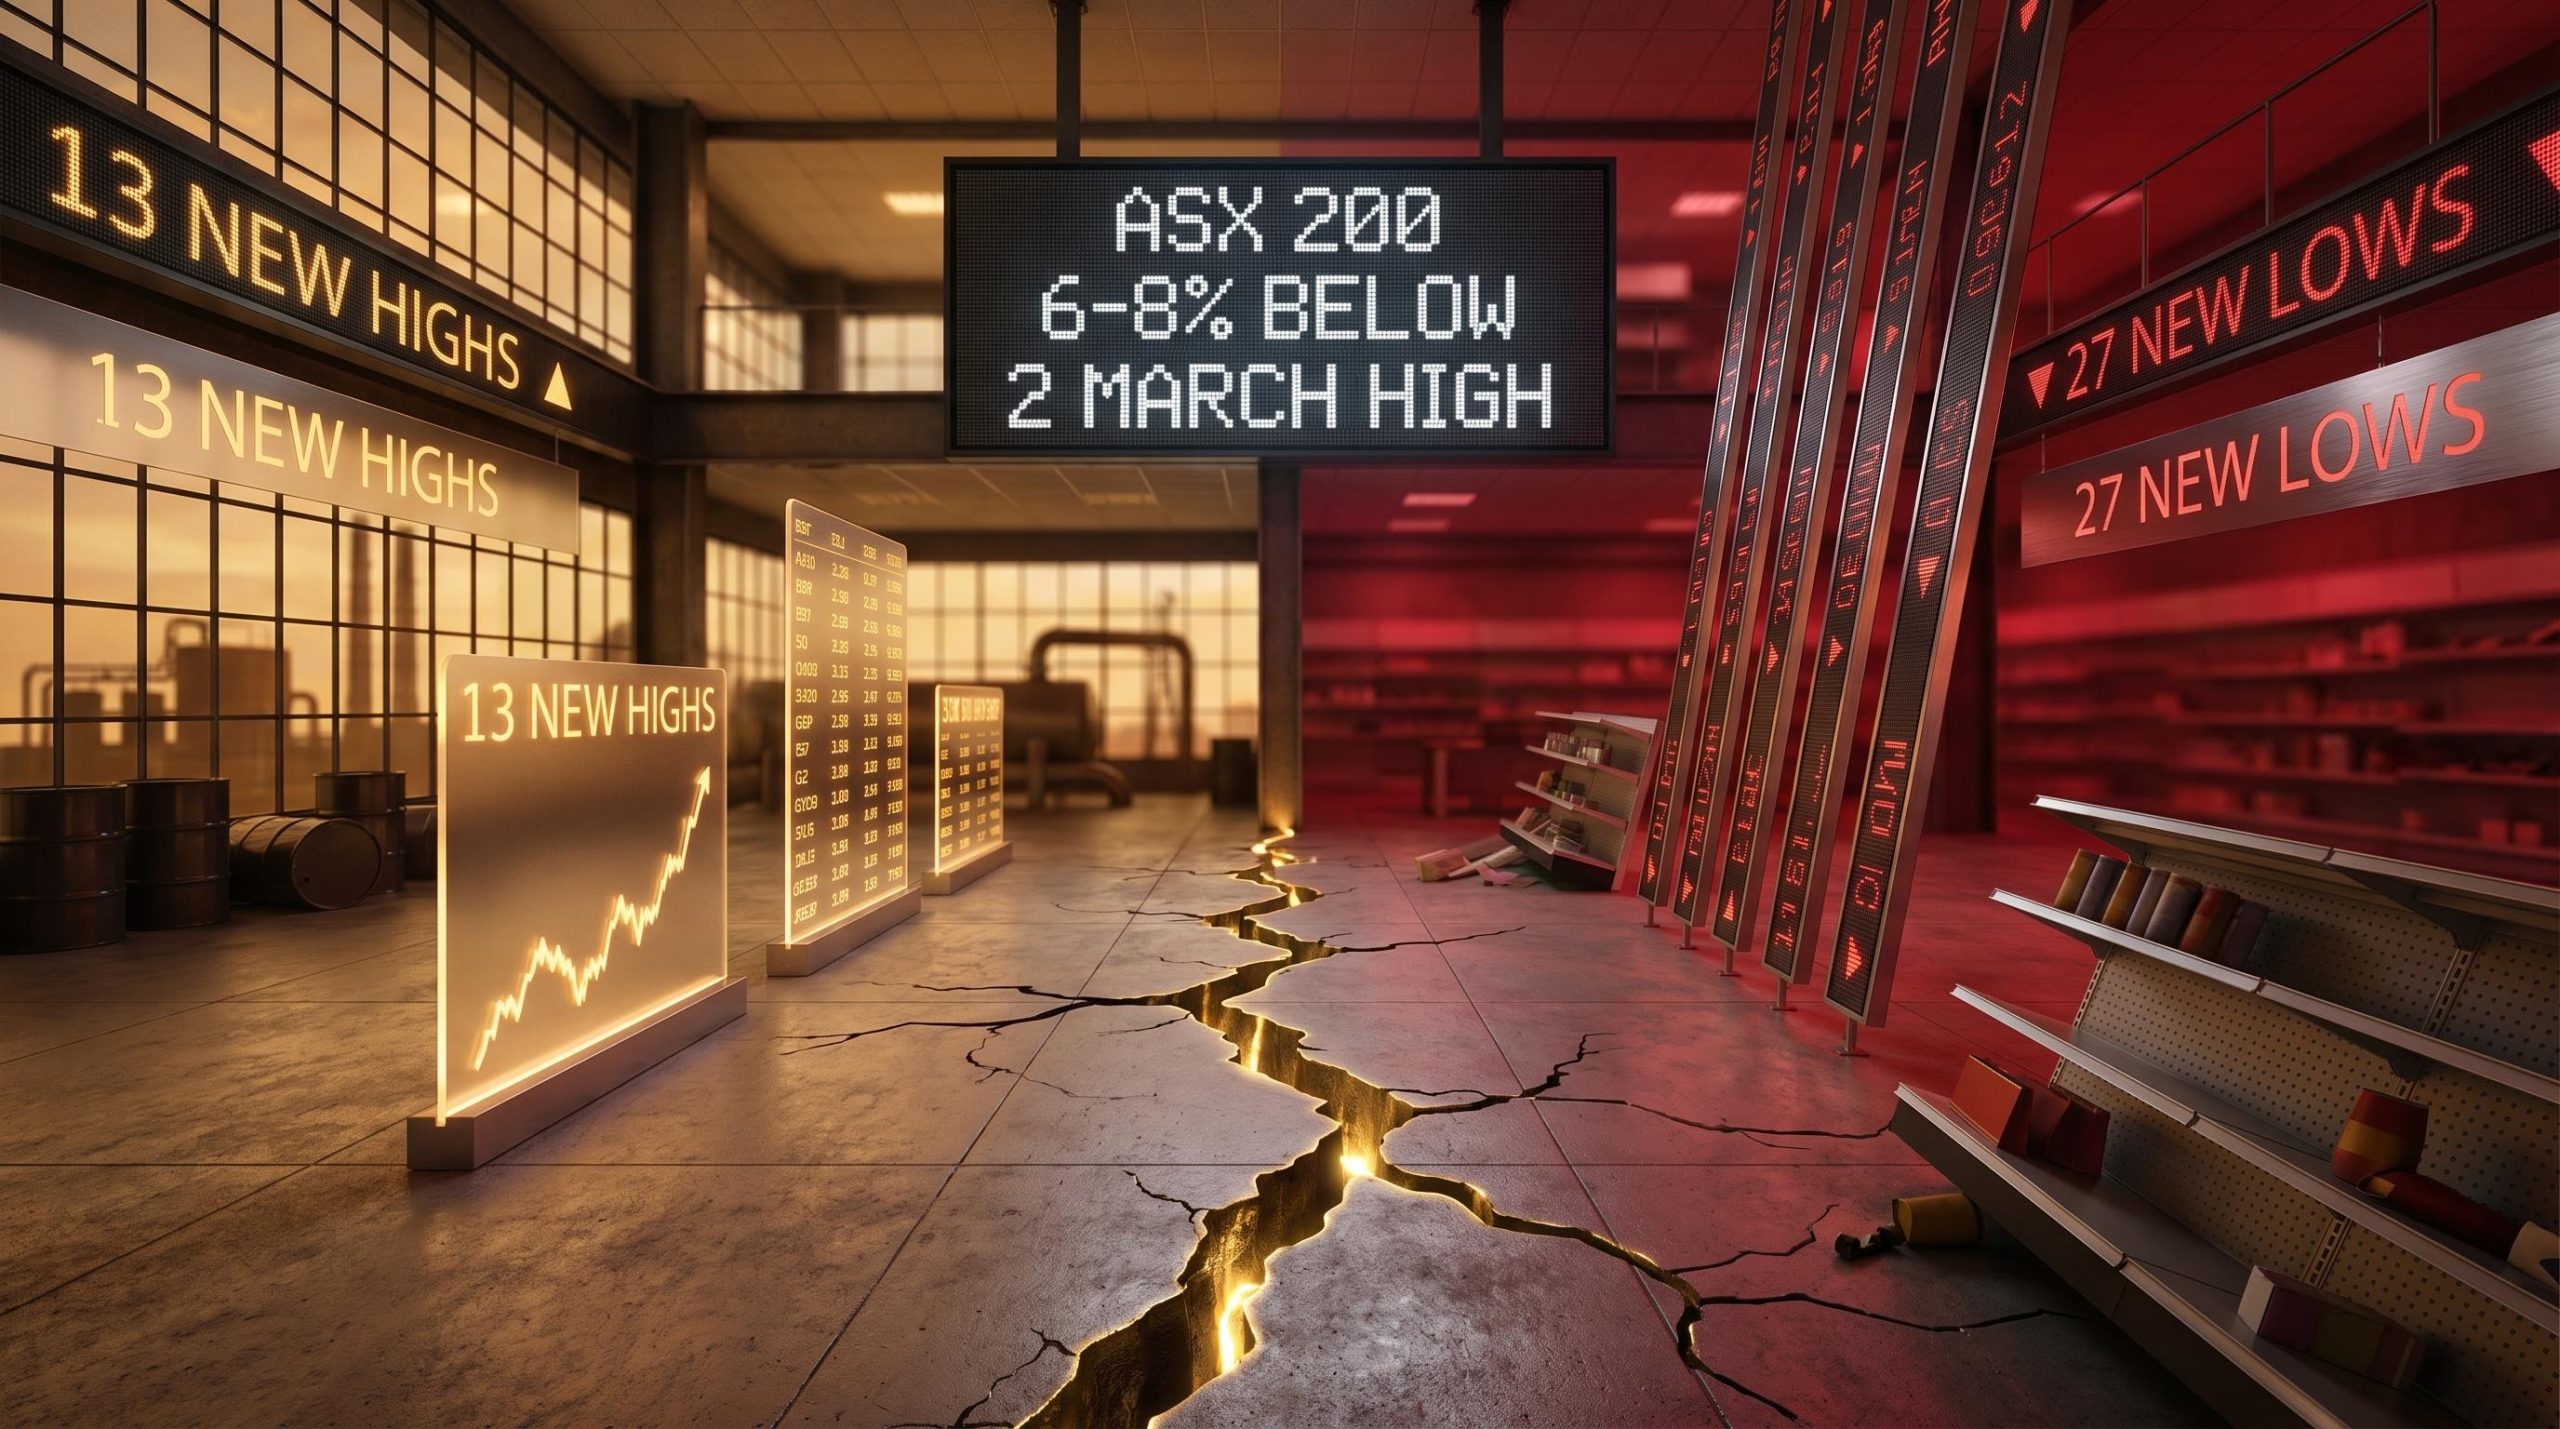
During the week ending 22 May 2026, the ASX 200 sat 6-8% below its 2 March all-time high. Across the index, 27 stocks printed new 52-week lows. Yet 13 names simultaneously hit fresh annual highs, a divergence wide enough to suggest two markets operating inside one index.
This is not a uniform pullback. Specific structural forces, a geopolitical risk premium in oil, rising bond yields splitting the defensive universe, and contract-driven industrial earnings, are redirecting capital in real time. The headline index level obscures those flows.
What follows maps the thematic forces behind every new ASX 200 52-week high recorded during the week, identifies the sectors producing genuine price strength, and isolates the structural damage accumulating on the other side of the ledger.
Why the ASX 200 breadth picture is more divided than the index level suggests
The raw numbers frame the week. Thirteen ASX 200 constituents hit new 52-week highs while 27 printed new 52-week lows, a ratio of roughly 1:2 in favour of deterioration.
13 new 52-week highs vs. 27 new 52-week lows for the week ending 22 May 2026, with the ASX 200 trading 6-8% below its 2 March all-time high.
The count of new lows has been trending higher across the month, rising from 22 two weeks earlier to 27 in the most recent period. That broadening deterioration sits beneath an index that touched an eight-week low during the week, making the headline number a poor proxy for what individual stocks are doing.
The ASX breadth deterioration visible in the current week is not a sudden development; the week ending 1 May 2026 already showed 22 constituents hitting annual lows while the headline index fell just 0.65%, establishing the pattern of widening constituent-level stress that has continued through May.
The sector breakdown sharpens the picture further.
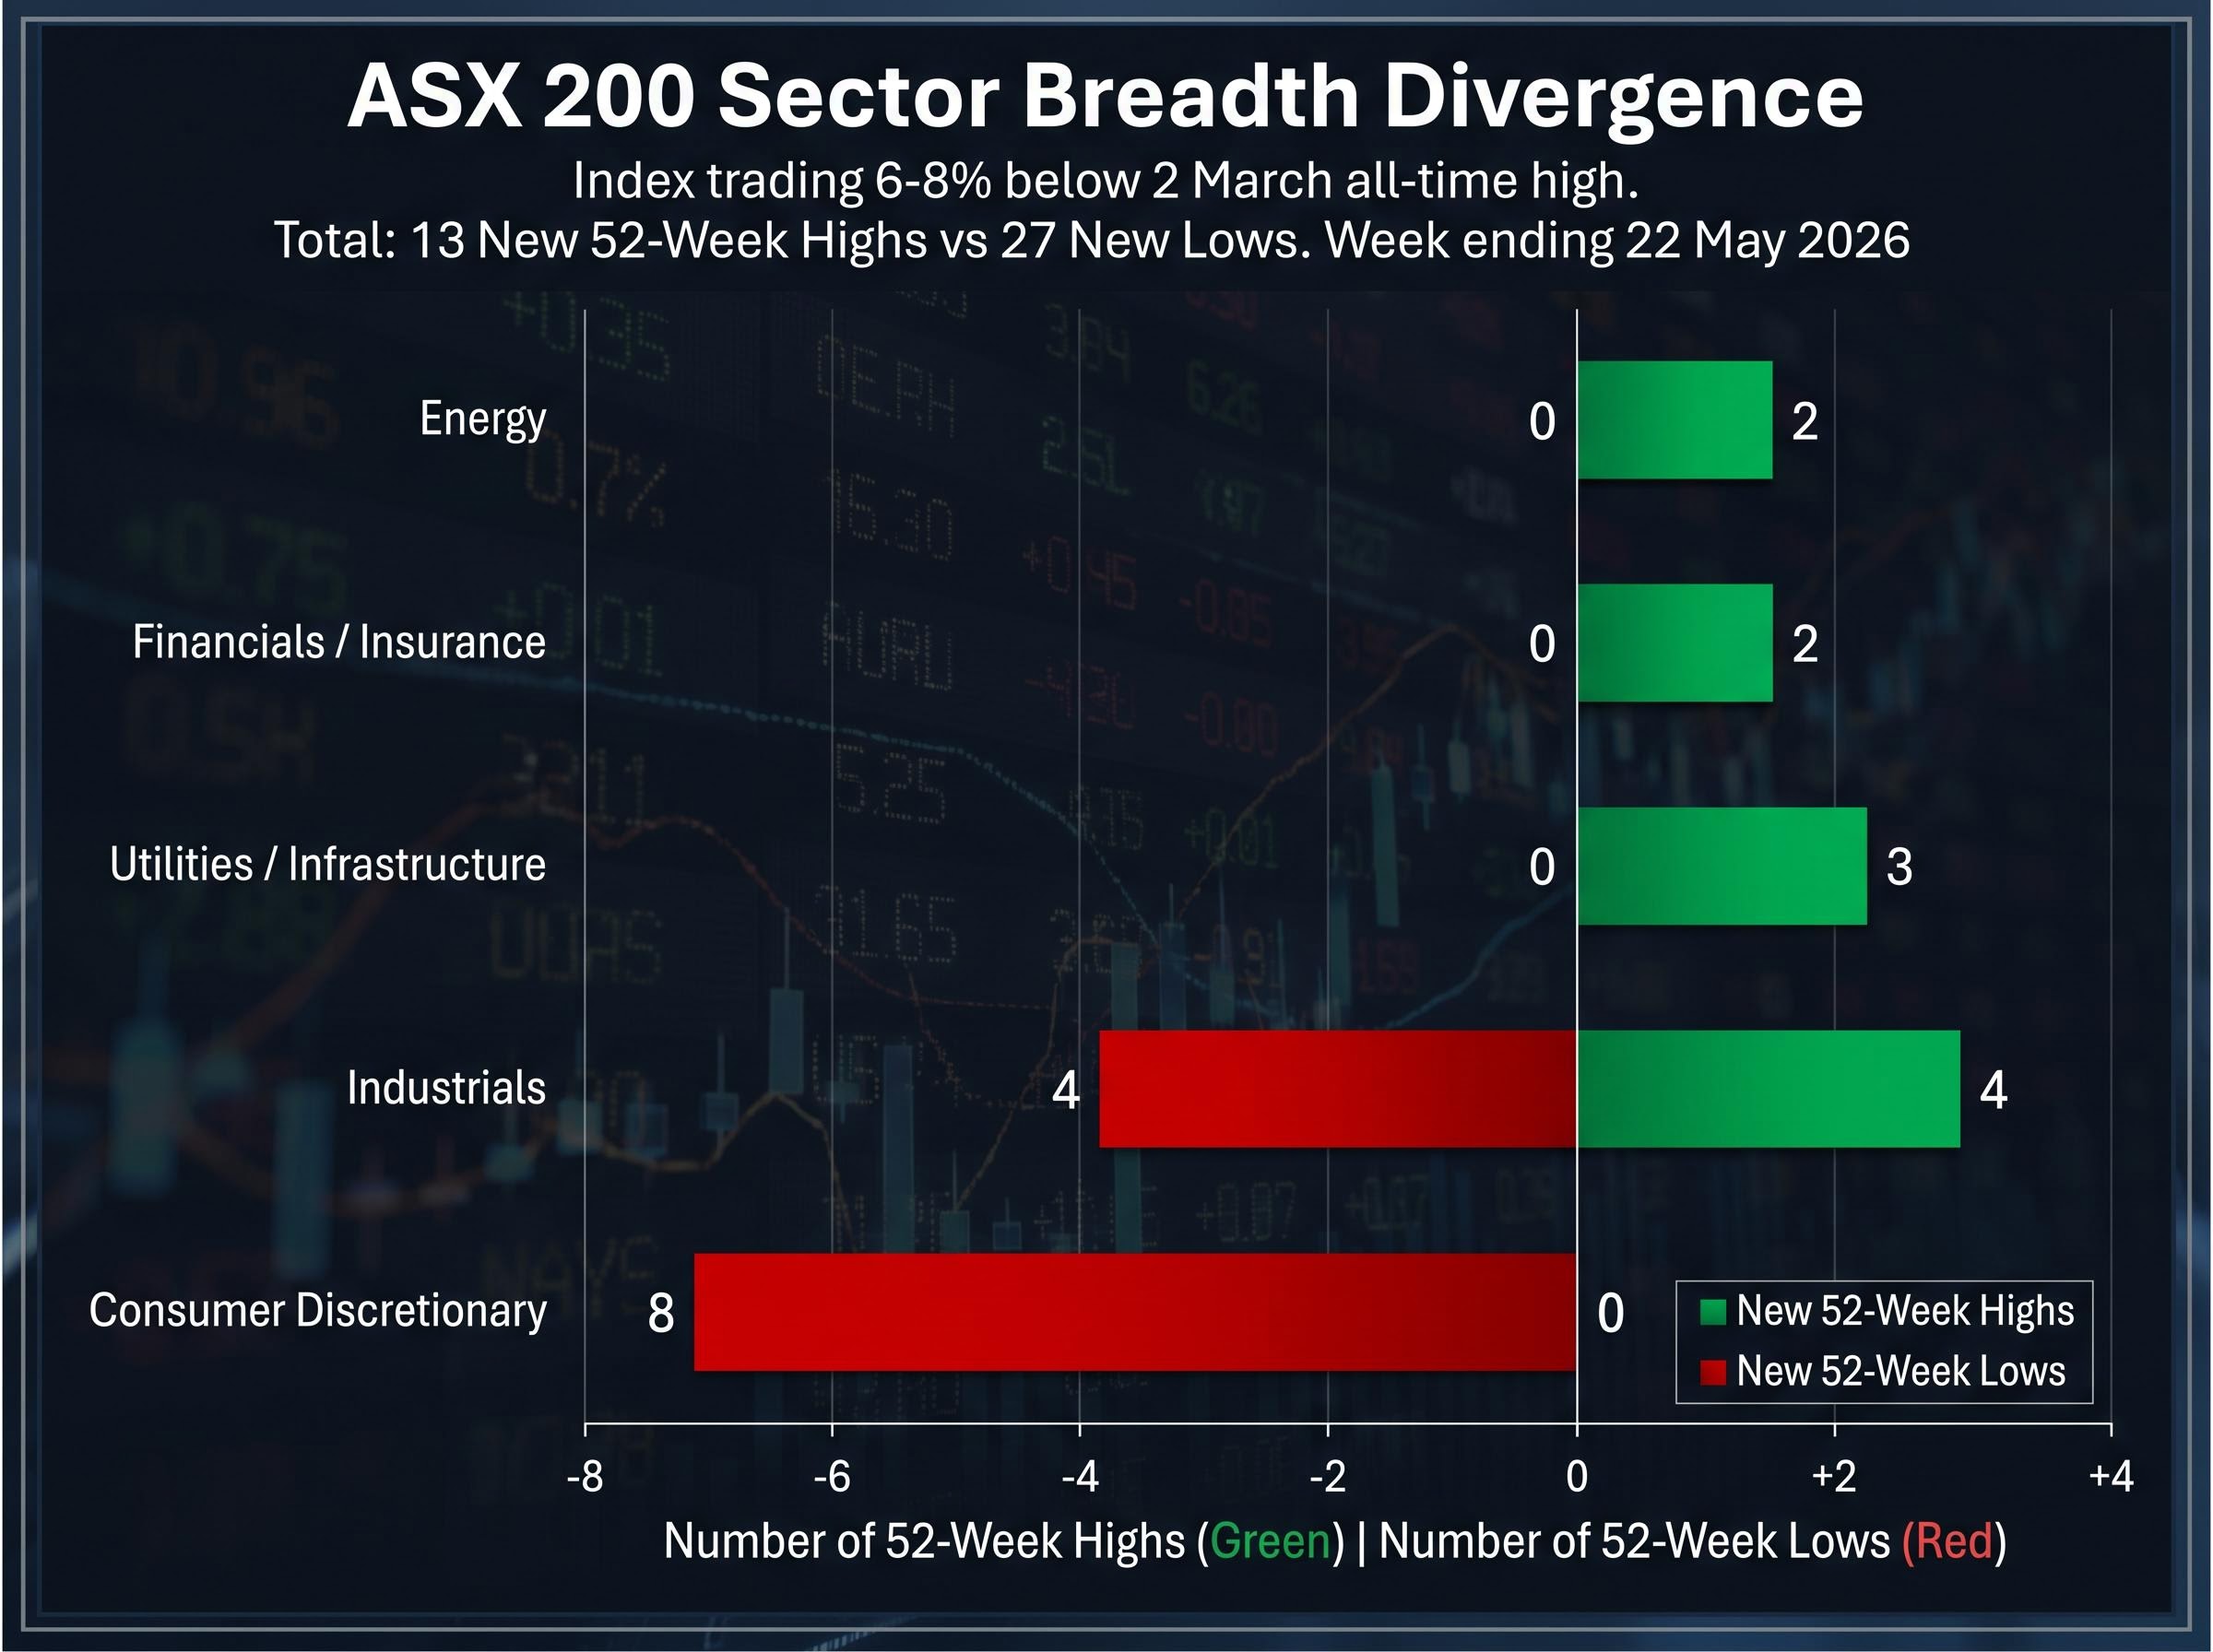
| Sector | New 52-Week Highs | New 52-Week Lows |
|---|---|---|
| Energy | 2 | 0 |
| Financials / Insurance | 2 | — |
| Industrials | 4 | 4 |
| Consumer Discretionary | 0 | 8 |
| Utilities / Infrastructure | 3 | 0 |
Energy and Utilities recorded zero new lows. Consumer Discretionary recorded zero new highs and 8 new lows. An investor tracking only the ASX 200 level misses this selective leadership forming beneath the surface.
When big ASX news breaks, our subscribers know first
What a new 52-week high actually means in a declining market
A 52-week high means a stock has outperformed every price point in the prior 12 months. In a rising market, that distinction is diluted because the tide lifts most names. In a falling market, the signal sharpens considerably.
When the ASX 200 is trading 6-8% below its peak, any stock reaching a new annual high has, by definition, overcome the dominant selling pressure. That implies genuine fundamental or thematic support rather than broad-market beta.
Not all new highs carry equal weight. Two categories emerged during the week:
- Momentum outperformers: Stocks with triple-digit annual returns, such as NRW Holdings (up 155.6% over the year) and SRG Global (up 104.0%), both of which hit new highs despite falling 6.4% and 3.5% respectively during the week itself.
- Resilient defensives: Stocks with single-digit or negative annual returns that still reached new highs, such as QBE Insurance Group, which was down 0.8% over the prior year yet printed a fresh 52-week high.
Using 52-week highs as a screening tool in a challenged market
Stocks making new highs while the index falls are outperforming the marginal seller. That relative strength is where institutional capital is choosing to allocate in a difficult tape. Treating the new-high list as a screening tool, rather than a celebratory headline, helps identify the pockets of conviction the broader index obscures.
The same 52-week high screening approach applied to the week ending 1 May 2026 produced a very different sector composition, with lithium names leading the new-high list at triple-digit annual gains against a backdrop of 22 simultaneous new lows in Consumer Discretionary and Health Care, illustrating how the sector leadership on this list can rotate sharply from week to week.
Research on new 52-week high to low ratios as a breadth indicator shows that when the ratio tilts decisively toward new lows in a declining index, the signal is most useful for identifying which sectors retain genuine institutional sponsorship rather than forecasting index-level direction.
Energy and geopolitical risk: the clearest sector call of the week
Ongoing Iran-related tensions have sustained a risk premium in crude oil markets through much of 2026. Brent crude has held in the mid-US$80s, supported by persistent Middle East risk, and that price backdrop feeds directly into earnings visibility for Australian energy producers and fuel refiners.
Santos (STO): up 28.2% over the year. Ampol (ALD): up 37.6% over the year. Both hit new 52-week highs for the week ending 22 May 2026.
Santos closed at $8.24, up 4.6% for the week, benefiting from long-term LNG contracts into North Asia that provide revenue certainty even if spot prices soften. Ampol closed at $35.44, up 1.1% for the week, leveraged to refining margins and domestic fuel demand.
The tailwinds converging on the sector include:
- LNG contract pricing linked to oil benchmarks
- Refining margin strength above long-run averages
- A geopolitical risk premium showing no sign of unwinding
- Free cash-flow yields that remain attractive relative to other yield sources
Energy was one of only two sectors with new highs and zero new lows for the week, making it the most coherent sector-level expression of a single theme. The geopolitical driver, the macro input, and the stock-level outcome all point in the same direction simultaneously.
For investors wanting to position around the oil price tailwind in more depth, our dedicated guide to ASX energy sector rotation maps how Woodside, Santos, and Karoon responded to Brent crude surging above US$110, models the LNG contract revenue mechanics that create earnings certainty for producers, and identifies the cost-pressure channels hitting miners, airlines, and consumer staples from the same price move.
Rising yields reshape the defensives map: who wins and who doesn’t
Australian government bond yields rose materially from their early-2026 lows, a move the RBA’s May 2026 Statement on Monetary Policy described as higher longer-term bond yields feeding into equity discount rates, particularly for long-duration assets.
The RBA’s May 2026 Statement on Monetary Policy identified the rise in longer-term nominal and real government bond yields as a key financial conditions shift, noting that higher discount rates compress valuations most severely for long-duration assets, a dynamic playing out in real time across the ASX 200’s defensive cohort.
The conventional assumption is that rising yields hurt defensives uniformly. The new-high list tells a different story. The yield environment is splitting the defensive universe in two.
General insurers benefit from higher running yields on their fixed-income investment books. A Westpac Economics research note, summarised in the AFR in mid-May 2026, described the yield back-up as “most challenging for listed infrastructure and utilities” while being “modestly positive for insurers.”
| Company | Ticker | Weekly Change | Annual Change |
|---|---|---|---|
| Challenger | CGF | +2.8% | +25.6% |
| QBE Insurance Group | QBE | +2.3% | -0.8% |
| Dalrymple Bay Infrastructure | DBI | +5.5% | +34.6% |
| Infratil | IFT | +4.7% | +26.3% |
| APA Group | APA | -2.5% | +25.8% |
Challenger (closed at $9.46) and QBE (closed at $23.57) are the clearest yield beneficiaries, with higher reinvestment yields lifting investment income on their portfolios.
Infrastructure names defying the yield headwind
Dalrymple Bay Infrastructure, Infratil, and APA Group all hit new highs despite the yield pressure narrative. Their regulated return frameworks and long-term contracted cash flows may provide insulation that generic infrastructure exposures lack. DBI’s coal terminal throughput contracts and APA’s regulated gas pipeline returns offer a degree of revenue certainty that partially offsets the discount-rate headwind.
Industrial contractors and the new-high names the market is overlooking
The industrial and telecom names on the new-high list share a common trait: their earnings are driven by company-specific execution and contract delivery rather than macro tailwinds. That makes them harder to reverse.
NRW Holdings (NWH): up 155.6% over the year, yet down 6.4% on the week. Short-term profit-taking against a backdrop of sustained annual momentum.
NRW Holdings and SRG Global are both mining services and infrastructure contractors whose revenues are tied to contract backlogs rather than commodity spot prices. SRG closed at $3.04, down 3.5% for the week but up 104.0% for the year, a pattern consistent with profit-taking on a stock that has more than doubled.
The remaining non-energy, non-financial new highs round out the picture:
- Sims (SGM): $23.23, up 3.3% weekly, up 54.1% annually (recycling economics)
- Dyno Nobel (DNL): $3.68, down 0.3% weekly, up 39.4% annually (industrial explosives demand)
- Superloop (SLC): $3.51, up 0.9% weekly, up 35.5% annually (broadband growth)
- Telstra (TLS): $5.38, flat weekly, up 13.3% annually (defensive telco stability)
The Industrials sector recorded 4 new highs and 4 new lows for the week, the most balanced of any sector. Telstra and APA Group function as the defensive anchors of the new-high list: flat or near-flat on the week with modest but consistent annual gains. NRW and SRG’s triple-digit annual returns in a struggling market demonstrate that contract-driven industrial earnings can prove durable even when macro conditions are unfavourable.
Where the new highs end and the structural damage begins
The new-high list is narrow, thematically coherent, and concentrated in three pockets: energy, select defensives, and contract-driven industrials. The other side of the ledger is less orderly.
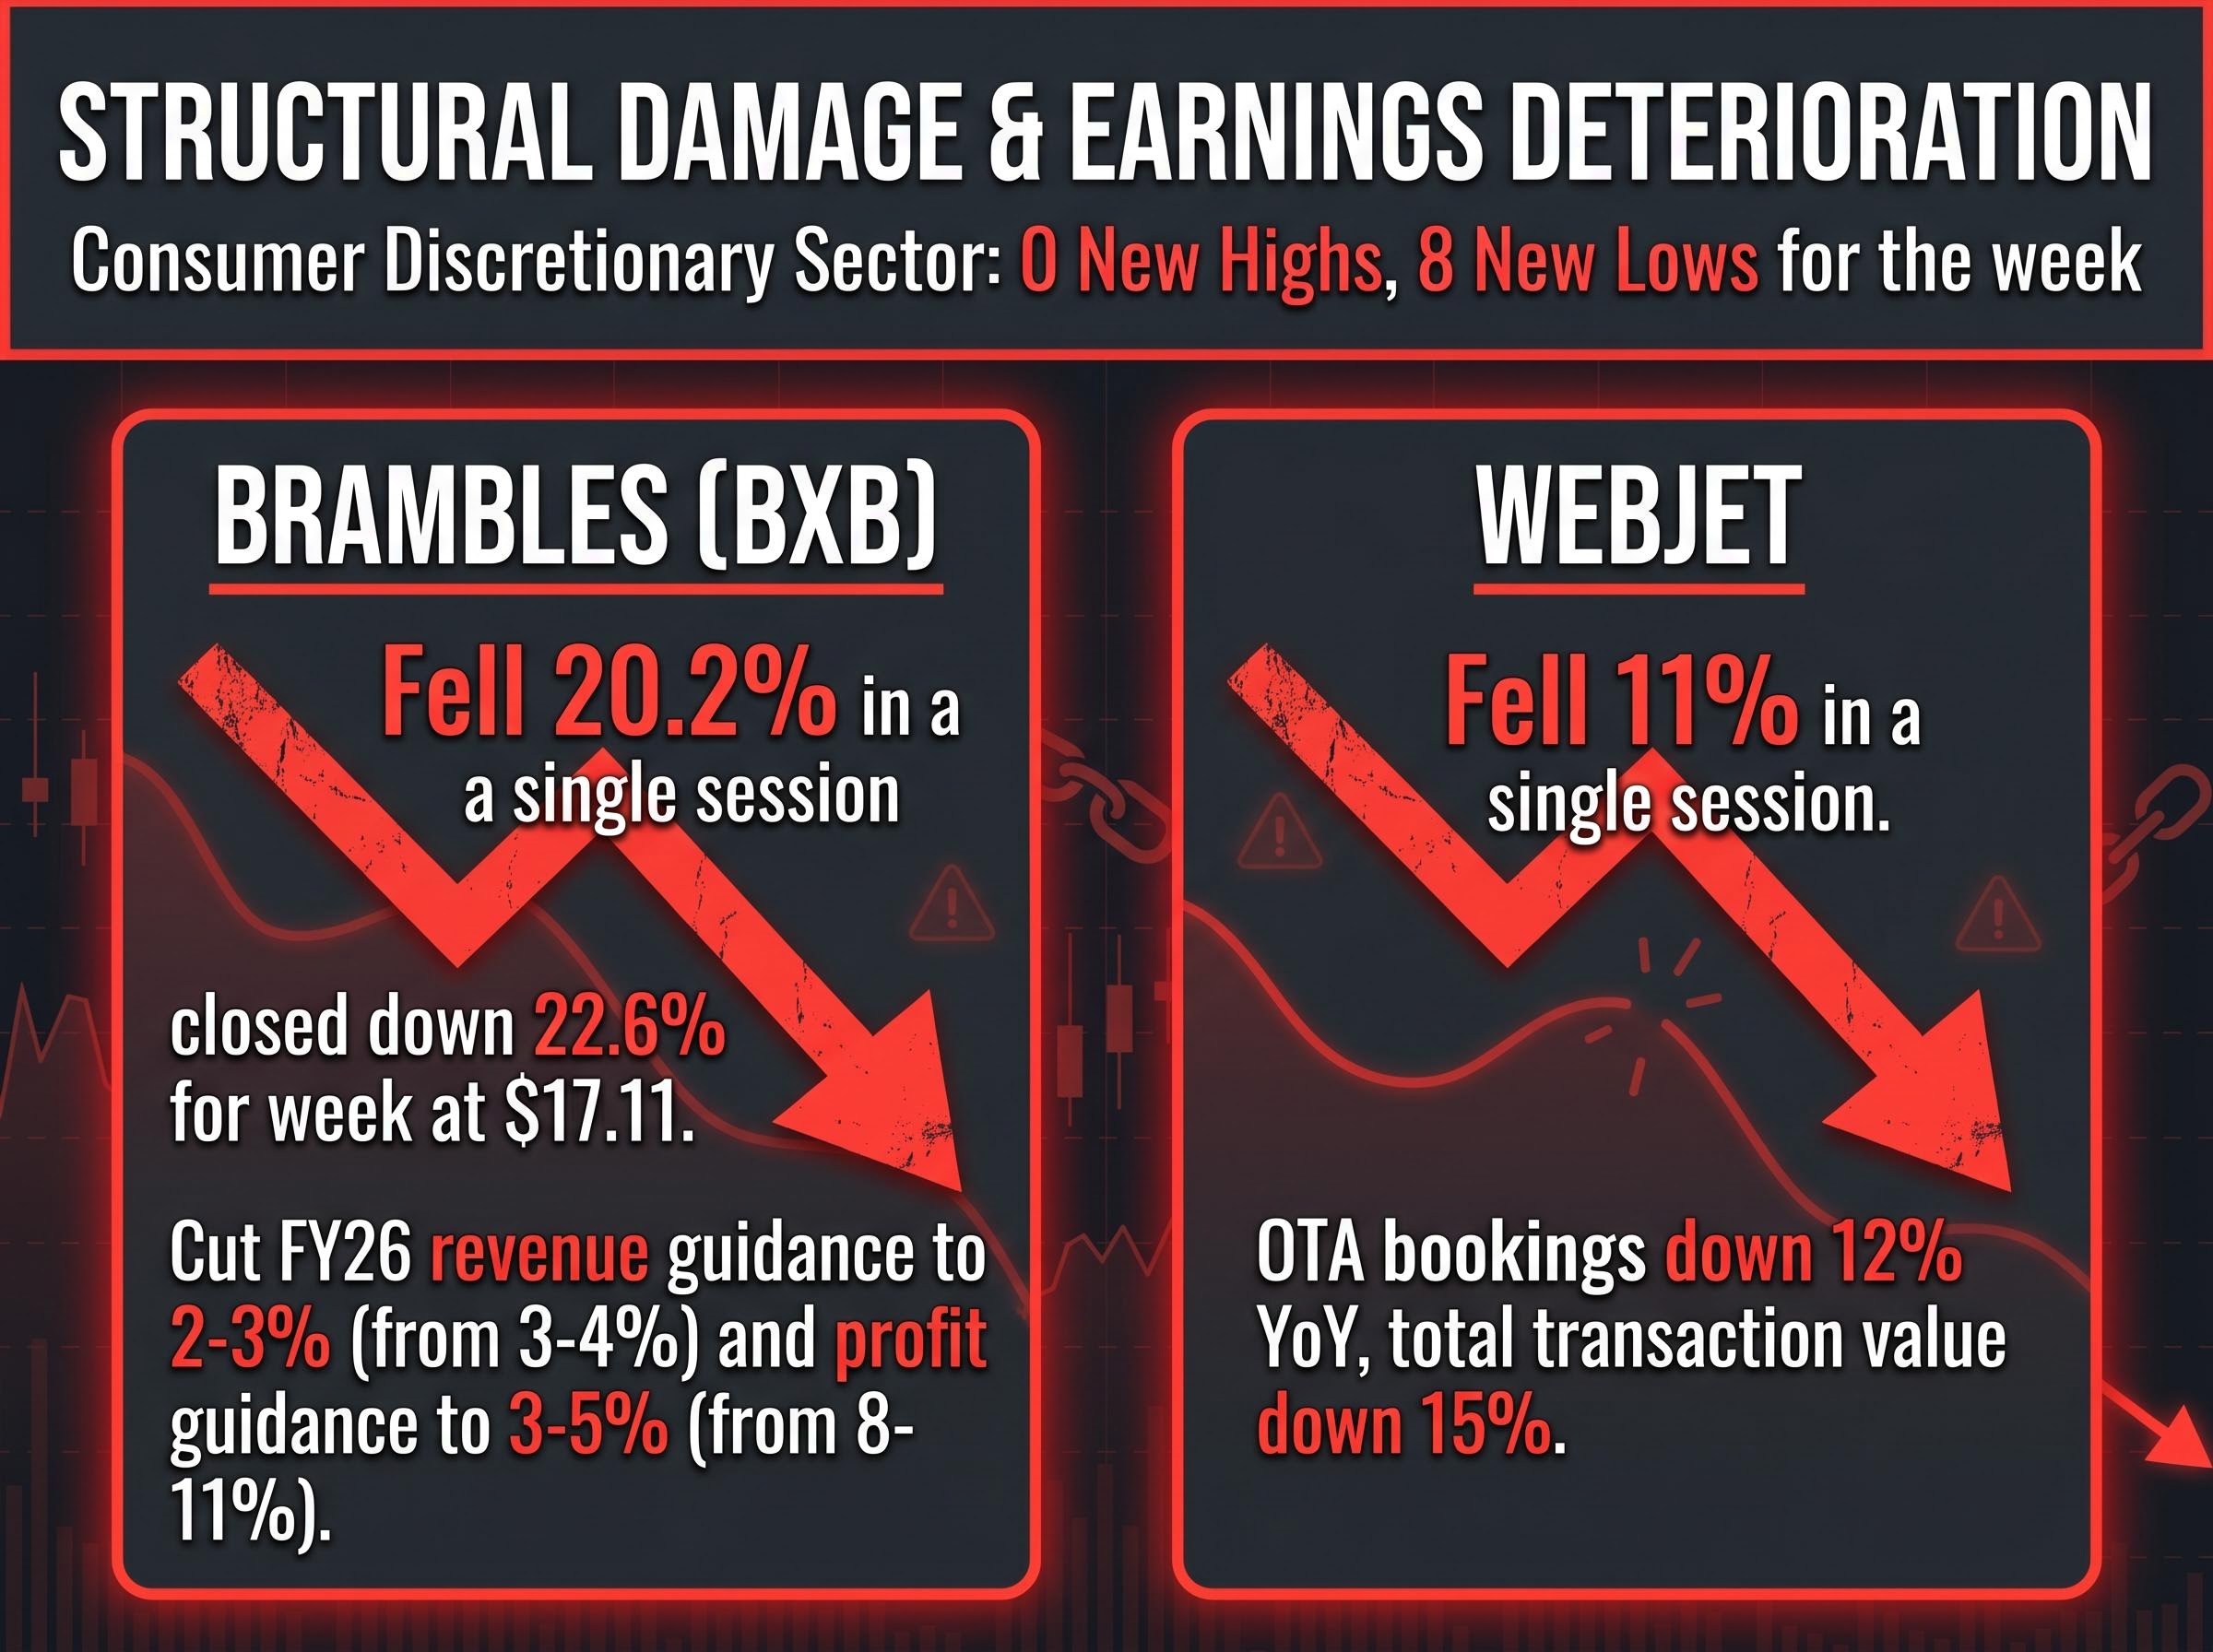
Brambles (BXB) fell 20.2% in a single session after cutting FY26 revenue guidance to 2-3% from 3-4% and profit guidance to 3-5% from 8-11%, closing the week at $17.11, down 22.6%.
Consumer Discretionary recorded zero new highs and 8 new lows for the week, a sector weighed down by cost-of-living pressure, rate sensitivity, and specific earnings disappointments. Webjet fell 11% in a single session after reporting OTA bookings down 12% year-on-year and total transaction value down 15%. The Westpac-Melbourne Institute Consumer Sentiment Index rose 3.5% in the prior period from deeply pessimistic levels, yet even that bounce failed to arrest the sector decline.
Three structural tailwinds driving the new-high names appear likely to persist as long as the current macro environment holds:
The oil shock repricing that began in April 2026, when Brent hit $116.62 following collapsed US-Iran talks, established the geopolitical risk premium now sustaining Santos and Ampol at new annual highs, while simultaneously pushing Australian CPI to 4.6% and creating the rate pressure that is compressing equity multiples in Consumer Discretionary.
- A geopolitical risk premium sustaining oil prices in the mid-US$80s
- Rising bond yields improving insurer investment income
- Industrial contract backlogs providing earnings visibility independent of the cycle
The week’s definitive summary: 13 highs against 27 lows. The market is rewarding conviction in energy, insurers, and select industrial contractors while consumer-facing names and rate-sensitive long-duration assets continue to deteriorate. The index level alone does not communicate that split. The breadth data does.
This article is for informational purposes only and should not be considered financial advice. Investors should conduct their own research and consult with financial professionals before making investment decisions. Past performance does not guarantee future results.