IBM, Salesforce and ServiceNow Fall on Starbucks AI Build Report
2 hrs ago


On 8 July 2026, President Trump publicly announced he was voiding the interim peace arrangement with Iran, and the hours that followed brought circulating reports of new US military strikes on Iranian positions alongside formal warnings of retaliation from Tehran. Energy markets, which had spent weeks pricing relative stability under the interim framework, are now repricing oil, inflation expectations, and the Federal Reserve’s rate path simultaneously.
The speed of the collapse matters. This was not a gradual deterioration or a diplomatic misunderstanding that could be quietly walked back. It was a named, public break, and it triggered a repricing across crude futures, Treasury yields, and volatility gauges in a single session. Here is exactly which markets moved, by how much, and what that tells you if you hold energy, fixed income, or rate-sensitive assets heading into the rest of July.
The breakdown followed a specific sequence, and understanding the order matters because it reveals how quickly the escalation ladder was climbed.
The EIA analysis of global oil transit chokepoints confirms that oil flows through the Strait of Hormuz averaged 20.9 million barrels per day in the first half of 2025, equivalent to roughly 20% of global petroleum liquids consumption, making any confirmed disruption there a systemic supply event rather than a regional one.
The formality of Trump’s declaration is the detail that separates this from a negotiating tactic. Interim frameworks can be quietly allowed to lapse; this one was publicly torn up. That means any diplomatic re-engagement requires both sides to build a new framework from scratch, not patch the existing one. Markets are now pricing a wider range of escalation scenarios, not a temporary spike.
The headline numbers from the session tell a more nuanced story than “oil surged.”
| Asset | Price | Change ($/ pts) | Change (%) |
|---|---|---|---|
| WTI Crude Oil Futures | $74.15 | +$0.63 | +0.86% |
| Brent Oil Futures | $78.72 | -$0.54 | -0.68% |
| S&P 500 VIX | 16.90 | +0.77 | +4.77% |
| US 10-Year Treasury Yield | 4.578% | +0.011 | +0.24% |
WTI closed higher. Brent closed lower. On the same session, with the same geopolitical trigger. That divergence tells you something important: the market has not committed to a single direction yet. Traders are weighing escalation risk against the possibility of a diplomatic reversal, and neither side of that bet dominated the close.
Both benchmarks remain in the high-$70s range after surging several per cent on the initial strike news and then consolidating. The broader context matters more than the single-session print.
The threshold to watch: A sustained break above the mid-$80s for Brent and WTI would signal a more forceful inflation pass-through to the broader economy. Until that level breaks, the market is pricing disruption risk without pricing disruption itself.
The VIX climbing 4.77% confirms the session was genuinely risk-off. That increase is not noise; it reflects options markets adjusting for a wider distribution of outcomes. The next concrete development, whether Iranian retaliation or renewed diplomatic contact, will carry outsized price impact precisely because the market is straddling two scenarios.
When crude prices rise, the effect does not stop at the petrol station. Oil feeds into headline inflation through three direct channels: the cost of fuel itself, the cost of transporting goods, and the cost of manufacturing anything that uses petroleum-derived inputs. That means a sustained move in crude touches grocery prices, airline fares, and industrial output, not just energy stocks.
This is where the Federal Reserve enters the picture. Rising energy costs reduce the Fed’s confidence that inflation is sustainably falling toward its 2% target. If oil prices push headline inflation readings higher over the coming months, the case for rate cuts weakens, and the “higher for longer” interest rate scenario that markets spent early 2026 trying to move past comes back into focus.
This is not theoretical. During earlier phases of the 2026 Iran conflict, analysts flagged that energy shocks could force central banks to delay or reverse planned easing. That logic applies again with renewed urgency.
The most recent Fed meeting minutes pointed to policymakers adopting a guarded posture, with internal deliberations reflecting a broadly even split on the rate outlook. The committee showed little appetite for claiming the inflation battle was won, and the subsequent deterioration in the geopolitical environment has done nothing to shift that calculus.
The Fed meeting minutes from April 2026 had already revealed four dissenting votes, the most at a single FOMC meeting since 1992, with the 30-year Treasury yield simultaneously reaching 5.14%; the July deterioration in geopolitical conditions arrives on top of an institution already fractured over the rate path.
The 10-2 year spread widening by 15.27% in a single session is the data point that deserves the most attention from fixed income investors. That movement reflects markets pricing a stickier inflation outlook alongside elevated longer-term risk premia, meaning investors are demanding more compensation for holding long-dated paper in an environment where the inflation path has become uncertain again.
The 30-year yield breaking above 5% is a signal that long-duration bond holders and mortgage-rate watchers cannot afford to wait for confirmation. Markets are already pricing a stickier inflation path, and waiting for that view to be validated means absorbing more duration risk in the meantime.
The 5.25% Treasury yield threshold on the 30-year is the level strategists cite as a structural inflection point that would force institutional allocators to systematically reduce equity risk premia across portfolios, a level that becomes materially more reachable if sustained crude above the mid-$80s confirms an inflationary pass-through.
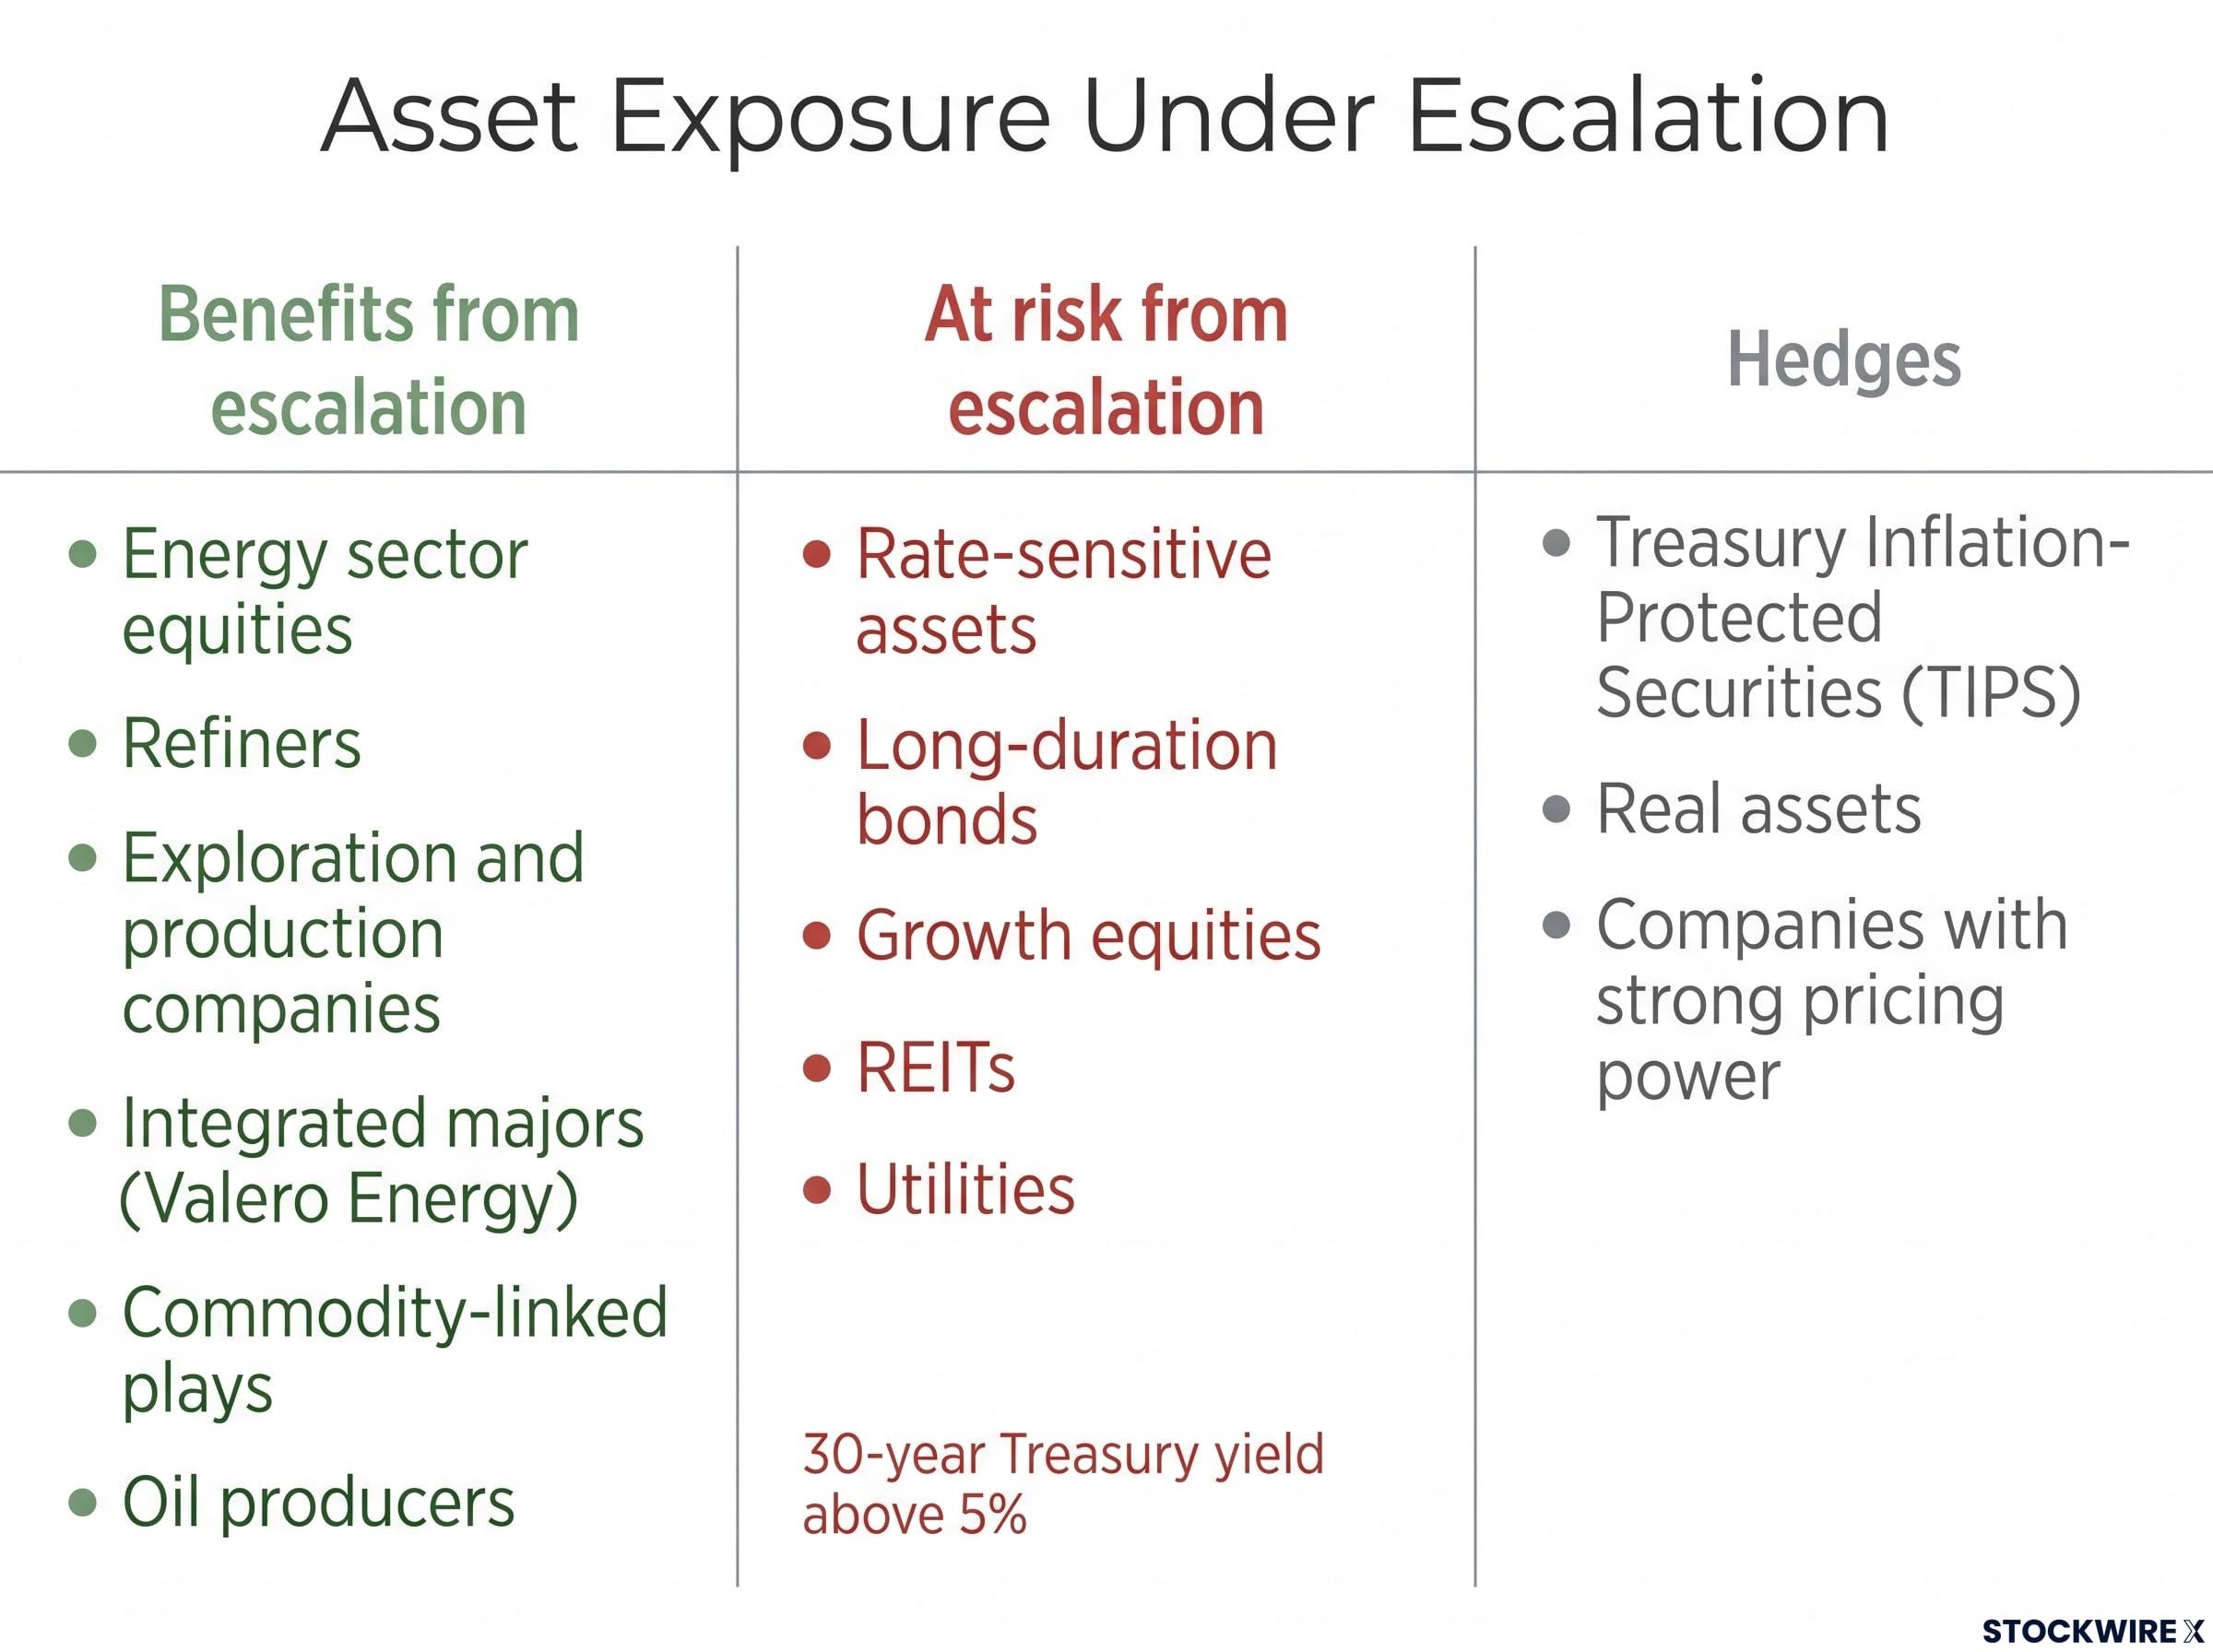
The repricing creates three distinct categories of exposure.
The speed of this repricing, occurring across a matter of sessions rather than weeks, is itself a risk factor. Reactive portfolio adjustments made under stress carry real execution risk. Before repositioning, the question worth asking is whether your current allocation can absorb another escalation leg without forced selling.
This article is for informational purposes only and should not be considered financial advice. Investors should conduct their own research and consult with financial professionals before making investment decisions.
The single most consequential escalation trigger: Confirmed disruption to tanker flows through the Strait of Hormuz would represent a step-change in supply shock severity, not an incremental development. This is the signal that separates a contained geopolitical event from a global energy crisis.
These five signals give you a concrete framework for distinguishing a volatility spike that fades from a geopolitical shift that rewrites the inflation and rate outlook for the second half of 2026.
Three things have concretely shifted. The inflation risk premium in energy markets has risen. The Fed’s near-term easing path is less certain than it was a week ago. And the risk environment for rate-sensitive assets has deteriorated measurably, with the 30-year yield above 5% and the VIX at 16.90.
The IEA has characterised the current Middle East geopolitical tension as a persistent structural inflation risk rather than a transient spike, a classification that has historically preceded slower-decompress risk premia across energy futures curves and central bank communication.
What has not changed: the structural factors supporting equity valuations more broadly remain intact, and diplomatic reversals remain possible. A renewed ceasefire framework would quickly reprice much of the geopolitical premium now baked into energy and rates. The speed of the collapse is itself a reminder that sentiment can shift in either direction faster than most portfolios can reposition.
The market has repriced risk but not yet priced catastrophe. There is room for things to get materially worse or to recover, and positioning should reflect that uncertainty rather than a single outcome. Three variables deserve close monitoring in the sessions ahead:
These statements are speculative and subject to change based on market developments and geopolitical conditions. Past performance does not guarantee future results.
WTI crude closed at $74.15, up 0.86%, while Brent closed at $78.72, down 0.68% on the same session. The divergence signals the market has not committed to a single direction, weighing escalation risk against the possibility of diplomatic reversal.
The Strait of Hormuz is a narrow waterway through which roughly 20% of global oil supply passes daily, averaging 20.9 million barrels per day in the first half of 2025. Any confirmed disruption to tanker traffic there would represent a systemic global supply shock, not just a regional event.
Rising energy costs from the conflict push headline inflation higher, weakening the case for Fed rate cuts and reinforcing the higher-for-longer interest rate scenario. The 10-2 year Treasury yield spread widened 15.27% in a single session on 8 July, reflecting markets pricing a stickier inflation outlook.
Energy sector equities including refiners, E&P companies, and integrated majors benefit from higher crude prices, while long-duration bonds, growth equities, REITs, and utilities face pressure from the higher-for-longer inflation scenario now being repriced. TIPS, real assets, and companies with strong pricing power offer targeted hedges against this inflation risk.
A sustained break above the mid-$80s for both Brent and WTI is the threshold analysts cite as confirmation of a more forceful inflation pass-through to the broader economy. Until that level breaks, markets are pricing disruption risk without pricing an actual disruption.