How the Hormuz Closure Drives Oil Prices and Inflation
19 mins ago

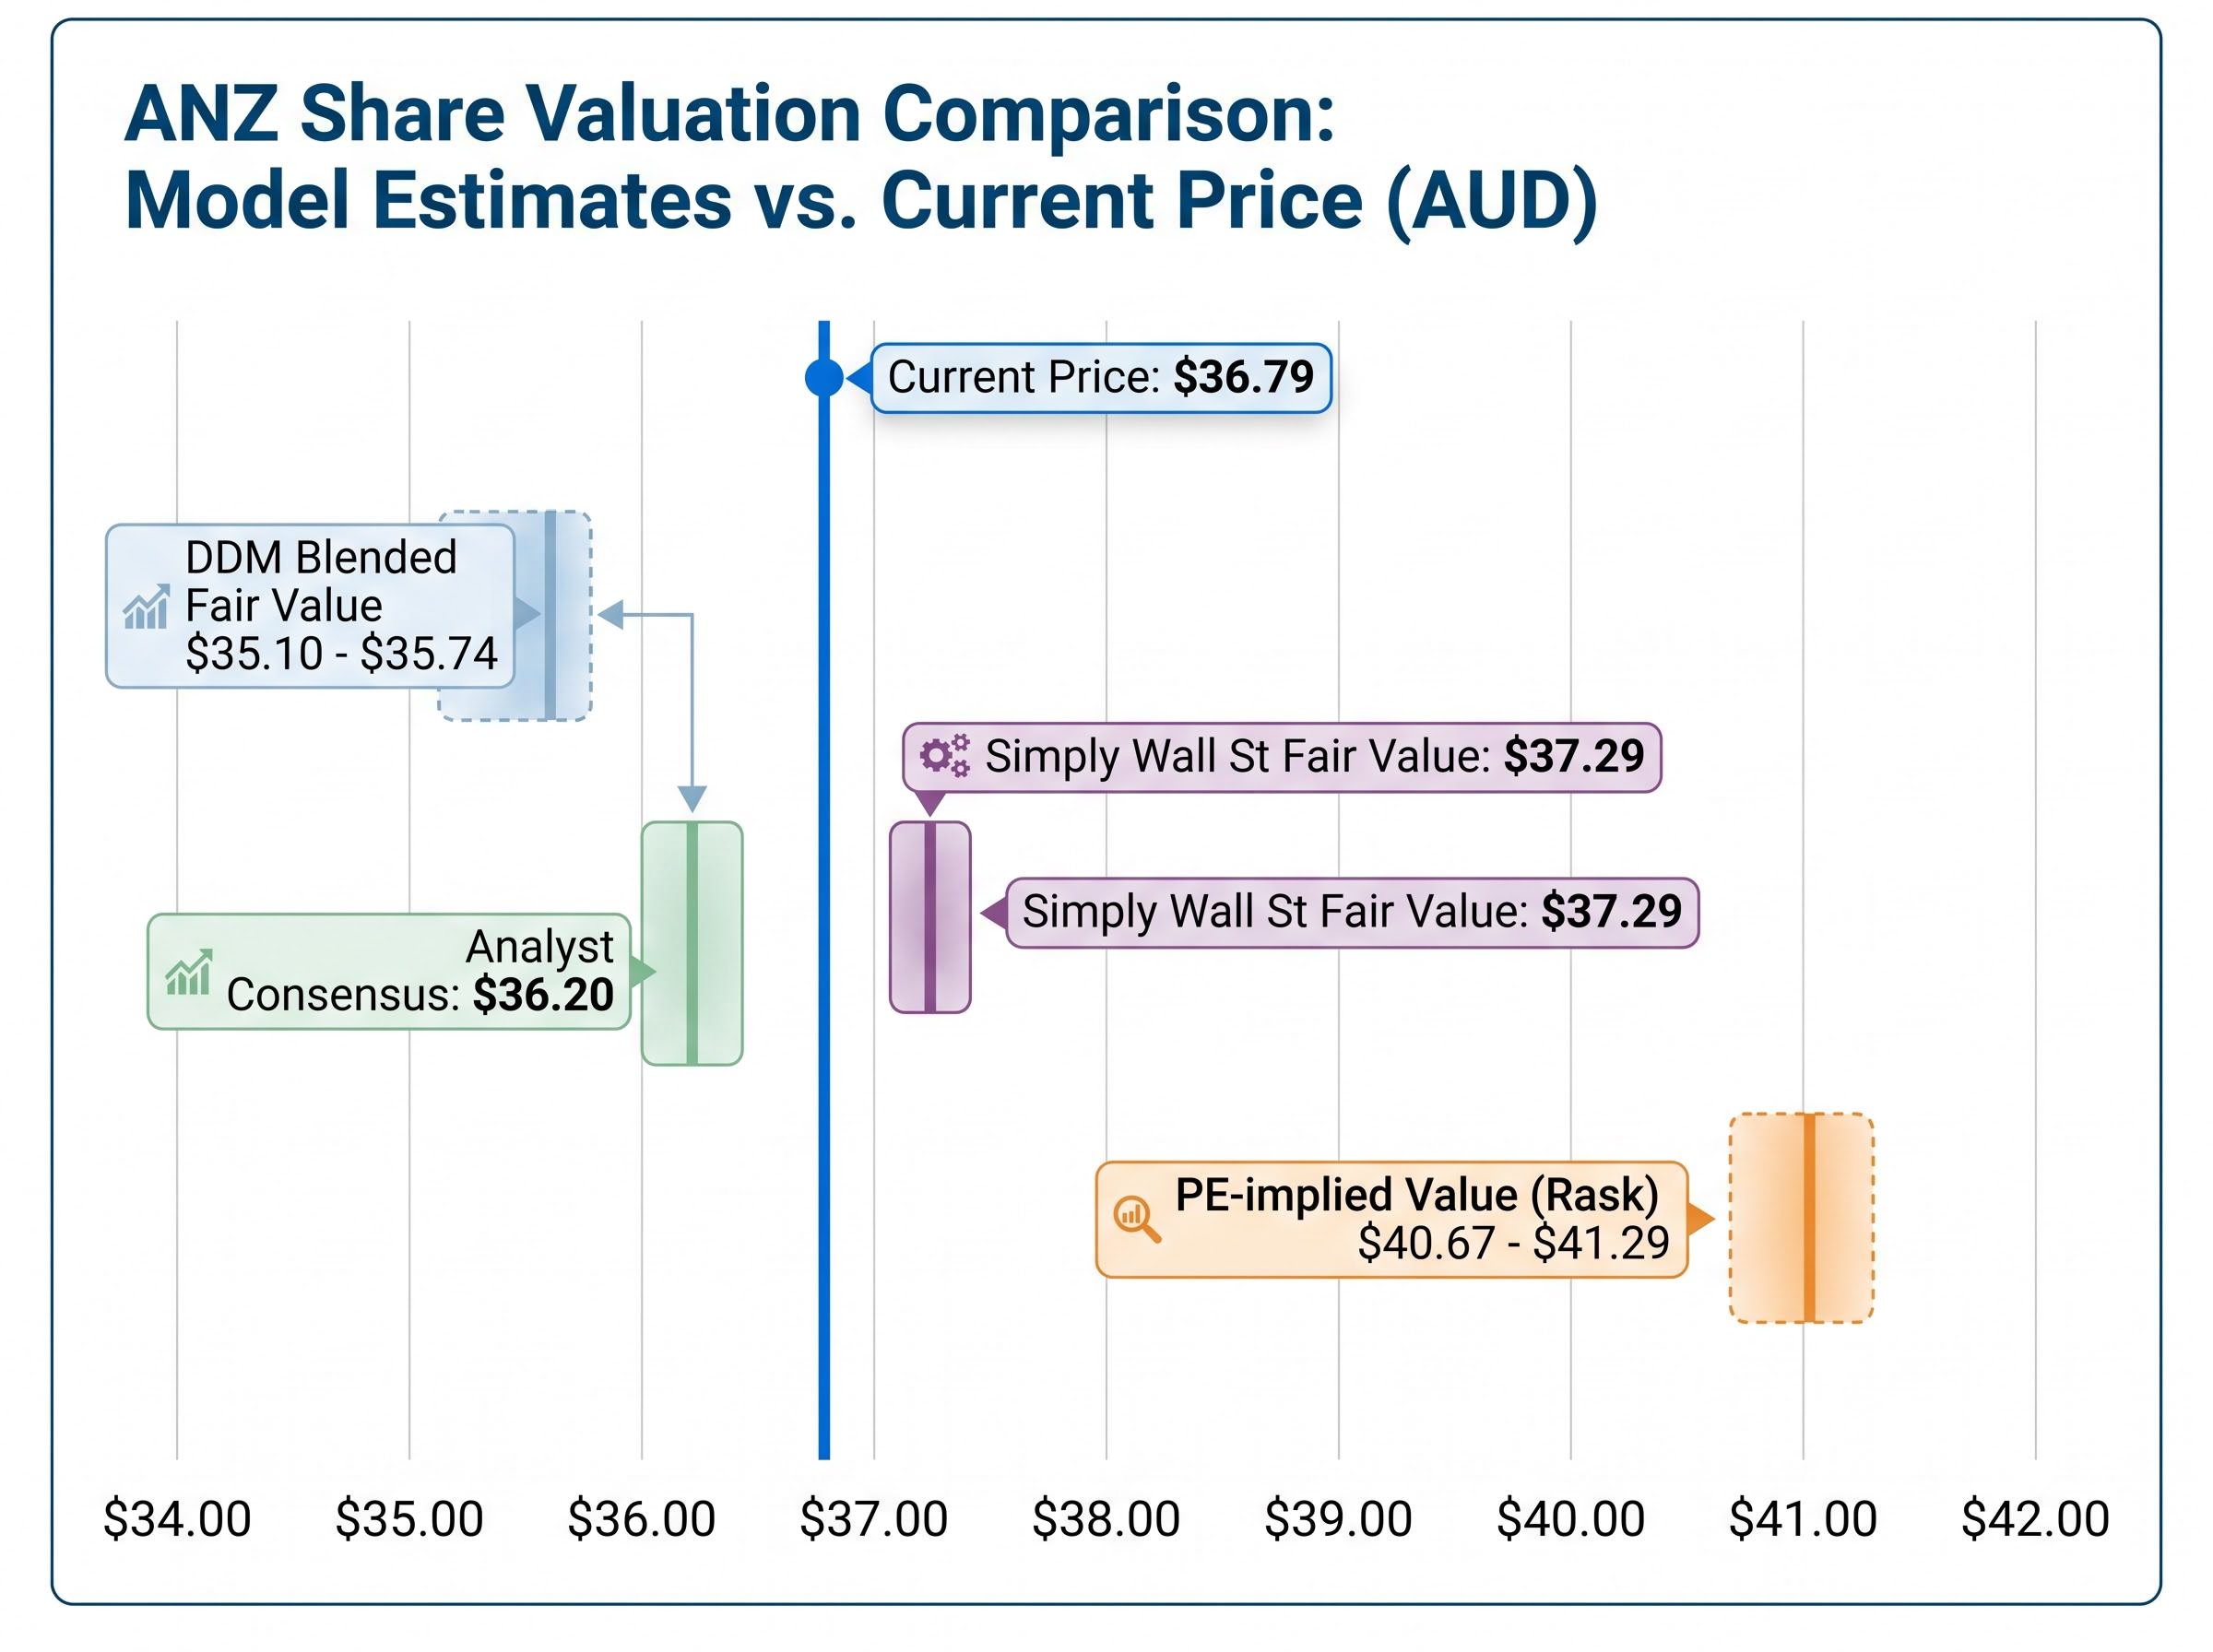
ANZ Group Holdings is trading at $36.79 as of 8 May 2026, and two standard valuation methods disagree on what the shares are worth. The price-to-earnings approach, measured against the ASX banking sector average, implies roughly 9.6% upside. The Dividend Discount Model, calibrated across a range of growth and return assumptions, suggests the shares are already at or slightly above fair value. For Australian investors evaluating ANZ’s share valuation, that tension is not an academic curiosity. It is the core question that determines whether the current price represents opportunity, fair pricing, or a stock to pass over in favour of a broader index alternative. This analysis walks through both methodologies with the actual numbers, explains why their outputs diverge, and identifies the qualitative factors that shift the probability weighting in either direction.
ANZ closed at $36.79 on 8 May 2026, trading within a $35.61-$37.35 range during the first week of the month. The stock is consolidating in the mid-to-high $36s following the release of its 1H26 interim results.
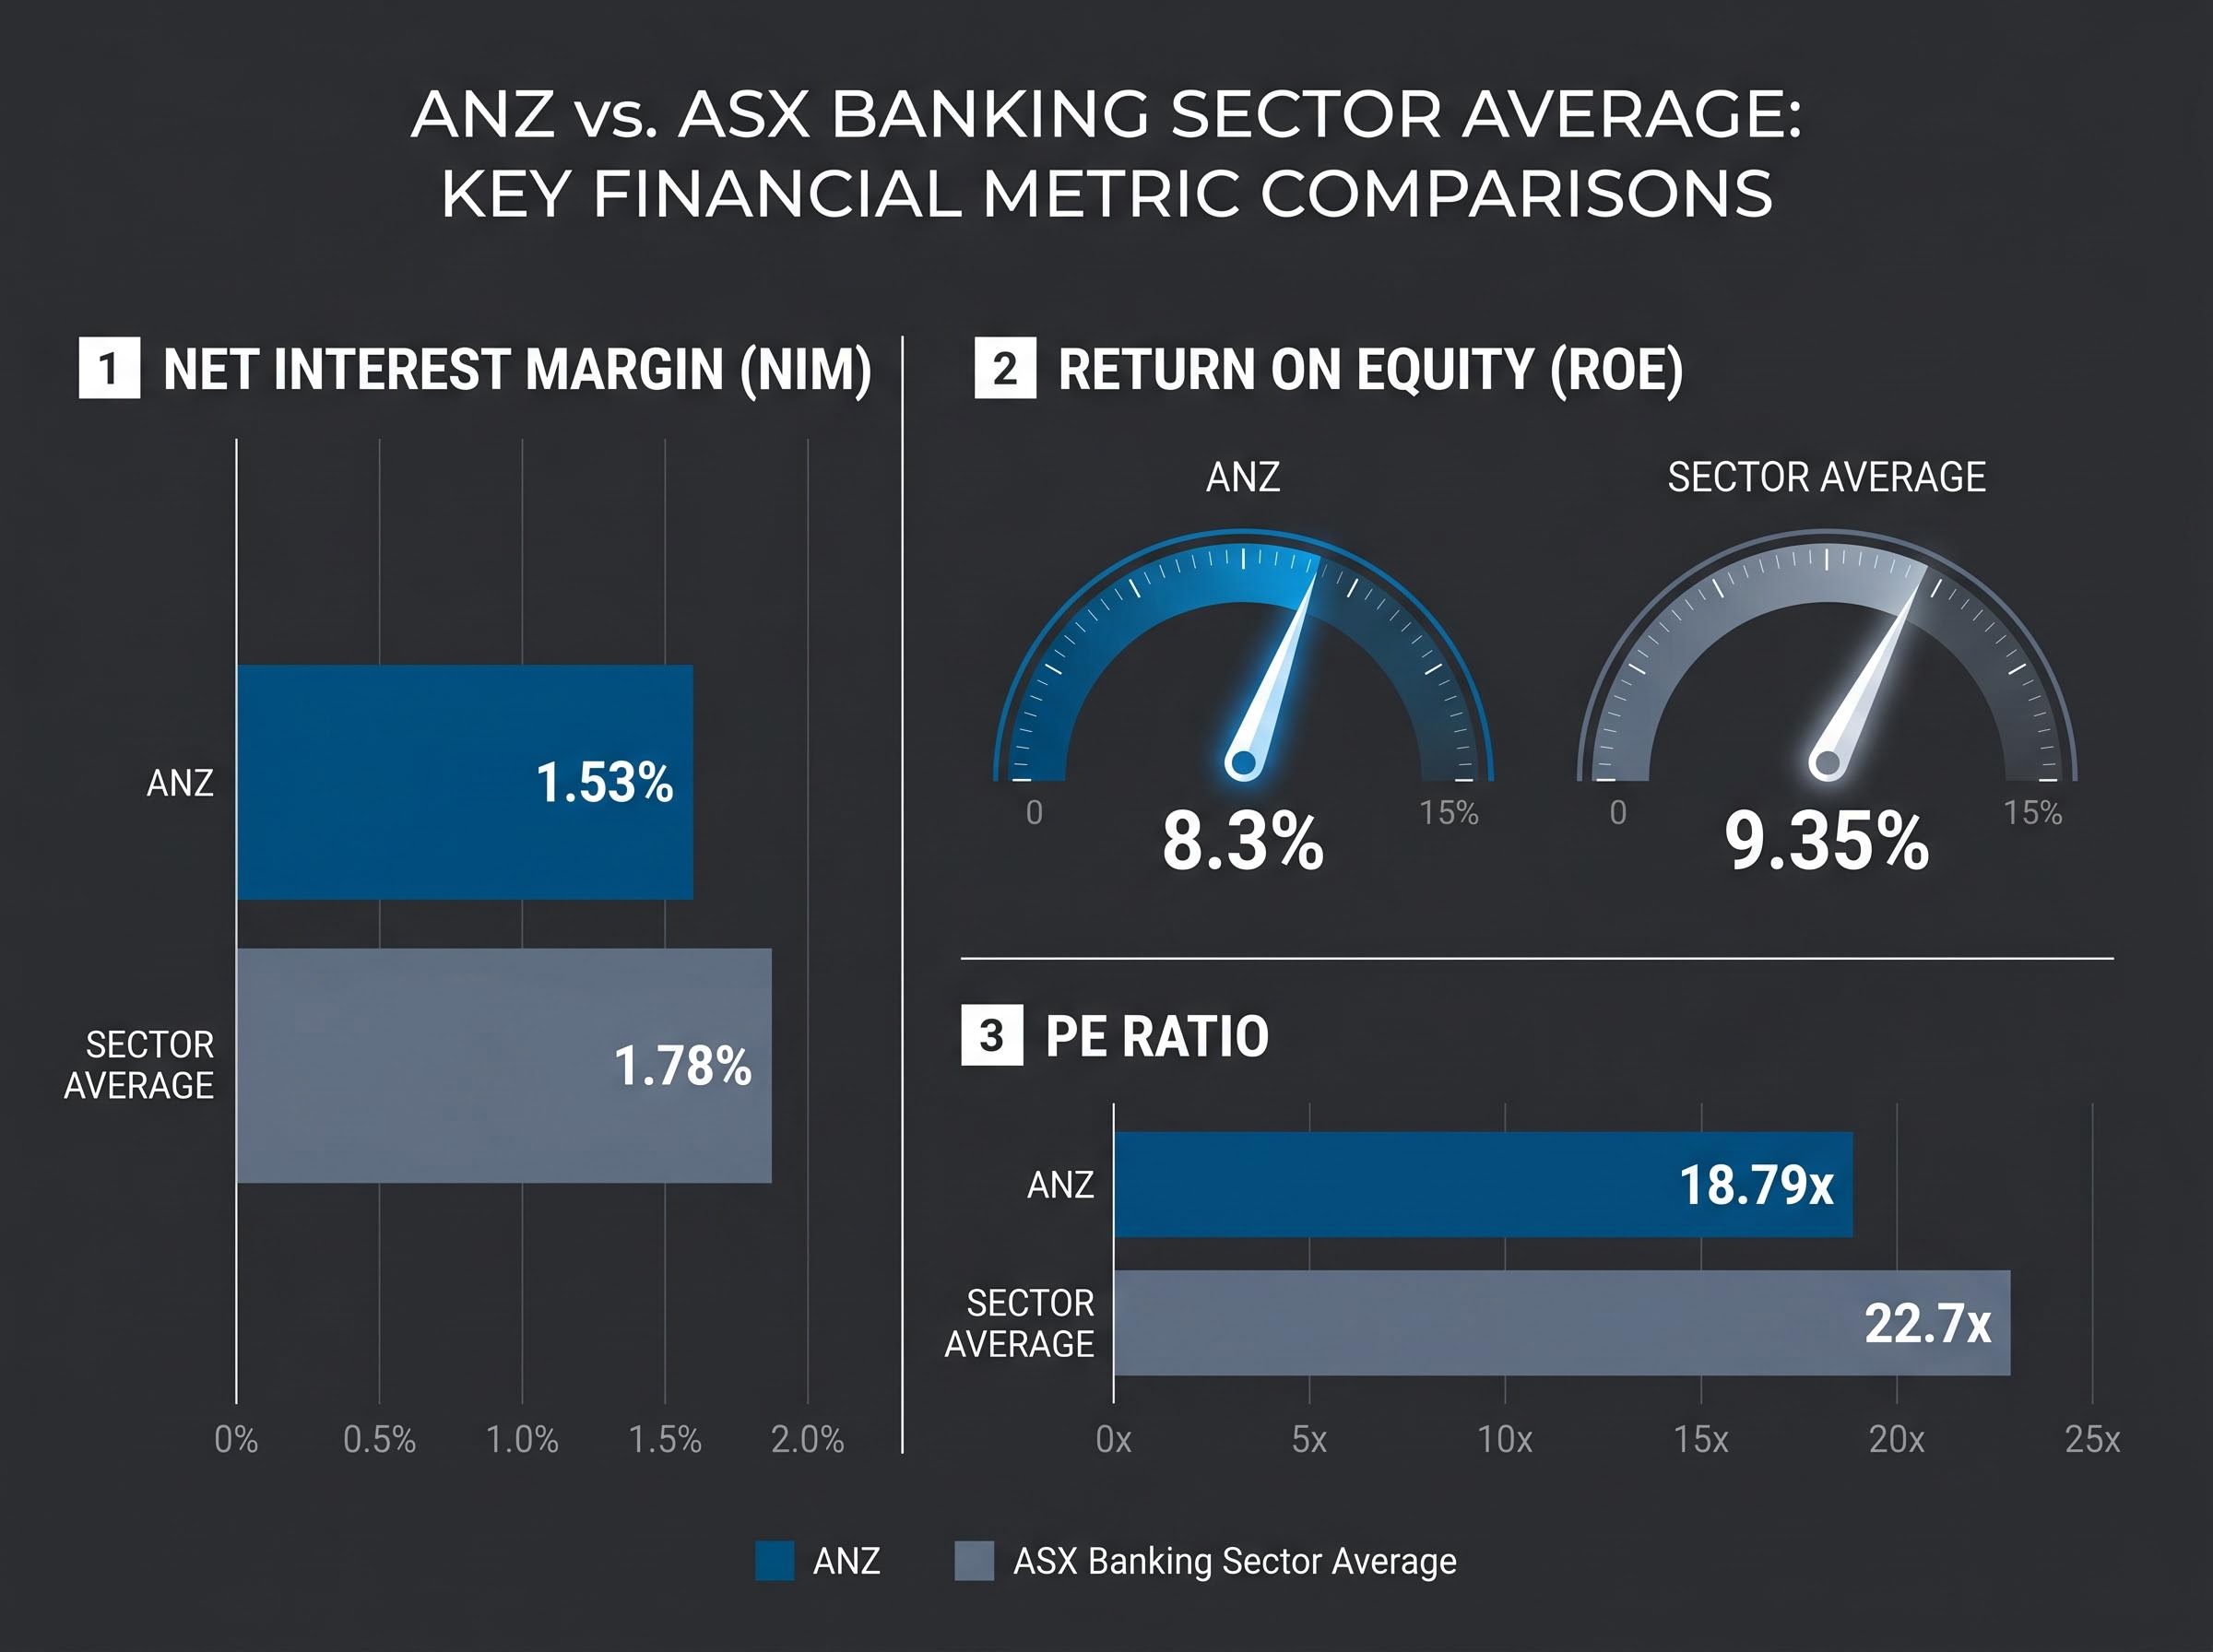
Those results delivered $3.78 billion in cash profit, an interim dividend of 83 cents per share, and a return on tangible equity (ROTE) of 11.6%. The group net interest margin (NIM) came in at 1.53%, while the latest twelve-month return on equity (ROE) stood at 8.3%.
Analyst consensus brackets the current price tightly. The average 12-month target sits at $36.20, with a range spanning $30.72 to $41.50. Simply Wall St’s fair value estimate is $37.29, and its community valuation range runs from $36.66 to $40.59. The market itself, in other words, is divided on whether value exists here.
Two operational metrics will recur throughout this analysis and deserve early attention:
“ANZ’s NIM of 1.53% sits below the stated sector average of 1.78%, a gap that shapes both the PE discount and the DDM income assumptions explored below.”
The ROE gap tells a similar story: 8.3% versus a stated sector average of 9.35%. Both figures will bear directly on the question of whether ANZ’s discount is justified or mispriced.
Return on equity analysis is most useful when read alongside margin data and peer multiples rather than in isolation, because a high ROE driven by leverage tells a different story than one earned through genuine operating efficiency.
The price-to-earnings ratio measures what the market is willing to pay for each dollar of a company’s earnings. A PE of 18.79x, as ANZ currently carries, means investors are paying approximately $18.79 for every $1 of trailing earnings. Comparing that multiple to the sector average reveals whether the market values a company more or less generously than its peers.
ANZ’s 18.79x trailing PE sits roughly 17.2% below the ASX banking sector average of 22.7x, according to Simply Wall St. Among the major peers, Commonwealth Bank commands a premium at 27.82x, while Westpac trades closer to ANZ at 19.2x.
ASX bank sector valuations have diverged sharply across the Big Four in 2026, with CBA commanding a premium multiple that reflects brand and earnings quality rather than sector-wide re-rating, a distinction that complicates the assumption that ANZ’s PE discount should converge toward a single sector average.
| Bank | PE Ratio (TTM) | Sector Comparison Note |
|---|---|---|
| ANZ | 18.79x | ~17.2% discount to 22.7x sector average |
| CBA | 27.82x | Premium multiple; highest among big four |
| Westpac | 19.2x | Closest peer multiple to ANZ |
Rask Media’s May 2026 valuation used a working sector PE of 19x and an EPS figure of $2.15, producing an implied fair value of A$40.67–$41.29 (19 x $2.15). That represents approximately 9.6% upside from the $36.79 closing price.
The Rask working EPS of $2.15 differs slightly from ANZ’s verified FY24 EPS of $2.179, likely reflecting a methodological adjustment. Using the corrected sector average PE of 22.7x against the verified EPS produces a theoretical implied value of approximately $49.46, a figure better understood as a ceiling than a base case.
Why the ceiling framing? ANZ’s ROE of 8.3% and NIM of 1.53% sit materially below the metrics that justify higher-multiple peers such as CBA. Without closing those operational gaps, a full re-rating to the sector average multiple remains unlikely. The A$40.67–$41.29 Rask estimate, which uses a more conservative sector multiple, offers a more defensible upside scenario.
The Dividend Discount Model (DDM) takes a different approach. Rather than asking what the market pays for earnings today, it asks what a share is worth based on the present value of all future dividends the holder expects to receive. For banks, which tend to pay consistent dividends, the DDM is a particularly relevant methodology.
The inputs matter more than the formula. ANZ paid a full-year dividend of $1.66 per share in FY24, and the 1H26 interim dividend of 83 cents implies the annualised run rate is being maintained. An adjusted figure of $1.69 is also used in some scenarios.
Growth rate assumptions range from 2% to 4%. Required return rate assumptions range from 6% to 11%. The interaction between these two variables produces a wide spread of individual scenario outputs.
| Growth Rate | Required Return | Implied Value |
|---|---|---|
| 2% | 6% | $42.25 |
| 3% | 7% | $41.50 |
| 4% | 8% | $41.50 |
| 2% | 11% | $18.78 |
At a low required return and modest growth, ANZ looks attractively priced. At a high required return, the shares look expensive. The blended average across the full scenario matrix, per Rask Media’s May 2026 analysis, lands at $35.10 (base dividend) to $35.74 (adjusted dividend).
“At a blended estimate of $35.10-$35.74, the DDM suggests ANZ is trading at or slightly above fair value on an income basis as of May 2026.”
The implication is clear: at $36.79, investors relying on the dividend stream alone are not obviously getting a bargain.
The PE method points to A$40.67–$41.29 upside. The DDM suggests the price is already full at $35.10-$35.74. The gap is not a flaw in either model. It reflects a structural difference in what each method measures and assumes.
Three reasons explain the divergence:
The RBA raised the cash rate by 25 basis points to 4.35% on 5 May 2026, the third consecutive hike. In theory, higher rates support bank NIMs by widening the spread between lending and deposit rates. In practice, ANZ’s NIM of 1.53% has not kept pace with the stated sector average of 1.78%, suggesting the rate tailwind is benefiting peers more than ANZ.
Consecutive rate hikes also introduce a second-order effect: rising mortgage stress. If loan growth slows or credit losses increase, both the earnings base (which the PE method relies on) and the dividend stream (which the DDM relies on) face downward pressure.
Rising loan provisions across the sector represent a specific earnings headwind that neither the PE multiple nor the DDM growth assumption captures cleanly, with total Big Four provisions forecast to nearly double from approximately $2.4 billion in FY25 to $5.5 billion by FY27 as housing price softness and Stage 3 loan stress accumulate.
The APRA Promontory report on ANZ’s non-financial risk management, released 1 May 2026, adds incremental regulatory scrutiny that neither model explicitly prices. The analyst target range of $30.72-$41.50, a spread of nearly $11, reflects this genuine uncertainty.
Valuation models produce numbers. Investment decisions require judgement about factors those models cannot capture with precision.
ANZ’s ROE of 8.3% versus the sector average of 9.35% represents a 1.05 percentage point structural gap. Neither PE mean reversion nor a modest DDM dividend lift fully addresses it. The question for long-term holders is whether management has a credible path to close that gap.
The Suncorp Bank acquisition, completed 31 July 2024, remains in integration. A $196 million accounting adjustment was recorded in 2H24 results, and the future of the Suncorp Bank brand has not been decided. Integration execution will influence both cost efficiency and revenue synergy outcomes over the next 12-24 months.
Separately, HSBC is pursuing a $26 billion Australian loan portfolio sale, with first-round bids expected in late April 2026. ANZ has previously been reported as a potential bidder, though no confirmation of active participation exists as of May 2026. A successful bid would materially alter ANZ’s balance sheet exposure.
Before acting on either the PE or DDM output, investors may wish to assess:
The question is not simply whether ANZ is cheap. It is whether ANZ represents a better risk-adjusted allocation than a diversified ASX exposure.
The Vanguard Australian Shares Index ETF (ASX: VAS) provides broad exposure to the ASX 300, including all four major banks, at low cost and without the stock-specific regulatory and integration risk that ANZ carries in 2026.
Investors wanting to model how the rate cycle might evolve through the remainder of 2026 will find our detailed coverage of the RBA rate path through 2026, which examines futures market pricing for a potential fourth hike, the key CPI and labour force data releases that will determine the July meeting outcome, and the differential sector impact across REITs, resources, and banking stocks.
The valuation picture, summarised across all methods reviewed:
At $36.79, ANZ’s FY24 dividend yield is approximately 4.51% ($1.66 / $36.79). Value-oriented investors with a medium-to-long horizon may find the PE discount compelling if they believe ANZ can narrow the operational gap with peers. Income investors, at the current price, are paying at or above DDM fair value and need dividend growth to generate a return beyond the yield.
“The two methods define a range of approximately $35.10-$40.67; where ANZ trades within that range over the next 12 months depends on whether it can close the gap on NIM, ROE, and the sector multiple.”
ANZ is not obviously cheap. It is not obviously expensive. The PE method reveals a real 17.2% discount to the sector average and a credible path to A$40.67–$41.29 if re-rating occurs. The DDM reveals that the current dividend stream does not support the $36.79 price without growth assumptions that ANZ’s operational metrics have yet to justify.
For the bullish case to hold, investors would need to see:
For the bearish case to materialise:
The honest conclusion is that ANZ’s fair value likely sits within the $35.10-$40.67 range that the two methods define. For investors who want ASX bank exposure without the stock-specific integration and regulatory risk, VAS remains a structurally simpler alternative. For those who believe the PE discount is temporary rather than structural, ANZ offers a defined upside thesis with identifiable catalysts. The decision rests on which risk the investor is prepared to take.
This article is for informational purposes only and should not be considered financial advice. Investors should conduct their own research and consult with financial professionals before making investment decisions. Past performance does not guarantee future results. Financial projections are subject to market conditions and various risk factors.
—
The Dividend Discount Model (DDM) estimates a share's fair value based on the present value of all future dividends expected to be paid. Applied to ANZ using a base dividend of $1.66 per share and a range of growth and return assumptions, the blended DDM fair value lands at $35.10-$35.74, suggesting ANZ is trading at or slightly above fair value at $36.79.
ANZ's trailing PE of 18.79x sits approximately 17.2% below the ASX banking sector average of 22.7x, which analysts attribute to ANZ's below-average return on equity of 8.3% versus a sector average of 9.35%, and a net interest margin of 1.53% compared to the sector average of 1.78%.
At the $36.79 share price, ANZ's FY24 full-year dividend of $1.66 per share implies a dividend yield of approximately 4.51%. Income investors are currently paying at or above the DDM fair value range, meaning dividend growth would be needed to generate a return beyond the yield itself.
Higher rates can theoretically widen bank net interest margins, but ANZ's NIM of 1.53% has not kept pace with the sector average of 1.78%, suggesting peers are capturing more of the rate tailwind. Consecutive RBA hikes also raise the risk of mortgage stress, which could pressure both earnings and dividends, compressing outputs from both the PE and DDM valuation methods.
The bullish case for ANZ reaching the PE-implied range of $40.67-$41.29 depends on NIM expansion toward the 1.78% sector average, successful integration of the Suncorp Bank acquisition delivering cost and revenue synergies, and a re-rating of ANZ's PE multiple closer to sector peers.