ATEC Is Down 36%: Opportunity or a Broken Thesis?
48 mins ago

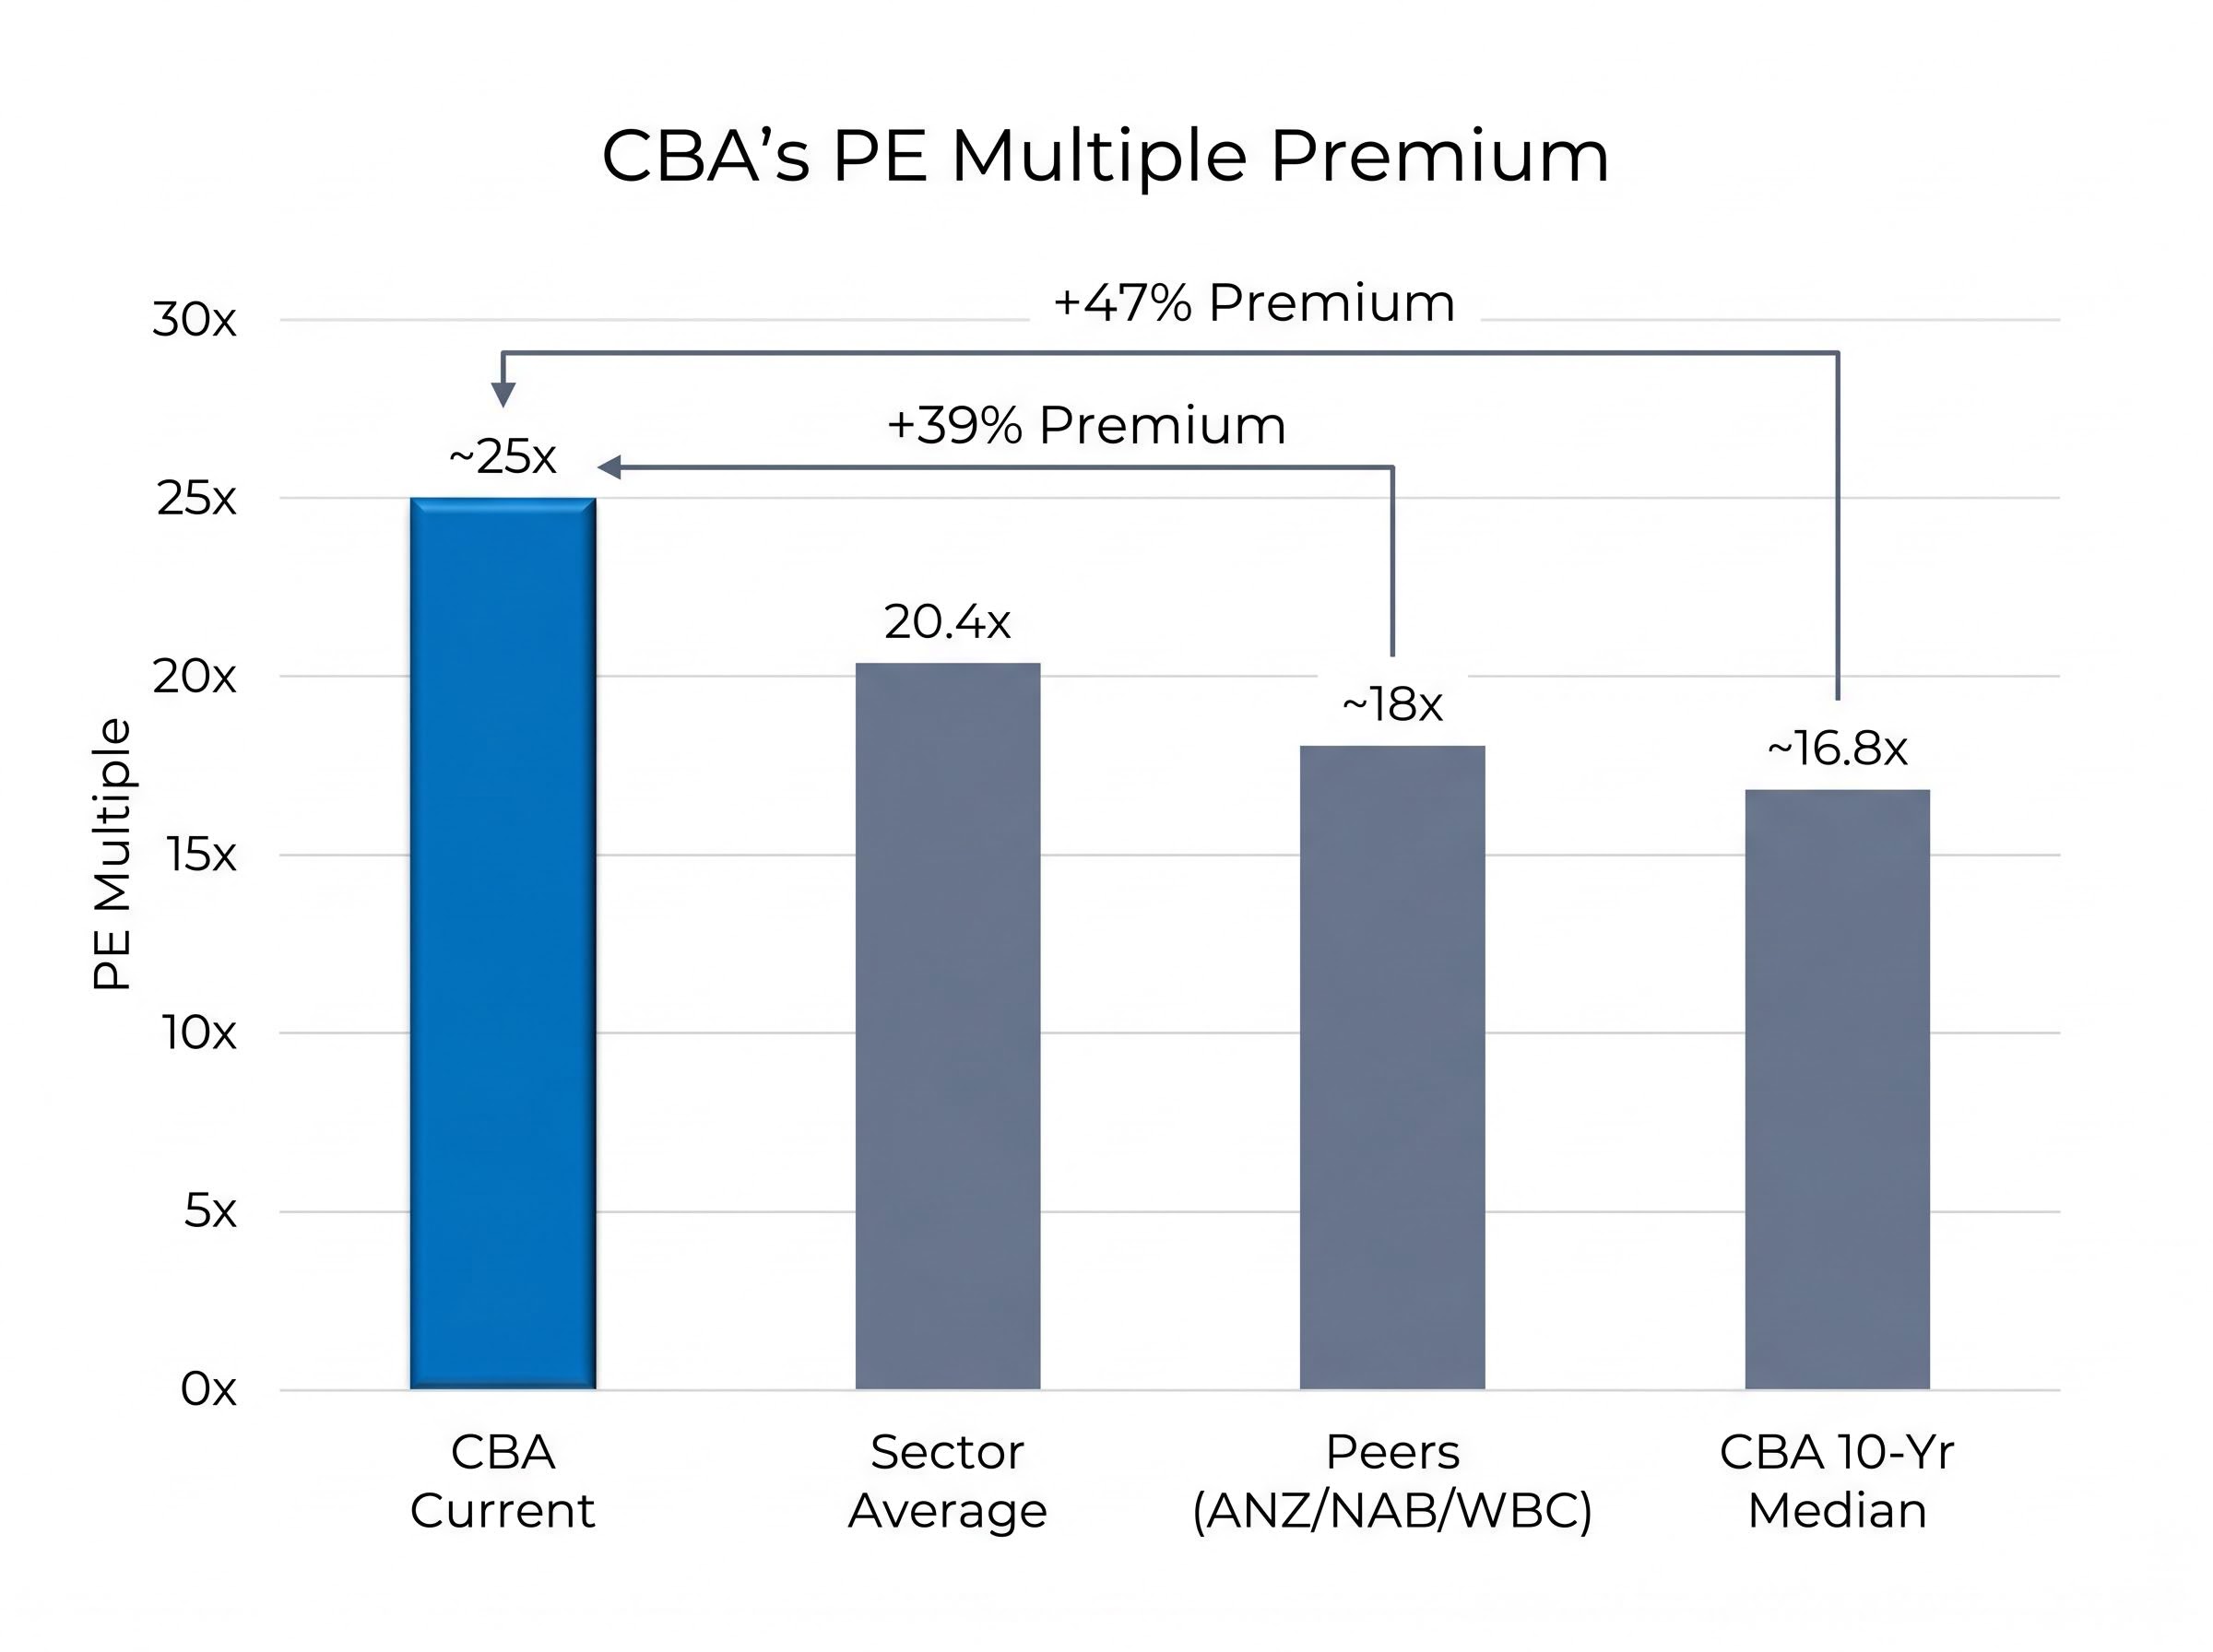
At roughly A$155 per share, Commonwealth Bank of Australia trades at approximately 25 times earnings. Its own 10-year median price-to-earnings ratio sits closer to 17 times. That gap, a difference of nearly 47% above CBA’s historical norm, is more than a statistical curiosity. It carries real capital allocation consequences for every Australian investor deciding whether to buy, hold, or reduce exposure to the country’s most discussed stock.
CBA’s share price has pulled back from highs above A$175 in mid-2025, yet it remains well above every major broker price target, which range from approximately A$114 to A$149 as of May 2026. The valuation debate has been live throughout 2025 and into 2026, and neither the pullback nor the modest EPS growth trajectory has resolved it. What follows applies two foundational valuation methods, the PE ratio and the Dividend Discount Model, to CBA’s reported FY24 figures. Each model is built step by step, with its assumptions made visible, so readers can see not just what the outputs say but how sensitive those outputs are to reasonable shifts in the inputs.
Banks are unusual equity assets. Their earnings are relatively stable, their dividend policies are predictable, and their growth rates are modest. That combination makes two valuation tools particularly well suited to the task: the price-to-earnings ratio, which measures what the market is willing to pay for each dollar of current earnings, and the Dividend Discount Model (DDM), which estimates what a stock is worth based on the present value of its future dividend stream.
Neither model produces a precise answer. Both produce ranges, and those ranges shift meaningfully with modest changes in assumptions. That variability is a feature, not a limitation. It reveals how much of a stock’s price rests on earnings versus expectations.
The calculations that follow are anchored to three figures:
FY26 consensus EPS of A$6.25-A$6.50 is referenced for context, but FY24 cash earnings serve as the primary basis because they allow direct comparison with historical valuation norms.
CBA’s H1 FY2026 earnings and dividend update, a record cash net profit after tax of A$5.445 billion and a 4% interim dividend increase to A$2.35 per share fully franked, provide the most recent data point against which to benchmark the FY24 figures used throughout this analysis, and suggest that consensus EPS growth of 2-4% is tracking broadly on course.
The trailing PE ratio is arithmetic. Divide CBA’s current share price by its earnings per share and the result is approximately 25x. That number, on its own, means little. It gains meaning only when measured against benchmarks.
The first benchmark is the Australian banking sector average. According to Simply Wall St data from 2026, the sector average PE is 20.4x. Applying that multiple to CBA’s FY24 cash EPS of A$5.63 produces an implied share value of approximately A$115.
The second benchmark is CBA’s own history. Over the past decade, CBA’s median PE has been approximately 16.8-16.9x (CompaniesMarketCap and Wisesheets data). At that multiple, CBA’s implied value falls to approximately A$95-A$96.
The third benchmark is CBA’s peer group. ANZ, Westpac, and NAB all trade at approximately 18x trailing earnings as of May 2026. CBA’s 25x multiple represents a 39% premium to those peers.
| Benchmark | PE multiple | Implied CBA value |
|---|---|---|
| CBA current trailing PE | ~25x | A$154-A$156 (market price) |
| Sector average (Simply Wall St) | 20.4x | ~A$115 |
| CBA 10-year median | ~16.8x | ~A$95 |
| Peer average (ANZ/NAB/WBC) | ~18x | ~A$101 |
“CBA is expensive based on its Price-To-Earnings Ratio (25.1x) compared to the estimated Fair Price-To-Earnings Ratio (20.3x).” — Simply Wall St, 2026
The pattern is consistent across every benchmark. CBA’s current price embeds a premium of 39% to peers and approximately 47% to its own decade-long median. The question is whether that premium is justified.
PE ratios are backward-looking. They capture what the market pays for past earnings but say nothing about dividend income, growth assumptions, or the value of franking credits to Australian shareholders. The Dividend Discount Model adds the forward-looking layer that PE cannot provide.
For investors who want to stress-test these outputs further, our dedicated guide to ASX bank stock valuation methods covers the PE, P/B, DDM, and DCF frameworks in full, including how APRA capital requirements and credit cycle distortions affect each model’s reliability for Australian bank shares specifically.
Before reaching for a verdict, the bull case deserves a full hearing. Analysts across the major brokerages broadly agree that CBA warrants some premium to peers. The disagreement is over degree, not direction.
Five structural factors underpin that consensus:
These are not speculative claims. They are structural features that CBA has demonstrated across market cycles. The AFR has quoted fund managers describing CBA as exactly this kind of asset.
“A great business at the wrong price.” — Fund manager characterisation, AFR, 2025-2026
Citi’s commentary frames the tension directly: CBA’s current valuation implies “perfection” on asset quality and revenue growth. Macquarie has noted better relative value in ANZ, NAB, and Westpac. The premium is real. Whether the current degree of premium, at 25x earnings, is warranted is the harder question.
The DDM estimates a stock’s intrinsic value using a single formula: the next expected dividend, divided by the difference between the required rate of return and the expected dividend growth rate.
In plain terms, the model asks: how much would an investor pay today for CBA’s future dividend stream, given a specific growth expectation and a specific return requirement?
The base case uses CBA’s FY24 dividend of A$4.65, a required return of 9% (a standard Australian equity cost of equity, appropriate for a concentrated single-stock position), and a dividend growth rate of 3% per annum (within the KPMG consensus range of 2-4% for major Australian banks). The resulting estimate sits at approximately A$77.50 under a strict single-stage model, though blended and multi-stage approaches in published analyses (such as Rask Media) produce base estimates closer to A$98.
The sensitivity table below shows how dramatically the output shifts with modest assumption changes.
| Growth rate | 8% discount rate | 9% discount rate | 10% discount rate |
|---|---|---|---|
| 2% | A$77.50 | A$66.43 | A$58.13 |
| 3% | A$93.00 | A$77.50 | A$66.43 |
| 4% | A$116.25 | A$93.00 | A$77.50 |
The range spans from below A$60 to above A$116 on the cash dividend alone, depending entirely on two assumptions. Published multi-stage analyses (including Rask Media’s blended DDM) produce anchor estimates in the A$98-A$119 range under moderate scenarios. The model’s power and its uncertainty are visible in the same table.
For Australian resident investors, particularly superannuation funds in accumulation or pension phase, CBA’s fully franked dividend carries attached tax credits (franking credits) that increase the effective dividend received. The gross dividend, including franking credits at the 30% corporate tax rate, is approximately A$6.80 per share.
Applying this gross figure to the DDM at a 7% discount rate and 3% growth rate produces an upper-end estimate of approximately A$143.80. This scenario does not apply universally; non-resident investors, for example, cannot claim franking credits. But for eligible Australian shareholders, it represents the most generous plausible DDM output.
Both models are estimation tools, and each carries structural blind spots.
PE comparisons assume that the sector average is a reasonable anchor for CBA. But the sector average includes banks with meaningfully different risk profiles, funding structures, and growth trajectories. CBA’s consistency may genuinely warrant a structural premium above peers, which means a sector-average PE could systematically understate CBA’s fair value.
The DDM’s limitation is more fundamental. Small changes in the discount rate or growth rate, as the sensitivity table showed, produce wildly different outputs. Holding those assumptions constant in perpetuity, as the single-stage DDM requires, is a simplification that compounds over time.
Four bank-specific factors sit outside both models entirely:
Consensus EPS growth for the major Australian banks is only 2-4% per annum according to KPMG, and CBA’s payout ratio has historically been 60-75% of cash earnings. Together, these figures constrain the upper bound of reasonable DDM growth inputs and suggest limited room for dividend growth beyond earnings growth.
KPMG’s major bank half-year results analysis for 2026 documents net interest margin compression across the four majors, providing independent industry confirmation that the peak margin environment from the rate-tightening cycle is unwinding and that the 2-4% EPS growth consensus reflects a structurally constrained earnings outlook.
Past performance does not guarantee future results. Financial projections are subject to market conditions and various risk factors.
Two models, multiple benchmarks, and a full sweep of broker targets converge on the same directional conclusion.
| Method | Implied value |
|---|---|
| PE at sector average (20.4x) | ~A$115 |
| PE at CBA 10-year median (16.8x) | ~A$95 |
| DDM base case (blended, Rask) | ~A$98 |
| DDM gross dividend scenario | ~A$144 |
| Broker consensus low (Morgans) | A$119 |
| Broker consensus high (Macquarie) | A$149 |
The intrinsic value range under conservative-to-moderate assumptions clusters between approximately A$95 and A$115. The most generous DDM scenario, using gross dividends and a lower discount rate, extends the upper bound to A$144. Even there, the implied value sits below CBA’s current trading price.
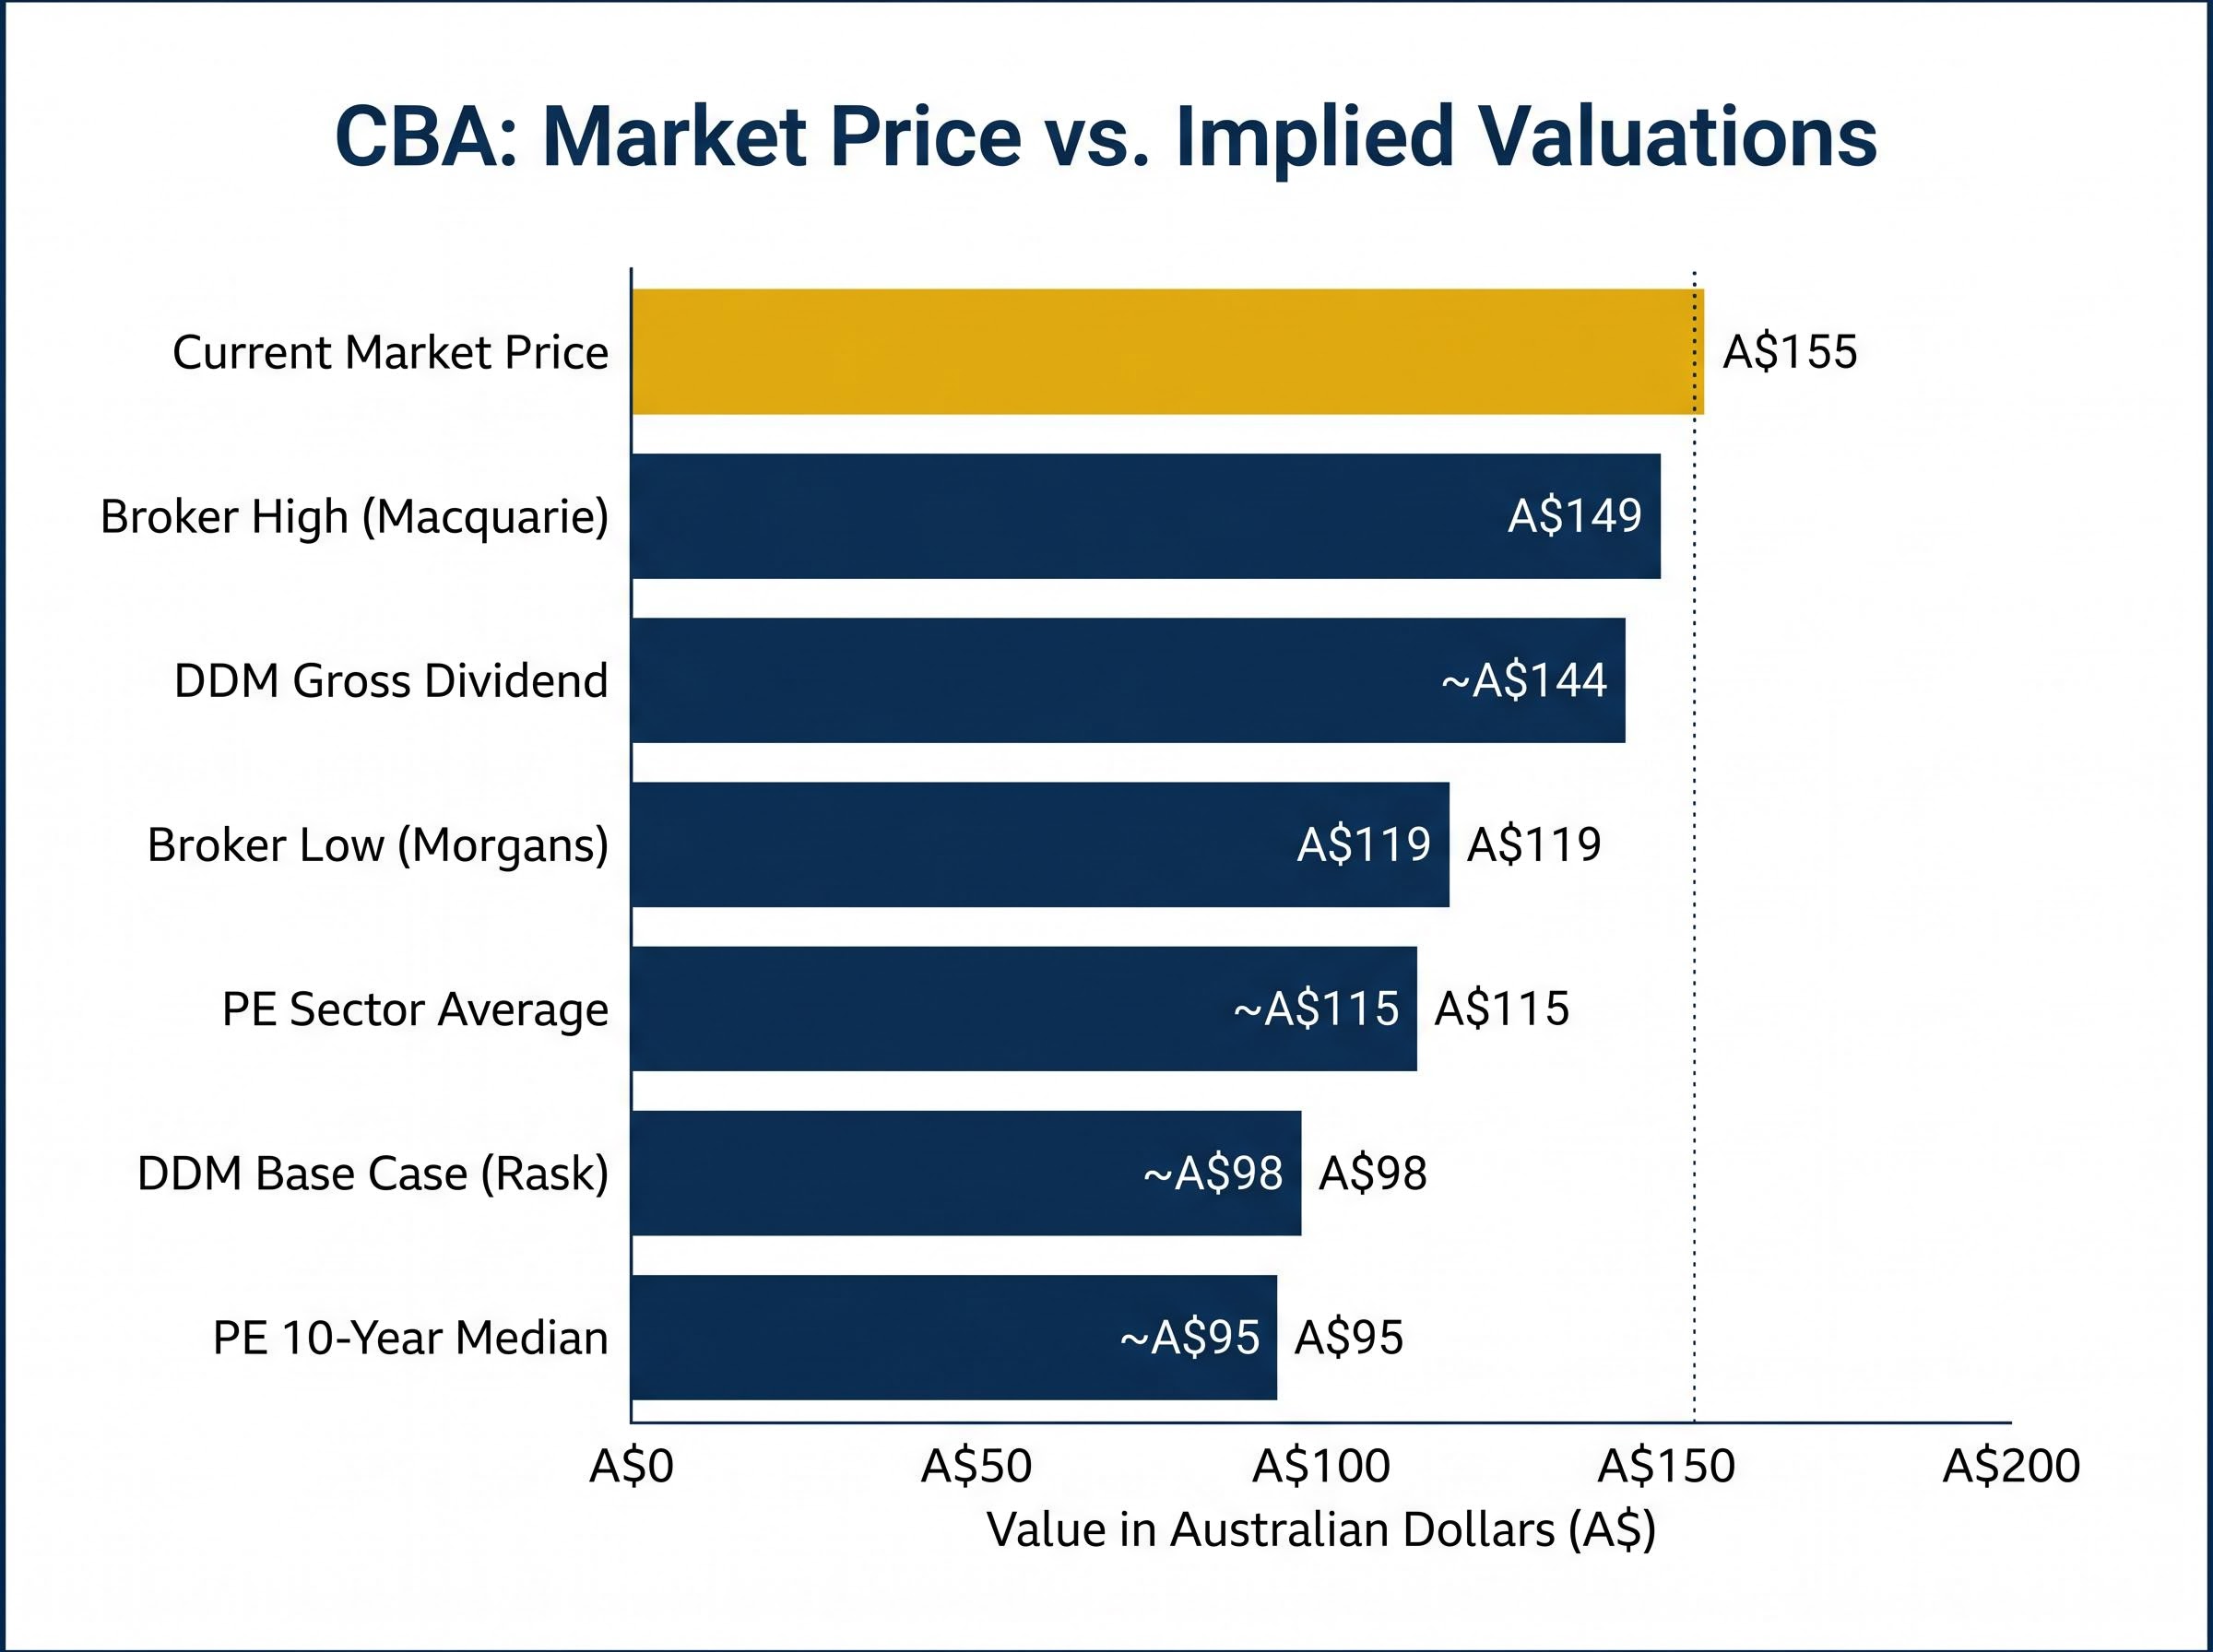
Broker targets tell the same story. Morgans targets A$119.40. Macquarie sits at A$149.10. The broader UBS, Morgan Stanley, and Macquarie range spans approximately A$114-A$130. Every professional target published as of May 2026 sits at or below the current market price.
“A quality bank priced accordingly.” — Consensus broker characterisation, May 2026
For existing long-term holders, CBA’s quality franchise and reliable fully franked dividend stream remain a defensible reason to maintain exposure. For new entrants at mid-A$150s pricing, the valuation arithmetic is less forgiving. Capital growth from these levels requires assumptions about premium expansion that CBA’s own 10-year record does not support.
Every valuation method applied here, PE benchmarking, DDM modelling, and broker consensus, points to a meaningful gap between CBA’s current market price and its estimated intrinsic value. That gap has narrowed from the extremes of mid-2025 but has not closed.
For long-term holders, CBA’s franchise quality, superior returns, and dividend reliability provide a rational basis for maintaining the position. The income stream, particularly when franking credits are factored in, remains among the most dependable on the ASX.
For investors considering new capital at current levels, the case requires more caution. The valuation picture could shift if CBA’s EPS growth accelerates beyond the current 2-4% consensus or if the broader market re-rates Australian bank multiples higher. These remain speculative scenarios rather than base cases.
Relative value across the Big Four has diverged sharply in 2026, with ANZ the only major bank where buy ratings outnumber sells, while CBA holds all 14 analyst coverage positions as sells, a distribution that gives portfolio investors a practical reason to consider weighting within the sector rather than treating it as a monolithic allocation.
The decision is not whether CBA is a quality business. It is whether that quality is already more than fully reflected in the price.
This article is for informational purposes only and should not be considered financial advice. Investors should conduct their own research and consult with financial professionals before making investment decisions.
As of May 2026, Commonwealth Bank of Australia trades at approximately 25 times trailing earnings, based on a share price in the mid-A$150s and FY24 cash EPS of A$5.63. This is significantly above its 10-year median PE of around 16.8x and the Australian banking sector average of 20.4x.
The Dividend Discount Model (DDM) estimates a stock's intrinsic value by calculating the present value of its future dividend stream. Applied to CBA's FY24 dividend of A$4.65, base case DDM estimates range from approximately A$77.50 under a strict single-stage model to around A$98 under blended multi-stage approaches, both well below the current market price.
CBA pays fully franked dividends, meaning eligible Australian resident shareholders receive attached tax credits that increase the effective dividend received. Using the gross dividend of approximately A$6.80 per share (including franking credits at the 30% corporate tax rate), the most generous DDM scenario produces an upper-end intrinsic value estimate of around A$143.80.
As of May 2026, broker price targets for CBA range from approximately A$114 to A$149, with Morgans targeting A$119.40 and Macquarie sitting at A$149.10. Every published professional target sits at or below the current market price of mid-A$150s.
CBA commands a premium over peers like ANZ, NAB, and Westpac due to structural advantages including the largest retail banking customer base in Australia, superior return on equity of approximately 13.3%, stronger asset quality, technology leadership in digital banking, and a long track record of reliable fully franked dividends. The debate among analysts centres on whether the current 39% premium to peer multiples is justified in degree.