Start with the arithmetic, because the arithmetic is where the whole argument lives. How much annual revenue would the global economy need to generate from AI products and services to earn a reasonable return on everything currently being spent to build the infrastructure behind them?
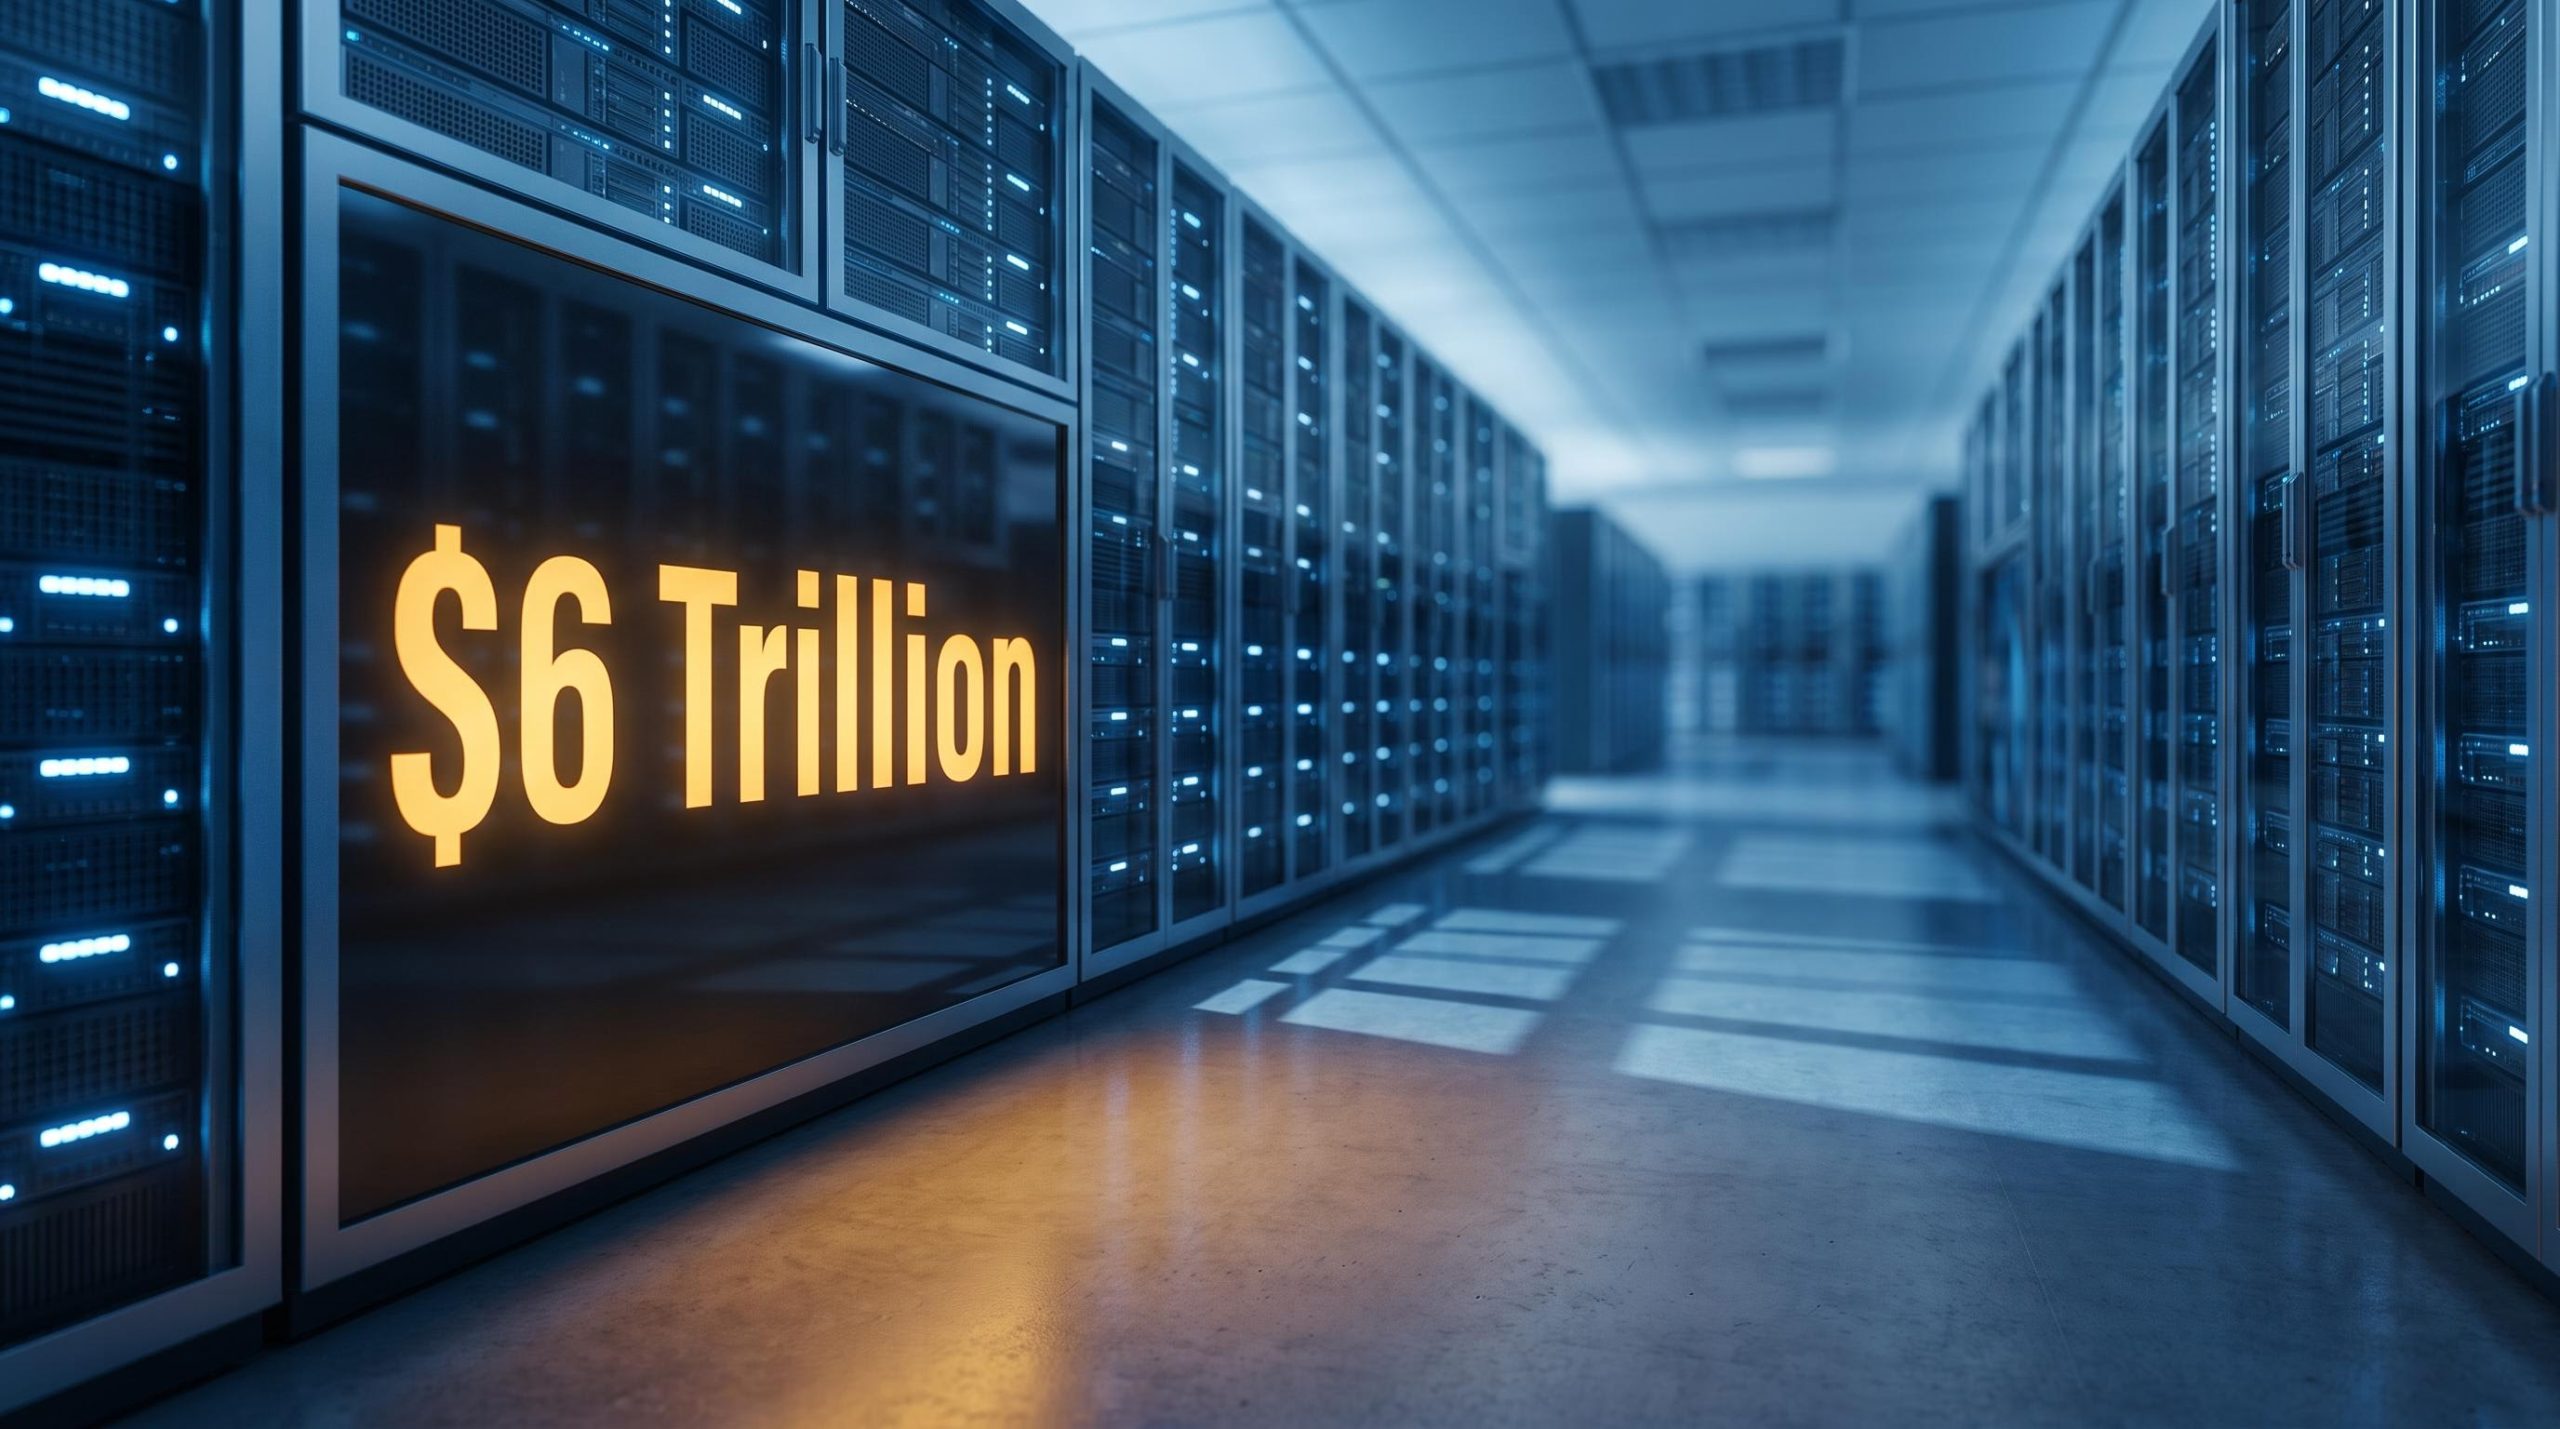
The answer, according to a September 2026 whitepaper from London asset manager CGAM, is roughly $6 trillion a year. That is the demand-side number the rest of this analysis interrogates.
The whitepaper, co-authored by Co-Chief Investment Officer Chris Clothier and Portfolio Manager Emma Moriarty, sits at the centre of a broader thesis about AI bubble risk: that the current investment cycle is being held up by optimistic demand assumptions, dangerously concentrated earnings, modest productivity payoffs, and financing structures that most investors never see. Together, CGAM argues, these create genuine downside for anyone holding AI-linked equities.
What follows breaks down those four structural concerns, one at a time, and layers them against data from J.P. Morgan, Goldman Sachs, the IMF, and RBC. The aim is not a prediction. It is a framework for working out whether your own portfolio is more exposed to this risk than you realise.
The $6 trillion problem: can AI demand ever catch the spending?
Consider the capital first, because the scale is what makes the demand question so uncomfortable.
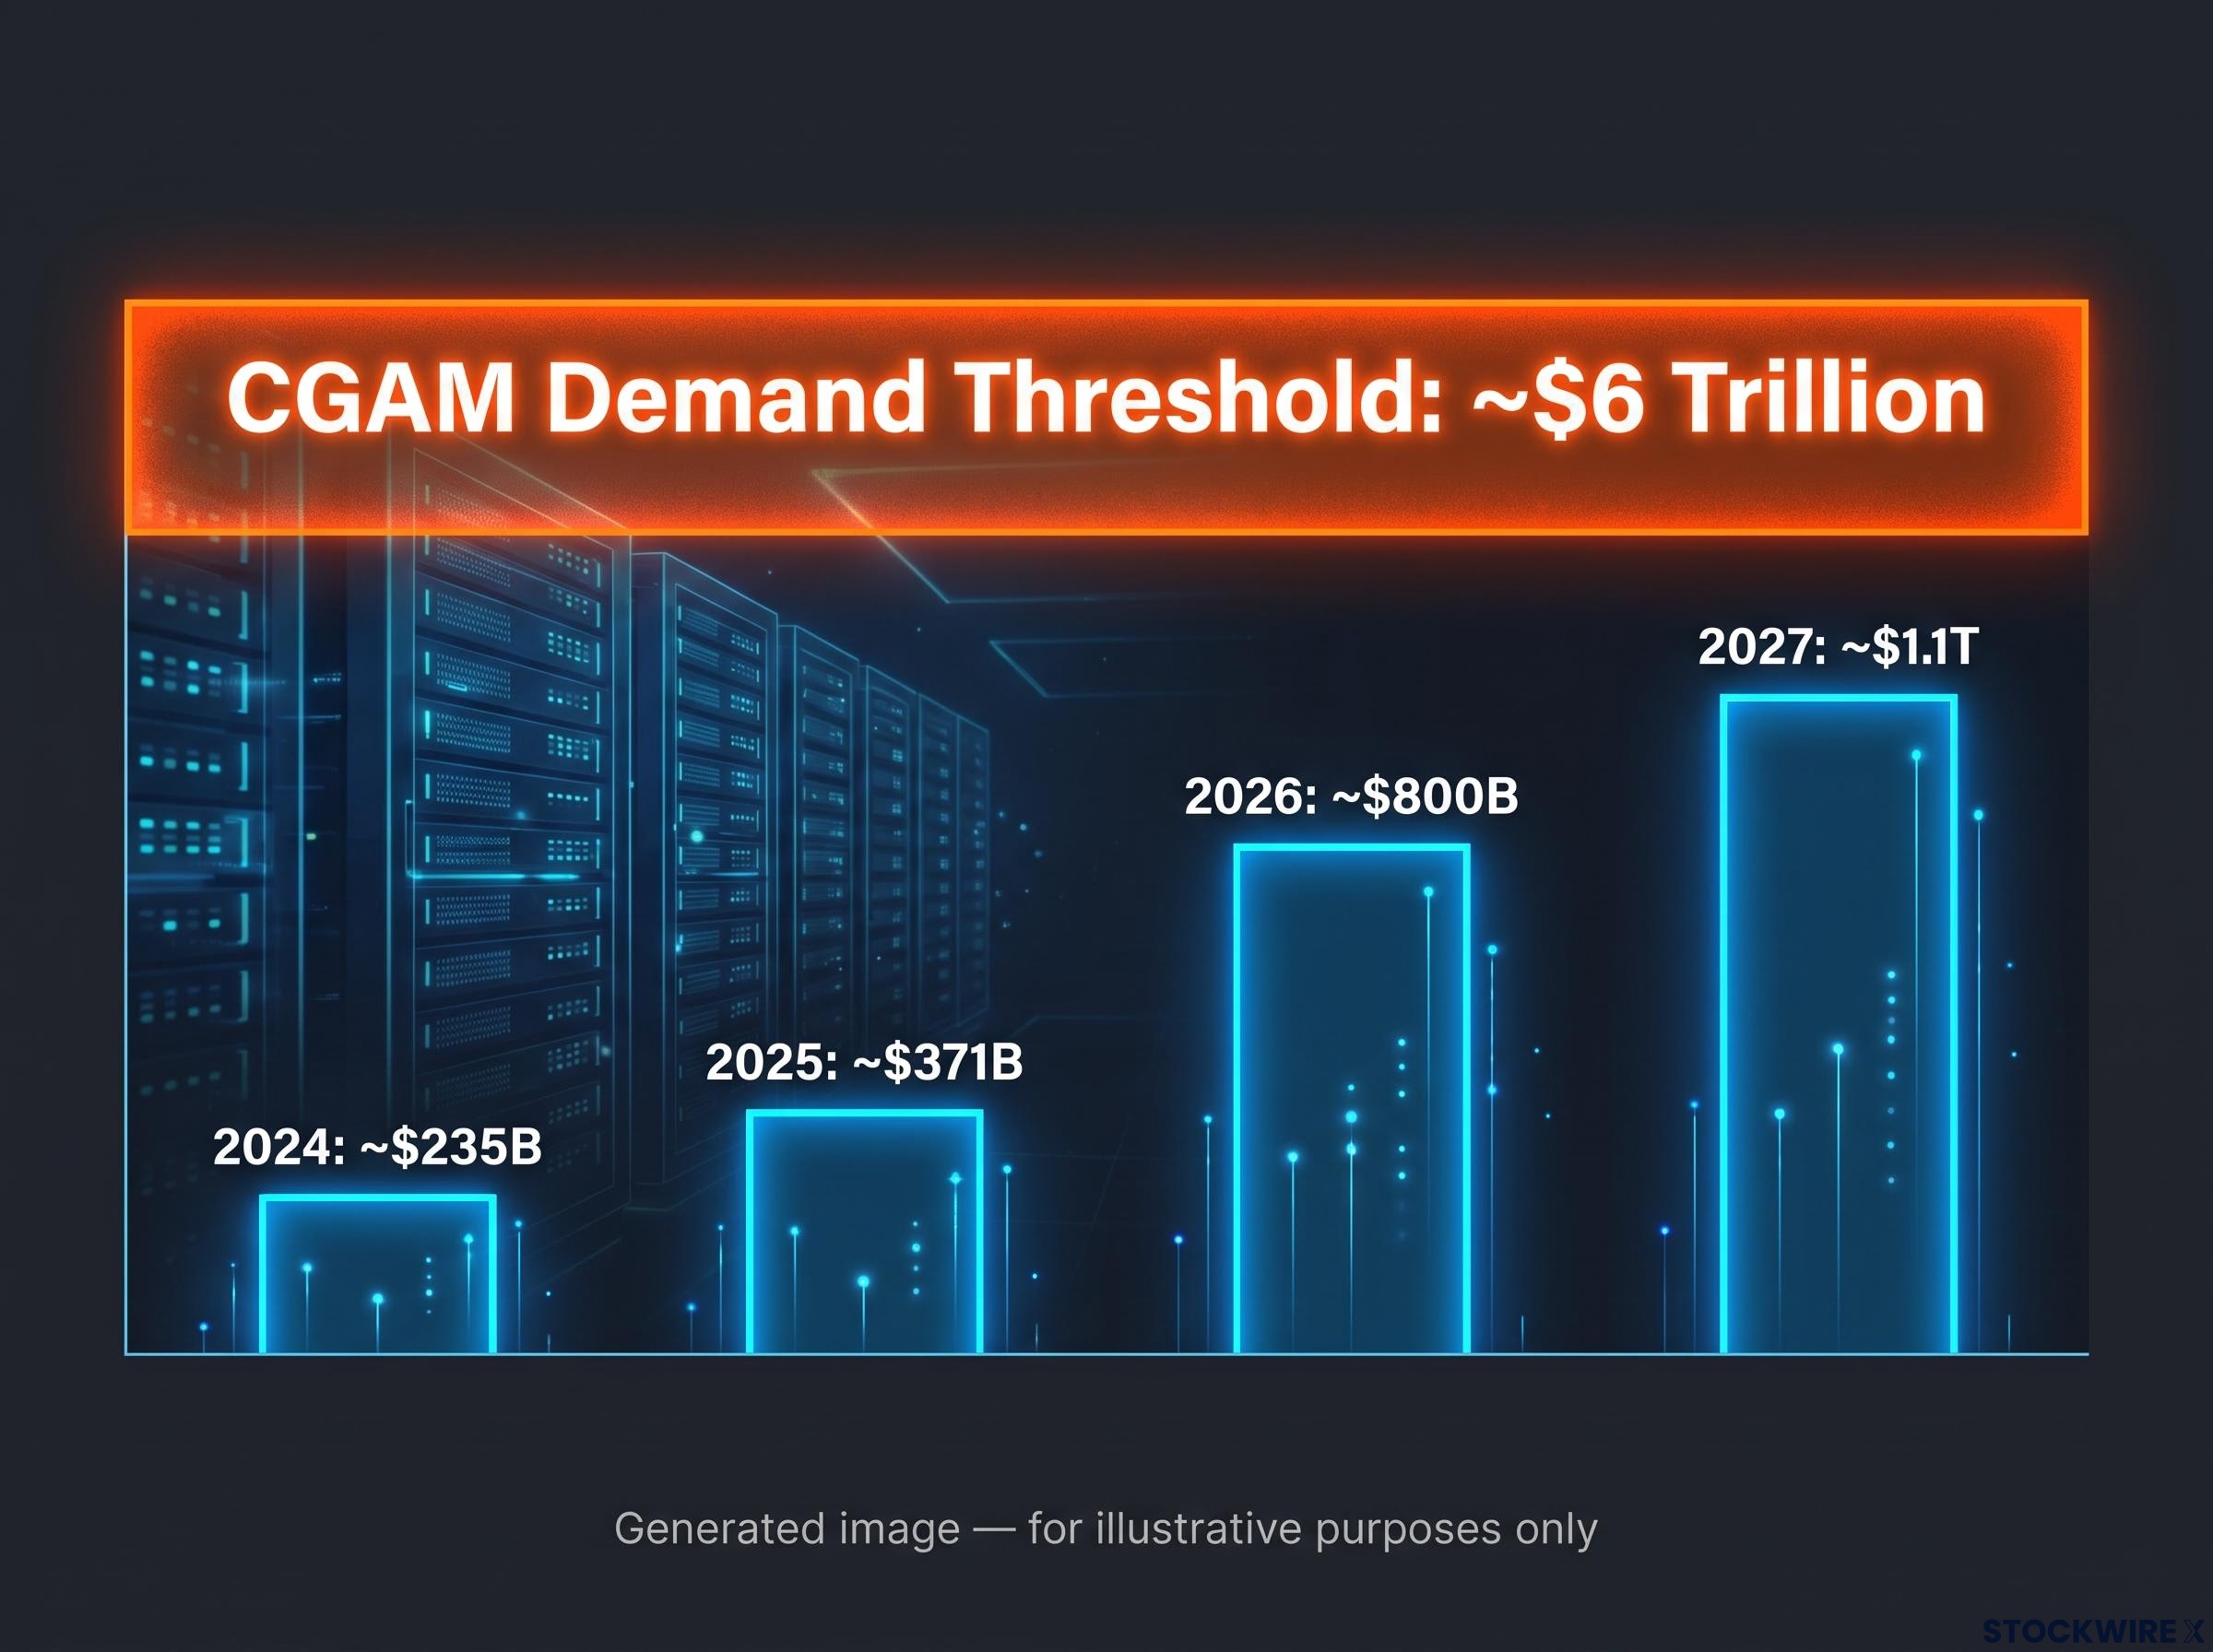
According to CoBank’s June 2026 whitepaper, U.S. hyperscalers spent approximately $235 billion on AI-related capital expenditure in 2024. Deloitte’s June 2025 analysis projected that eight hyperscalers would push AI data-centre capex to roughly $371 billion in 2025, a 44% jump year-over-year.
The trajectory steepens from there. J.P. Morgan Asset Management’s September 2026 report cites bottom-up consensus expectations of around $800 billion in AI capex in 2026, rising to approximately $1.1 trillion in 2027.
This is not speculative money. It is committed capital already flowing into data centres, chips, and compute capacity.
| Year | AI capex | Year-on-year change | Source |
|---|---|---|---|
| 2024 | ~$235B (U.S. hyperscalers) | – | CoBank, June 2026 |
| 2025 | ~$371B (eight hyperscalers) | +44% | Deloitte, June 2025 |
| 2026 | ~$800B (global consensus) | Sharp increase | J.P. Morgan AM, Sept 2026 |
| 2027 | ~$1.1T (global consensus) | Continued rise | J.P. Morgan AM, Sept 2026 |
Here is where CGAM makes its central analytical move. Rather than asking how much is being spent, the whitepaper asks how much end-user revenue would need to exist for that spending to earn an adequate return. The figure it arrives at is stark.
The CGAM demand threshold Approximately $6 trillion in annual end-user demand would be required to justify returns on current AI investment levels.
The problem is that this number has no current empirical anchor. It is not a target the industry is steadily closing in on. It is a requirement with no confirmed path to fulfilment.
PIMCO estimates that AI capital expenditure now absorbs 93-94% of hyperscaler cash flow, up from 33-40% in 2022-2023, a compression that leaves almost no financial flexibility for buybacks, dividends, or pivoting if demand fails to arrive on schedule.
Not everyone reads it as a red flag. J.P. Morgan Private Bank has argued that cumulative five-year AI capex represents only around 0.3% of expected cumulative GDP, small enough for the macro system to absorb even if some projects disappoint.
That rebuttal addresses systemic risk, not investor risk. The gap between what is being spent and the demand that would justify it is the tension to hold in mind when you evaluate any AI-exposed position, because valuation models built on the supply side of this equation have not been stress-tested against the demand side.
When big ASX news breaks, our subscribers know first
How concentrated is the S&P 500’s AI earnings bet?
The demand question matters most because of how few names now carry the index. Narrow the lens step by step and the fragility becomes visible.
Start with the raw concentration figures:
- Semiconductor companies make up roughly 20% of S&P 500 market capitalisation but account for about 40% of total S&P 500 earnings growth (J.P. Morgan Asset Management, September 2026).
- Around 50% of S&P 500 earnings growth is running through a single AI capex cycle (Goldman Sachs analysis, cited via September 2026 commentary from Jeff Snider).
- The top 10 S&P 500 stocks carried roughly 41% of index weight in 2025 but generated only around 32% of earnings (RBC Wealth Management, January 2026).
- By mid-2026, those top 10 names accounted for approximately 43% of total market cap, with the Magnificent 7 representing about 33.8% of the index as of June 2026 (InvestmentNews citing RBC, July 2026).
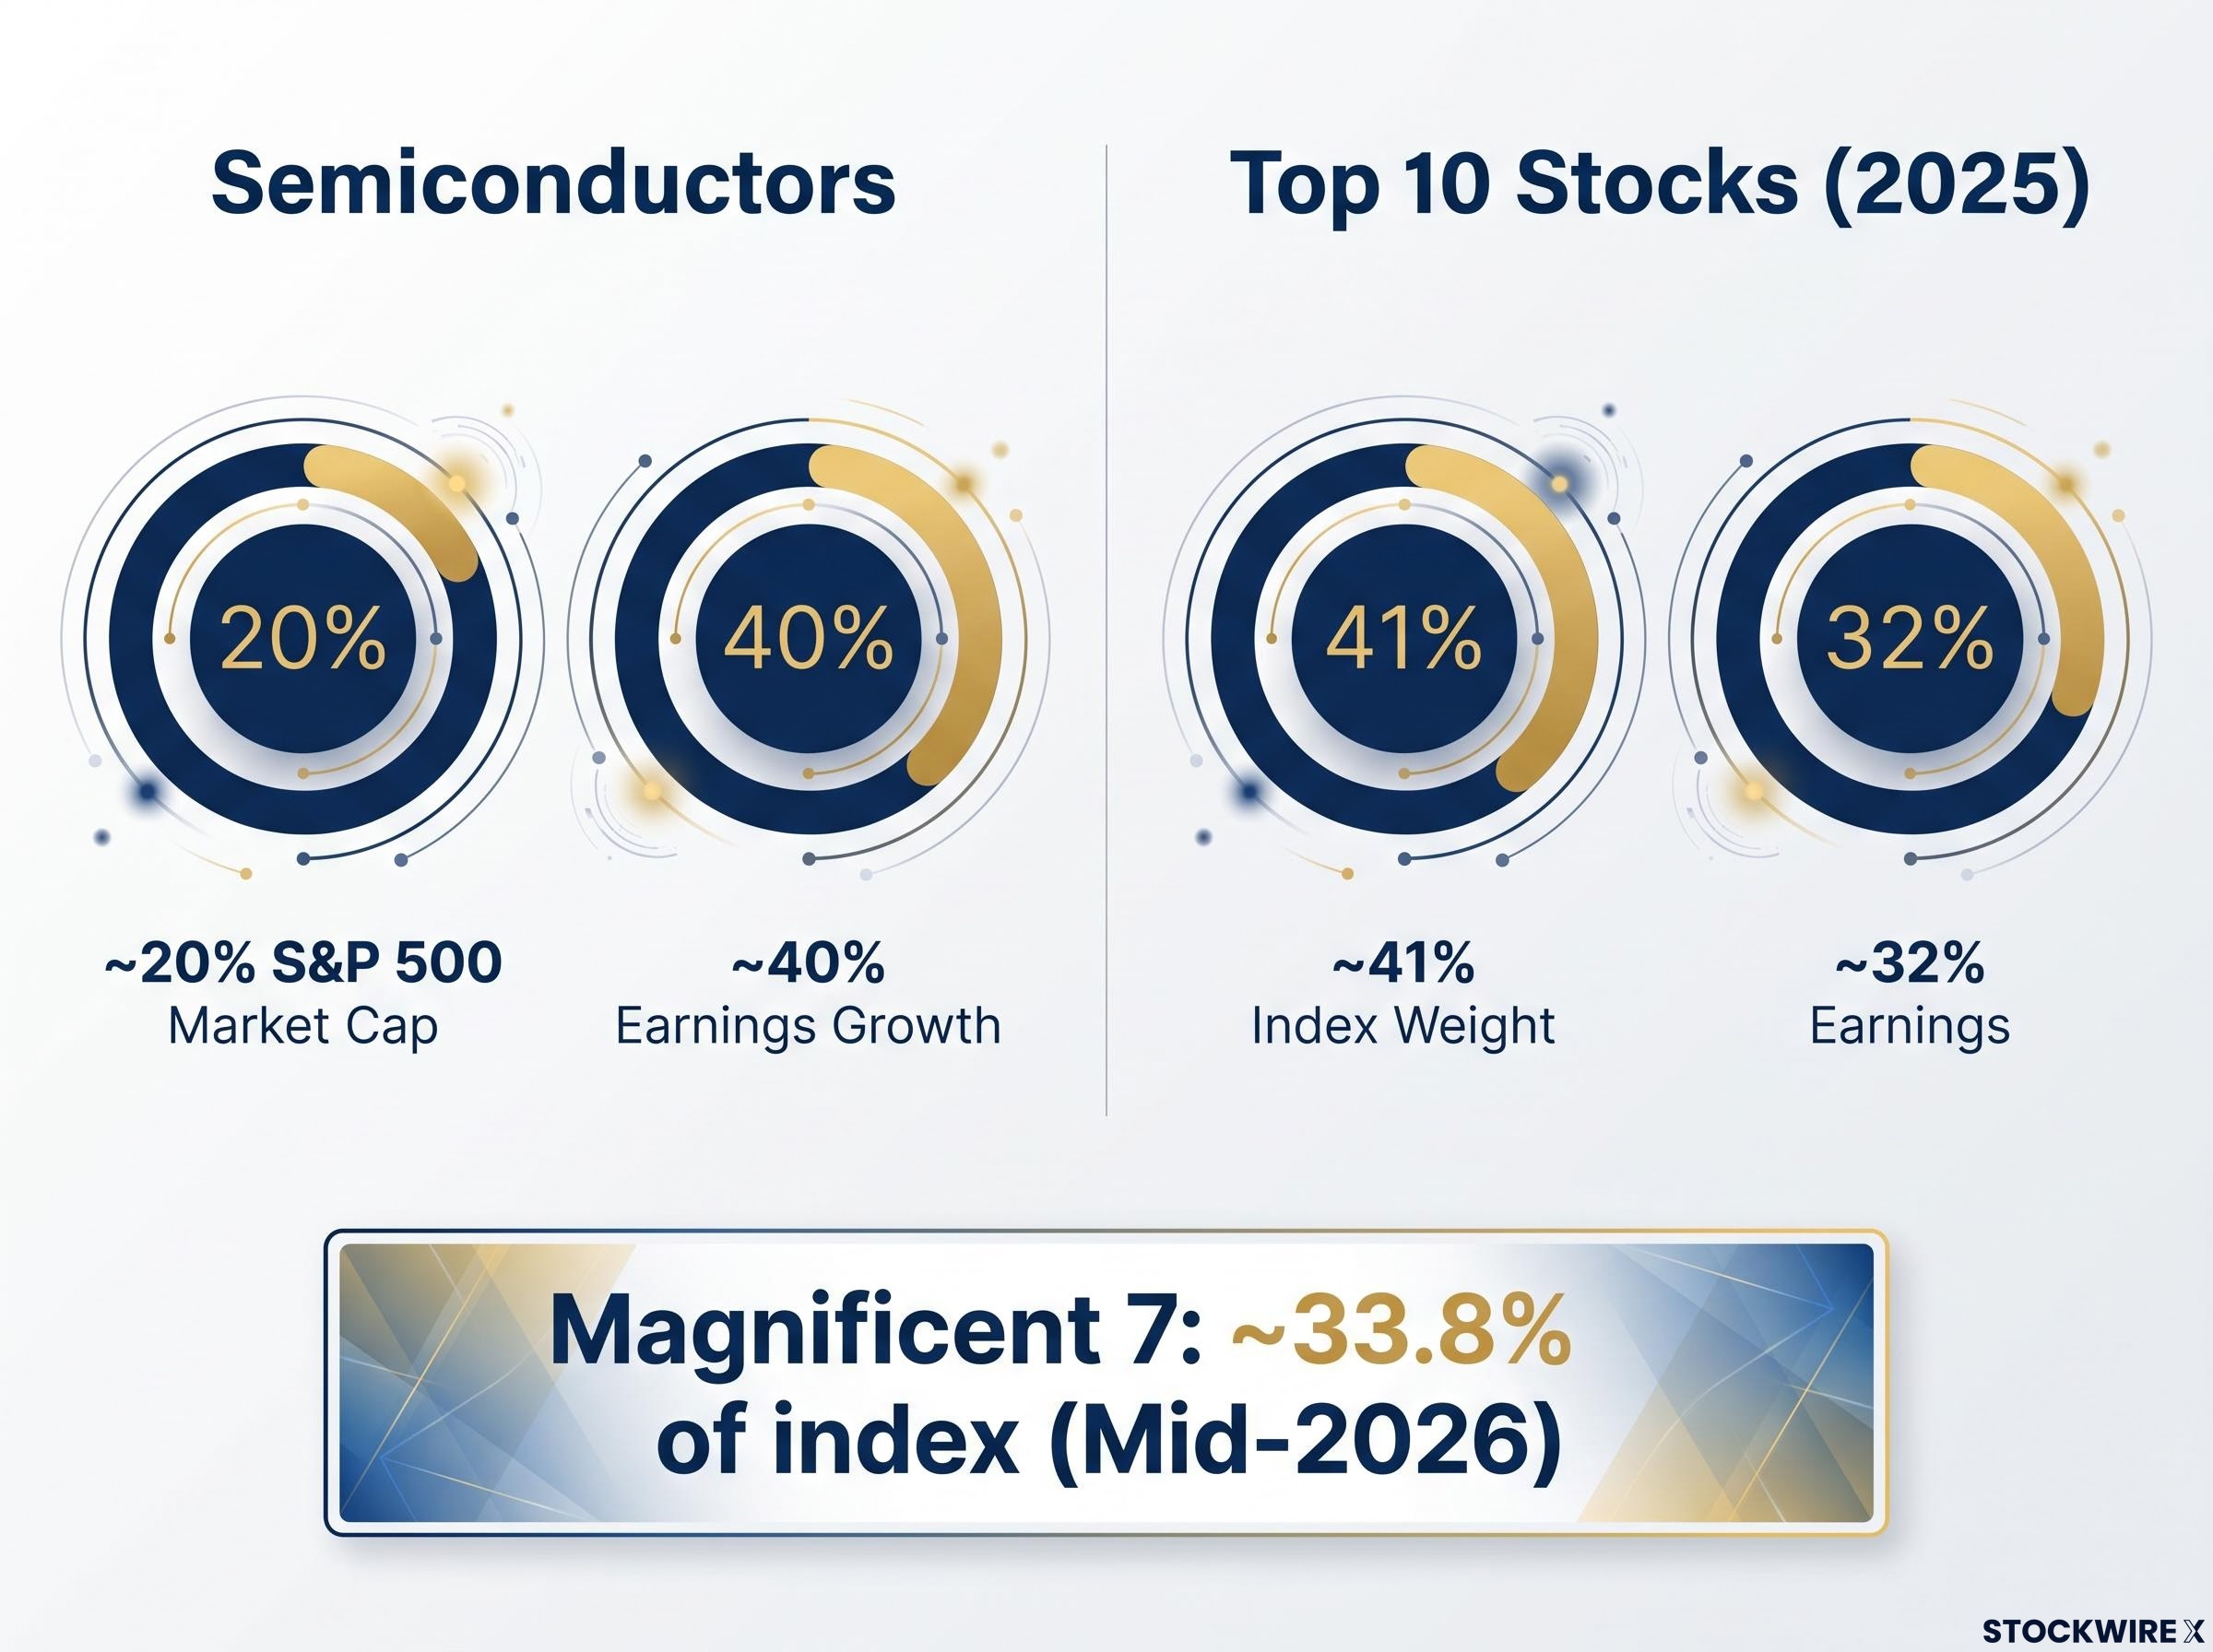
Read those figures together and a pattern sharpens. Semiconductors are generating twice the earnings growth their market weight would suggest, an earnings yield that flatters the AI trade for exactly as long as the capex holds.
The Goldman finding tightens the point further. Half of the index’s earnings growth is flowing through one investment cycle, and that cycle is funded by a small number of hyperscaler buyers. Buyer concentration is the transmission mechanism.
Then there is the divergence RBC identifies. When market cap concentration (41-43%) outruns earnings contribution (32%), the gap is a valuation premium embedded in index weights that fundamentals have not yet earned.
For a passive investor, this is the uncomfortable read. Holding a standard S&P 500 index fund is, by default, a concentrated bet on the continuation of a single AI capex cycle driven by a handful of buyers. Most people making that bet do not know they are making it, which is why “diversified index exposure” deserves a second look in this environment.
What happens to the index if hyperscalers pull back?
The correction mechanism here is not gradual. If a few hyperscalers moderate their AI infrastructure spending, the deceleration flows straight through semiconductor suppliers and AI infrastructure providers into index-level earnings.
Speed is the issue. Because so few entities control the spending that drives the earnings, the transmission is direct rather than diffused across thousands of independent decisions.
The structural shape rhymes with the late-1990s dot-com build-out and the early-2000s telecom overbuild, where capex and valuations clustered around a handful of growth stories that later normalised. The parallel is worth noting, though the analysis rests on the concentration data itself rather than on the historical echo.
The dot-com concentration trap offers the closest historical parallel: Cisco investors were right about the internet and still lost 80-90% of their capital, because being correct about a technology does not protect against paying a price that already assumes a perfect outcome.
What AI will actually do to productivity, and when
If the earnings case rests on capex continuing, the capex case ultimately rests on productivity arriving. So how much productivity, and how soon?
CGAM’s estimate is the cautious-but-credible baseline: a long-run US productivity uplift of 0.3% to 0.9%, and 0.2% to 0.6% for the UK.
CGAM’s analytical anchor Long-run AI productivity gain estimated at 0.3%-0.9% for the US and 0.2%-0.6% for the UK, a range the authors argue is inconsistent with the growth needed to support current valuations.
The instinct is to assume the optimists blow this range away. The institutional evidence does not obviously support that. The IMF’s April 2025 European analysis put medium-term productivity gains at around 1.1% cumulative, and cited Acemoglu’s 2024 estimate of roughly 0.71% cumulative US total factor productivity gain (total factor productivity measures output growth not explained by adding more labour or capital). That figure sits squarely inside CGAM’s band.
The genuinely bullish estimates exist, but they carry their own caveats. The IMF’s Gen-AI note models around 1.5 percentage points of annual productivity growth in the first decade after adoption. J.P. Morgan Private Bank estimates roughly 17.5% cumulative US gain over 20 years against the Congressional Budget Office baseline, implying something like 0.8-0.9% annually.
| Source | Estimate type | Figure | Timeline |
|---|---|---|---|
| CGAM (US) | Annual, long-run | 0.3%-0.9% | Extended |
| Acemoglu 2024 | Cumulative TFP | ~0.71% | Medium term |
| IMF Europe | Cumulative | ~1.1% | Medium term |
| IMF Gen-AI note | Annual | ~1.5 pp | First decade post-adoption |
| J.P. Morgan Private Bank | Cumulative | ~17.5% | 20 years (~0.8-0.9% annually) |
The strongest bull argument is qualitative. Michael Spence, writing in the IMF’s Finance and Development in September 2024, frames AI as a general-purpose technology, the kind of foundational shift, like electricity or the internet, that justifies heavy upfront investment because the payoff diffuses across the whole economy.
The catch is timing. General-purpose technologies historically take decades to diffuse, and current equity valuations appear to price in a faster payoff than that history supports. So the real divide is not between people who think AI will fail and people who think it will succeed. It is between those who think the gains arrive in time to validate today’s prices and those who think the timeline mismatch is itself the primary risk.
The productivity paradox sits at the heart of this timing debate: economy-wide productivity growth remains around 0.1% annually even as AI-assisted tasks show efficiency gains of up to 55% in software development, a disconnect that five structural barriers, including legacy IT systems and workforce skills shortages, are slowing into GDP data.
The hidden financing layer: private credit, SPVs, and structural fragility
Most AI commentary stops at demand, earnings, and productivity. CGAM flags a fourth layer that standard valuation discussions rarely touch, and it may be the one that matters most in a downturn.
The whitepaper warns specifically against the growing reliance on non-traditional financing to keep AI infrastructure capex flowing. The mechanisms it identifies are these:
- Private credit reliance: borrowed capital sourced outside traditional bank lending to fund AI development.
- Off-balance-sheet vehicles: sale-leasebacks (where an operator sells an asset and leases it back to raise cash) and data-centre special purpose vehicles, or SPVs (separate legal entities created to hold assets and debt off the parent company’s books).
- Elevated neutral interest rates: a compounding factor that raises the discount rate applied to future AI productivity benefits, lowering their present value.
Why does this deserve its own section? Because it is structurally distinct from demand or operational risk. A demand shortfall reduces earnings; a demand shortfall inside a leveraged financing structure can trigger unwinding dynamics that amplify the financial impact well beyond what capex deceleration alone would produce.
The unwinding is the danger. Leveraged structures do not deflate in a smooth line, which is what makes them hard to model from the outside.
There is a second, quieter signal here. CGAM’s treatment appears to be the most developed public analysis of this specific risk vector, with little independent regulatory or institutional commentary available alongside it. When the most thorough examination of a systemic risk comes from a single asset manager’s whitepaper, that scarcity is itself information about how under-scrutinised the financing architecture remains.
The FSB warnings on AI-related market vulnerabilities, published in August 2026, explicitly cite stretched AI asset valuations and increased leverage as factors that could amplify a future market correction, lending regulatory weight to concerns about the financing structures underpinning the current build-out.
For anyone assessing portfolio exposure, this is the risk that is hardest to price from public disclosure. The financing behind AI infrastructure does not sit fully visible on hyperscaler balance sheets, and the stress scenario runs through mechanisms most standard valuation models simply do not capture.
For investors wanting to map the financing risk in more depth, our full explainer on AI debt and leveraged finance stress covers how Payment in Kind structures, NAV lending, and EBITDA add-backs are masking the true financial strain on lower-rated AI infrastructure borrowers.
Making a calibrated call on AI exposure in 2026
Pull the four threads together and the decision facing an investor becomes clearer, and narrower, than the usual bull-versus-bear framing suggests.
Separate two questions that often get merged. The first is whether AI will eventually generate real economic value. Across the institutional research, the answer is almost certainly yes. The second is whether current valuations have already priced in that optimistic outcome with too little margin for the timing and demand risks CGAM identifies. That is where the disagreement actually lives.
Seen this way, the bull and bear cases share more common ground than the noise implies. Both accept meaningful productivity gains. Both accept enormous committed capex. The genuine differentiator is the assumed timeline for productivity and demand to materialise.
The variables that decide it are ones you can partly assess in your own holdings:
- Your actual AI concentration. How much of your passive index exposure is, in effect, a bet on a single capex cycle? Recall that the top 10 names carry 41-43% of index weight against only about 32% of earnings, a premium that becomes exposed if capex plateaus.
- The earnings sustainability of that concentration. If hyperscaler capex flattens, how quickly does the earnings base erode, given that roughly half of S&P 500 earnings growth runs through one cycle?
- Your financing-structure exposure. What portion of your portfolio sits in vehicles tied to private credit or leveraged AI infrastructure financing, made costlier still by the elevated neutral rates CGAM flags?
The question is not whether to believe in AI. It is whether the price you are already paying, through your portfolio, for AI’s eventual success leaves any upside if the timeline slips, or only asymmetric downside.
The variables to watch in the next reporting cycle
Three signals will confirm or challenge the CGAM thesis fastest. Watch hyperscaler capex guidance in the Q3 2026 results for any moderation in committed spending. Watch whether major cloud providers begin disclosing actual AI workload revenue rather than aggregate capex. And watch AI-linked private credit markets for any early sign of stress in the financing layer.
The $6 trillion demand threshold remains the number you cannot yet observe but should keep watching. It is the test the whole build-out has not passed.
This article is for informational purposes only and should not be considered financial advice. Investors should conduct their own research and consult with financial professionals before making investment decisions. Past performance does not guarantee future results, and financial projections are subject to market conditions and various risk factors. Productivity and demand estimates cited here are speculative and subject to change based on market developments.