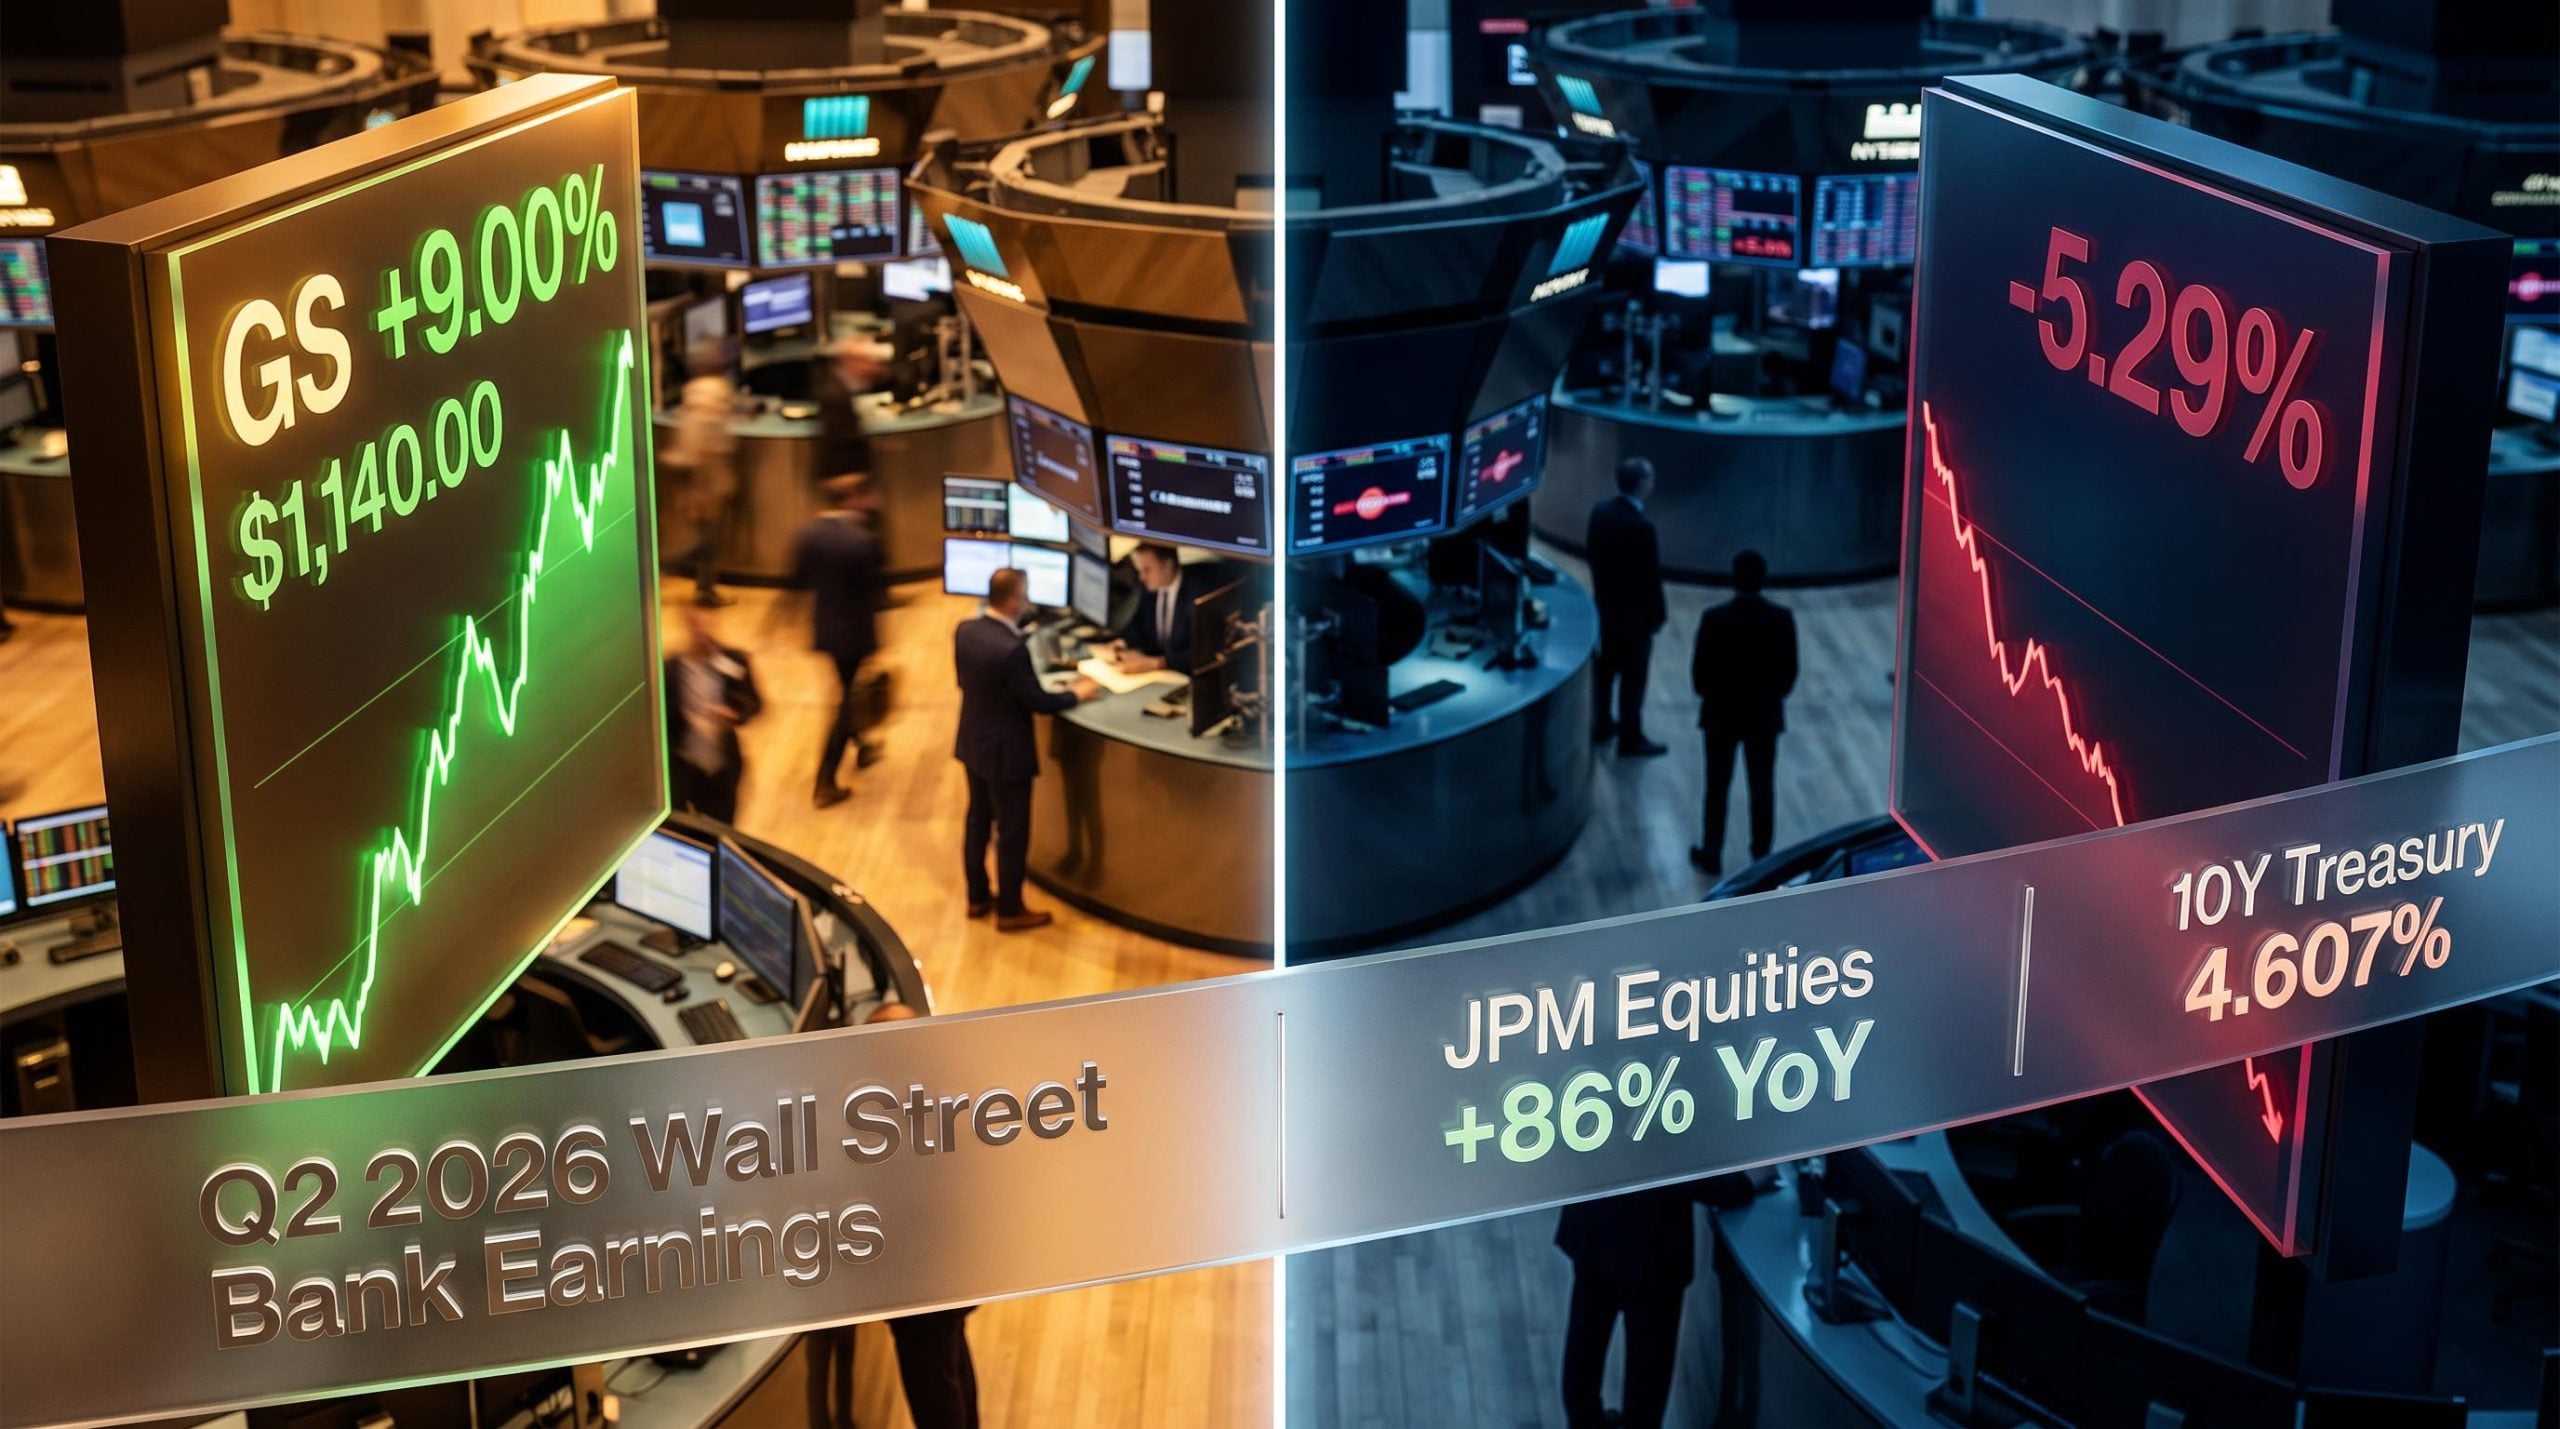
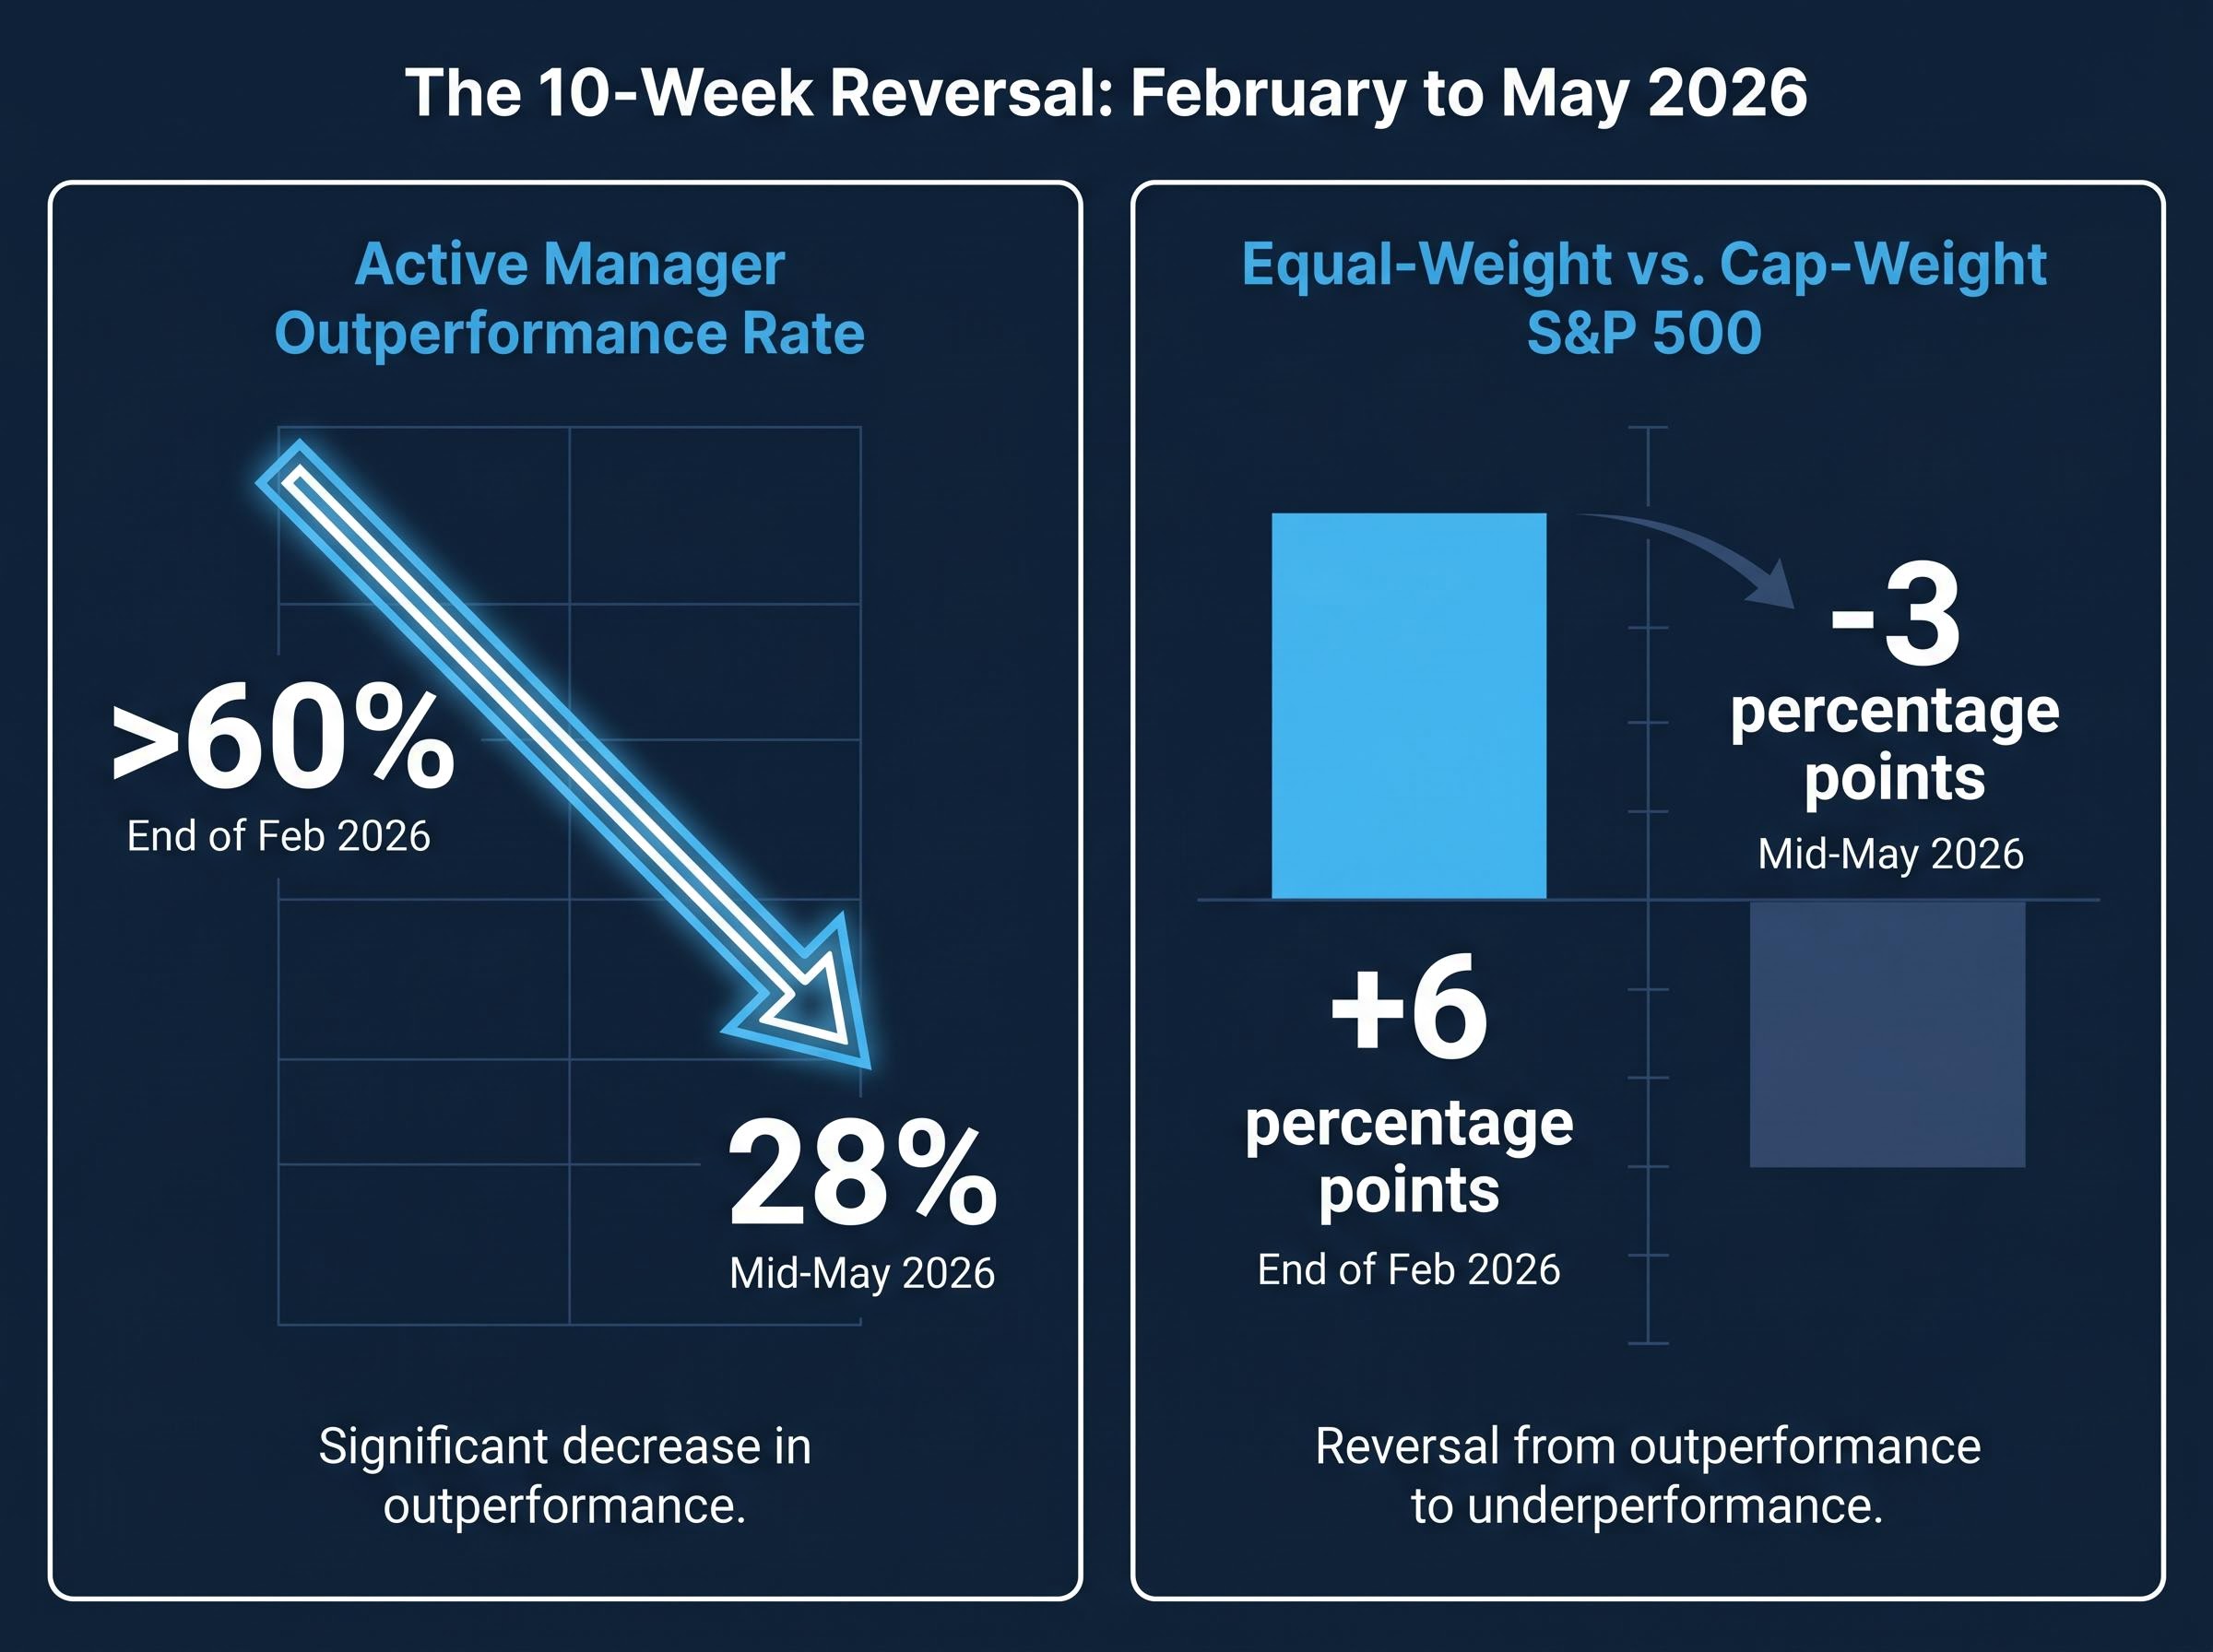
More than 60% of large-cap active managers were beating the S&P 500 at the end of February 2026. By mid-May, that figure had collapsed to 28%. According to Barclays research, that reversal ranks among the worst active-versus-passive performance swings in two decades, and it happened in just ten weeks.
The cause was not a sudden failure of stock-picking skill. It was the return of a familiar structural force: a narrow cluster of AI-driven megacap stocks reasserting dominance over an index they already control to a historically extreme degree. The S&P 500 gained roughly 4% month-to-date in May 2026, yet a majority of its components did not participate in that move. Active managers, constrained by regulation and prospectus rules from matching the index’s megacap concentration, were caught on the wrong side of a rally that rewarded weight, not breadth.
What follows is an examination of why this structural collapse keeps recurring, what the current warning signals reveal about market fragility, and how to evaluate the active-versus-passive decision under the specific conditions shaping markets today.
From ahead to behind in ten weeks: what the 2026 reversal actually shows
The timeline tells the story before the analysis needs to. At the end of February 2026, active large-cap managers were enjoying one of their strongest relative performance windows in years. Market breadth had been wide, and individual stock selection was being rewarded.
Then the reversal began. AI-linked megacap stocks resumed leadership precisely as breadth deteriorated. The equal-weighted S&P 500, which had led its cap-weighted counterpart by approximately 6 percentage points at end-February, flipped to trailing it by 3 percentage points by mid-May. In the prior week alone, the equal-weighted index lagged by approximately 130 basis points on collapsing breadth.
The April 2026 rally that preceded these May conditions was already flashing the same warning: the S&P 500 posted a 98th-percentile monthly return while only 23% of its constituents kept pace, making narrowing breadth the dominant structural feature of the current market cycle rather than an isolated episode.
The key data points from the reversal:
- Active large-cap outperformance rate: above 60% at end-February 2026, collapsing to 28% by mid-May 2026 (Barclays via Bloomberg)
- Equal-weighted S&P 500 swung from leading cap-weighted by approximately 6 points to trailing by 3 points over the same period
- Equal-weighted index lagged by roughly 130 basis points in a single week on deteriorating breadth
- S&P 500 up approximately 4% month-to-date in May 2026, yet most individual components did not participate
Barclays identified this as the “fourth-poorest active manager relative performance” episode over the past two decades.
This was not a random performance blip. The catalyst was specific and identifiable: a small number of stocks drove headline index returns, and the structural rules governing active funds made it impossible for most managers to keep pace.
When big ASX news breaks, our subscribers know first
The long-run record that one good quarter cannot undo
The February optimism was the anomaly. The multi-decade evidence points in one direction.
The SPIVA U.S. Scorecard Year-End 2025, published by S&P Dow Jones Indices, found that 79% of active large-cap US equity funds underperformed the S&P 500 in 2025. That figure had been 65% in 2024 and 60.4% in 2023, a clear acceleration that tracks the concurrent rise in index concentration.
The SPIVA U.S. Scorecard Year-End 2025 documents this acceleration in granular detail, tracking underperformance rates across fund categories, time horizons, and asset classes to establish the broadest available benchmark for evaluating active manager results against passive alternatives.
| Year | 1-Year SPIVA Underperformance Rate | Approximate Top-10 S&P 500 Concentration |
|---|---|---|
| 2023 | 60.4% | ~30-31% |
| 2024 | 65% | ~33-34% |
| 2025 | 79% | ~33.5% (November 2025) |
Over longer horizons, the record is starker still. Using SPIVA Year-End 2023 data (the most recent comprehensive long-horizon dataset):
- 5-year underperformance rate: 88.6% of US large-cap funds trailed the S&P 500
- 10-15-year range: Morningstar data confirms 90%+ underperformance across this horizon
- 15-year underperformance rate: 93.6% of US large-cap funds lagged their benchmark
These figures reframe what “active fund risk” actually means. It is not the risk of one disappointing year. It is the near-certainty of long-horizon underperformance for the average fund, which changes how any short-term outperformance window should be weighted as evidence of skill.
Why the rules of the game make active managers structurally unable to keep up
The pattern documented above is not primarily about stock-picking talent. It is about regulatory and portfolio construction constraints that become binding when index concentration reaches historic extremes.
The constraints stack in three layers:
- Regulatory baseline: US diversified funds registered under the Investment Company Act of 1940 must keep at least 75% of assets in positions where no single issuer exceeds 5% of fund assets. When individual S&P 500 names exceed 6-7% benchmark weight, this rule prevents most funds from matching that weight.
- Prospectus limits: Many active funds layer additional restrictions. Investment committee position limits are typically set at 3-4% maximum per stock, and sector overweights are commonly capped at plus or minus 5 percentage points versus the benchmark.
- Active weight caps: Benchmark-aware funds often apply maximum active weight policies of plus or minus 2-3 percentage points versus benchmark weight, limiting even a convinced manager’s ability to overweight conviction positions.
When megacap names exceed 6-7% benchmark weight, the maths makes it structurally impossible for constrained active funds to keep pace without violating their own diversification rules.
When an overweight is still an underweight
The compounding effect of these stacked constraints is where the structural drag becomes severe. Consider a fund with a 4% position limit in a stock that holds 6.7% of the S&P 500. That fund is 2.7 percentage points underweight that single name by structural necessity, regardless of the manager’s conviction.
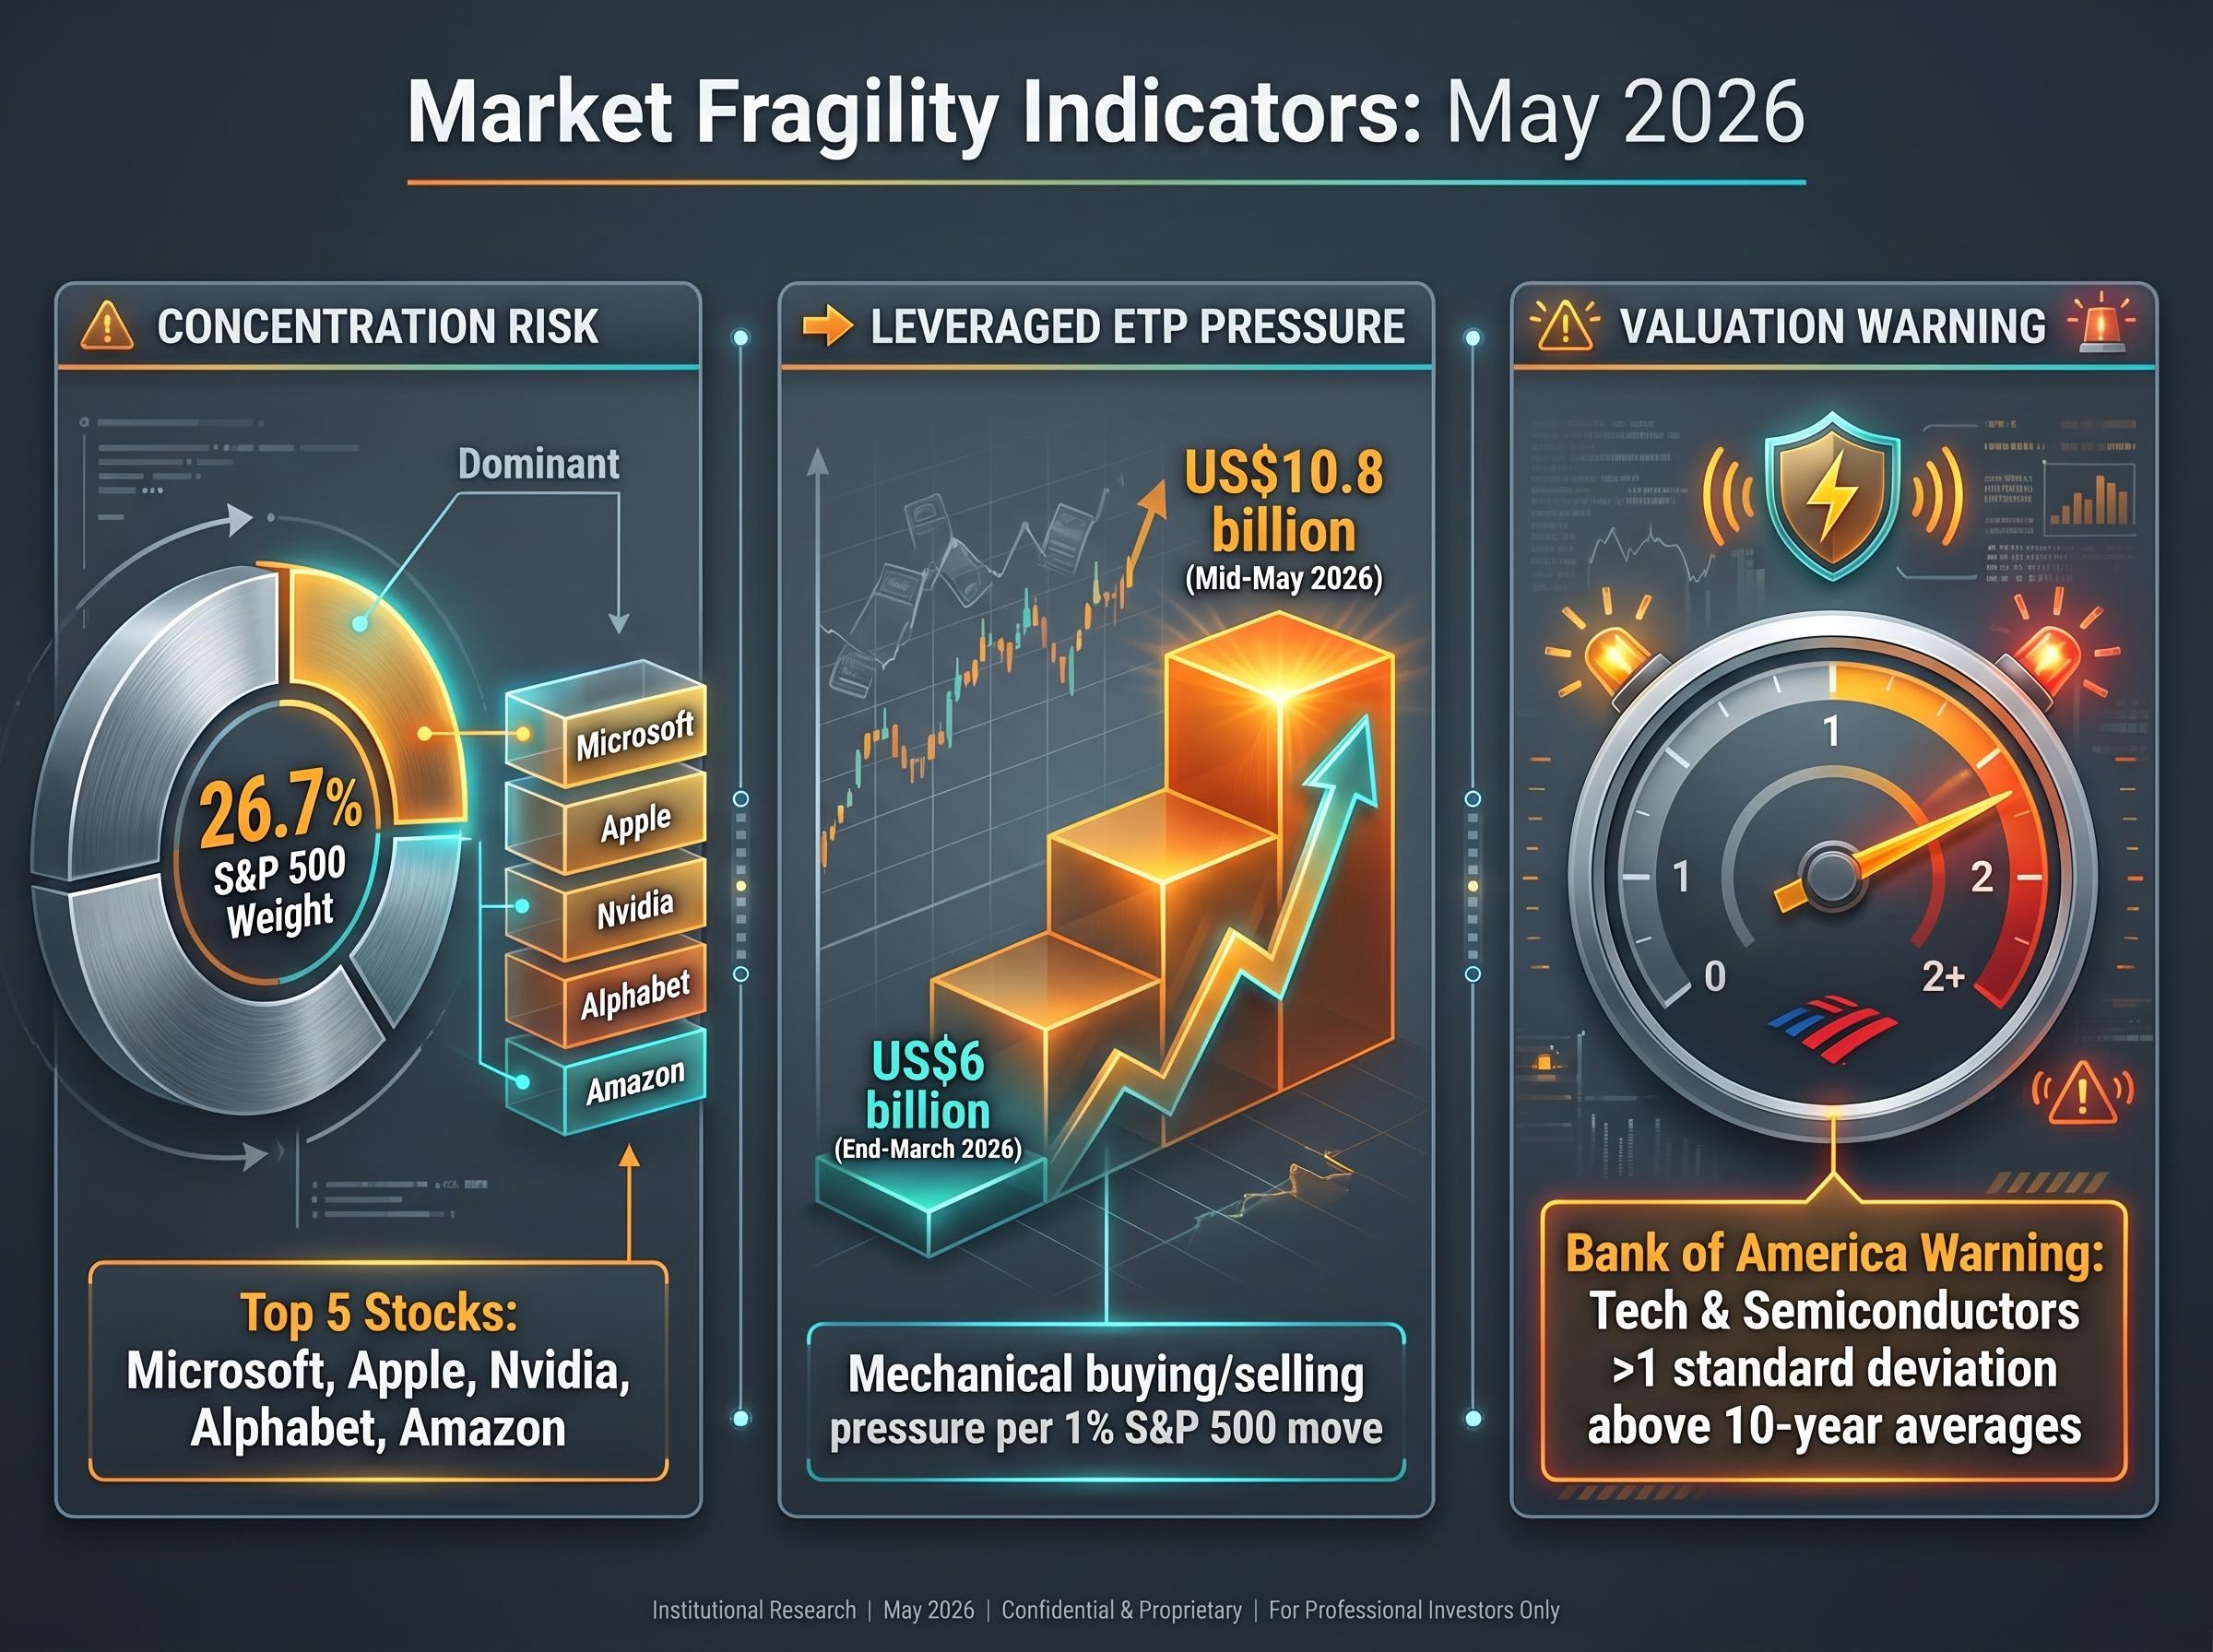
Now multiply that gap across the top five index constituents. As of 9 May 2026, the top five S&P 500 stocks (Microsoft, Apple, Nvidia, Alphabet, Amazon) collectively held 26.7% of index market capitalisation. The top ten held 35.9%. A fund that is maximally overweight each of those names under its own rules is still, in aggregate, structurally underweight the benchmark’s most dominant cluster. In a concentrated rally, this gap compounds into underperformance that no amount of stock selection elsewhere in the portfolio can offset.
How concentration risk and leveraged product growth are compounding market fragility
If concentration punishes active managers in rallies, it also makes the eventual unwind potentially severe. The same structural mechanics work in both directions.
Bank of America strategists flagged US technology stocks, particularly semiconductors, as exhibiting bubble-like characteristics in mid-May 2026, with valuation multiples more than one standard deviation above 10-year averages.
Semiconductor concentration provides the most precise illustration of how narrow the actual return driver has become: 19 chip stocks representing roughly 15% of S&P 500 weight have generated approximately 70% of the index’s year-to-date market capitalisation gains in 2026, and on 14 May 2026 the cap-weighted index hit an all-time high while 46 of its constituents simultaneously touched 52-week lows.
Separately, the mechanical footprint of leveraged exchange-traded products has grown sharply. According to Barclays, the estimated mechanical buying or selling pressure from leveraged ETPs on a 1% S&P 500 move has risen to approximately US$10.8 billion as of mid-May 2026, up from roughly US$6 billion at the end of March 2026.
Leveraged ETP mechanical pressure: US$10.8 billion per 1% S&P 500 move, up 80% since end-March 2026.
Three distinct fragility indicators are now present simultaneously:
- Bank of America bubble warning: Tech and semiconductor valuations more than one standard deviation above 10-year averages, with positioning at or above prior extremes
- Leveraged ETP surge: Procyclical rebalancing concentrated in late-session trading, with BIS research finding these flows accounted for up to 15-20% of end-of-day S&P 500 futures volume on high-volatility days in 2025
- Passive flow concentration: Over 60% of net US equity fund inflows in the 12 months through February 2026 went into S&P 500 and Nasdaq-100 tracking vehicles, with the top 10 S&P 500 names accounting for approximately 40% of trading volume in S&P 500-linked ETFs and derivatives
The concentration that makes active outperformance structurally difficult also creates the conditions for a sharper, more crowded exit when sentiment reverses. Understanding this duality prevents a false choice between “index funds are always safe” and “active funds are always wrong.”
The next major ASX story will hit our subscribers first
A practical framework for evaluating active versus index funds right now
The structural analysis above converts into three specific evaluation criteria for any investor weighing active against passive funds under current conditions.
Start with costs. According to the Morningstar Global Fund Fee Study 2025, the asset-weighted average expense ratio for US equity index funds is 0.05%, compared with 0.60% for active equity funds. The median actively managed US large-cap mutual fund charges 0.74%, while flagship index ETFs are available at 3-5 basis points. That differential means active managers must outperform by at least 55 basis points annually just to break even on a net-of-fees basis.
Then evaluate active fund differentiation using these specific metrics:
- Cost hurdle: Does the fund’s fee structure leave a realistic margin for net outperformance after accounting for the 55-70 basis point annual drag?
- Active differentiation: What is the fund’s active share and tracking error relative to its benchmark? A fund with low active share and high fees is effectively a “closet index” charging a premium for index-like returns.
- Check active share (should be meaningfully above 60% for genuine differentiation)
- Review tracking error relative to stated strategy
- Evaluate after-fee performance versus benchmark over at least 5-10 years, not the last 12 months
- Assess the fund’s drawdown record during 2022 and other stress periods
- Concentration risk in the index itself: With the top 10 S&P 500 names at approximately 35.9% of index weight, cap-weighted index ownership is itself a concentrated bet on a small number of AI-linked companies sustaining their valuations. Low-cost alternatives, such as equal-weight S&P 500 ETFs or factor strategies (value, quality), reduce megacap dependency without incurring active management fees.
Investors who want to act on the equal-weight or factor-tilt alternatives the framework above describes will find our dedicated guide to cap-weight versus equal-weight ETF structures covers the specific mechanics of how each index weights and rebalances constituents, the historical performance spread between cap-weighted and equal-weighted peers across different concentration regimes, and the portfolio construction questions that determine which structure fits a given investor.
| Characteristic | Index Fund (Cap-Weighted) | Active Large-Cap Fund |
|---|---|---|
| Average Expense Ratio | 0.05% | 0.60% (asset-weighted) |
| Typical Active Share | 0% (tracks benchmark) | 50-80% (varies widely) |
| 1-Year SPIVA Underperformance (2025) | N/A (is the benchmark) | 79% underperformed |
| Alternative Options | Equal-weight ETFs, factor ETFs | High active share, concentrated strategies |
The concentration era is not a reason to panic, but it is a reason to look closely
The long-run SPIVA evidence points overwhelmingly toward index funds as the default choice for investors who lack the time or expertise to rigorously evaluate active fund differentiation. That conclusion has only strengthened as the one-year underperformance rate climbed from 60.4% to 79% over three years.
Yet cap-weighted index ownership at current concentration levels is itself a meaningful active bet. The top 10 S&P 500 constituents held approximately 35.9-38% of index weight in May 2026, exceeding the approximately 33% peak reached during the dotcom bubble, according to Goldman Sachs historical comparisons. That is a position investors should consciously accept rather than assume away.
The structural evolution worth monitoring is specific: if top-10 concentration continues rising from its current range, and leveraged ETP rebalancing pressure (now at US$10.8 billion per 1% index move) continues to grow, the case for at least partial diversification within a passive portfolio strengthens materially. Equal-weight or factor-tilted ETFs offer that diversification at a fraction of active management costs.
Factor strategies targeting quality offer a related route away from megacap dependency, but the quality tilt within small-cap indexes introduces its own structural caveat: U.S. small-cap indexes carried a quality factor score of -0.64 as of December 2025, meaning broad passive small-cap exposure systematically dilutes the very premium investors are seeking by including unprofitable and speculative names that private capital has left behind.
Neither side of the active-versus-passive argument holds cleanly in a market this concentrated. The evidence favours indexing over active management by a wide margin. It also suggests that the specific index being tracked, and how its weight is distributed, deserves more attention than most investors currently give it.
This article is for informational purposes only and should not be considered financial advice. Investors should conduct their own research and consult with financial professionals before making investment decisions. Past performance does not guarantee future results.