
The Reserve Bank of Australia lifted its cash rate to 4.60% on 30 September 2026, a 15-year high, and in doing so set the terms for how every major ASX bank stock traded last month.
Here is what makes September unusual. Not one of the Big Four, nor the mid-tier names, released a single price-sensitive announcement all month. No earnings, no guidance, no strategic updates. That means every price move was a direct read on macro sentiment alone, stripped of company noise.
September was, in effect, a clean experiment in how the market judges each bank’s exposure to the current rate and inflation cycle.
The broker consensus data tells you which Australian bank stocks analysts believe have already absorbed that macro risk, and which are still priced for an environment that the RBA’s own language suggests is no longer coming back. The gap between those two groups is wider than many investors assume, and it points most sharply at two names: Commonwealth Bank and Macquarie Group.
What the RBA’s 15-year rate high means for the banking sector
The September hike was the fourth of 2026, taking the cash rate from 4.35% to 4.60%, the highest level since late 2011. The Monetary Policy Board’s decision was unanimous, and the language that followed matters as much as the number.
“The Board will continue to do what it considers necessary to bring inflation sustainably back to target, including increasing the cash rate target further if needed.”
That formulation represents a firmer stance than previous communications. Westpac Economics reads it as a meaningful hawkish shift from the earlier “if upside risks materialise” wording, and now treats a follow-up 25 basis point hike at the 3 November 2026 meeting as its base case. Commonwealth Bank’s economics commentary similarly describes the RBA as leaving the door open to further increases.
A prolonged rate plateau rather than a sharp peak-and-cut cycle has been the central banking scenario since at least April 2026, when all four major Australian banks aligned on a higher-for-longer path with Westpac projecting the cash rate reaching 4.85% by August, a forecast that gives additional context to why broker discount assumptions on housing-heavy franchises have proved so durable.
The inflation picture explains why the Board is not softening. The Australian Bureau of Statistics (ABS) data for August 2026, published 30 September, showed the gap to target remains wide:
- Headline CPI: +4.0% year-on-year, up from 3.5% in July
- Trimmed mean (the RBA’s preferred underlying measure): +3.6% year-on-year, unchanged from July
- Housing component: +5.7% year-on-year
That housing figure is the one that feeds most directly into bank credit quality. When rents, utilities and housing costs run at 5.7%, borrower stress rises, particularly for households that stretched to buy near the top of the cycle.
Here is the read for investors. The shift from conditional to near-unconditional tightening signals that the pressure on bank valuations is structural, not a passing squeeze. If the RBA’s rhetoric is accurate, the rate environment weighing on these stocks is unlikely to reverse soon, which means you should not assume the current discount on housing-heavy names corrects itself on its own.
When big ASX news breaks, our subscribers know first
How Australian bank stocks actually work in a rate cycle (and why September’s moves were a clean read)
To make sense of the broker ratings below, you need to understand one mechanism: the net interest margin, or NIM. This is the gap between what a bank earns on its loans and what it pays on deposits and wholesale funding. It is the engine of bank profitability.
When rates first rise, that engine runs hot. Banks reprice variable loans upward quickly while deposit rates lag, and the margin on low- or no-interest transaction accounts widens. This is the early-cycle tailwind.
The NIM compression story sits inside a broader set of ASX bank valuation metrics, including return on equity and CET1 capital adequacy, that collectively reveal whether a bank’s underperformance is cyclical and temporary or structural and persistent across rate environments.
It does not last. As a tightening cycle matures, depositors shift cash into higher-yielding term products, competition for those deposits intensifies, and banks can no longer pass the full rate rise to borrowers without losing market share. The margin compresses. Analysts across major research houses frame the current NIM support as late-cycle and fading rather than a durable earnings driver.
That distinction splits the sector along two structural fault lines, and broker ratings are pricing each one differently:
- Housing-concentrated franchises: Banks whose earnings lean heavily on Australian mortgages carry greater credit-quality risk as arrears rise. Research from firms including AMP and Westpac Economics flags rising 30-, 60- and 90-day arrears among high-LVR and investor borrowers as the specific concern.
- Diversified, fee-based models: Banks with income streams outside domestic lending (markets, asset management, infrastructure) are less exposed to the mortgage cycle pressuring the majors.
Once you see the sector through that lens, September’s price action stops looking contradictory and starts looking coherent.
Why September 2026 produced an unusually pure macro signal
Most months, bank share prices move on a tangle of inputs: earnings beats, guidance revisions, dividend changes, regulatory news. Untangling macro sentiment from company-specific reaction is guesswork.
September 2026 was different. With no price-sensitive announcements from any of the seven stocks, and with the Big Four alone representing roughly one quarter of the ASX 200 by market capitalisation, the month delivered a rare clean signal.
For you, that makes September more useful than a typical month, not less. The price moves tell you precisely which banks the market judges most vulnerable to the rate and inflation cycle, without earnings noise muddying the read. CBA falling around 6% while brokers kept a strong buy on a Macquarie that also fell is not a glitch. It is the signal.
Where brokers stand on every major ASX bank stock heading into October
Broker consensus ratings and average 12-month price targets, sourced from Market Index, give you a structured starting point for reviewing your own bank exposure. Read the table from the top and the central divergence emerges on its own.
| Stock | Broker Rating | Avg Price Target | Implied Move |
|---|---|---|---|
| Macquarie Group (MQG) | Strong Buy | $270.89 | +10% |
| Commonwealth Bank (CBA) | Strong Sell | $125.20 | -17% |
| Westpac (WBC) | Sell | $34.18 | -3% |
| Bendigo and Adelaide Bank (BEN) | Sell | $10.06 | -3% |
| National Australia Bank (NAB) | Hold | $39.88 | +2% |
| ANZ Group Holdings (ANZ) | Hold | $36.05 | -6% |
| Bank of Queensland (BOQ) | Hold | $6.06 | -8% |
Set that against where the stocks actually closed in September, and you can see how little the recent price action lines up with the targets.
| Stock | Final-Day Move | Closing Price | Full-Month Return |
|---|---|---|---|
| Commonwealth Bank (CBA) | +0.5% | $151.01 | -6% |
| National Australia Bank (NAB) | +0.1% | $39.15 | +1% |
| ANZ Group Holdings (ANZ) | -0.5% | $38.31 | +3% |
| Westpac (WBC) | +0.2% | $35.07 | +1.5% |
| Bendigo and Adelaide Bank (BEN) | +0.5% | $10.36 | -3% |
| Bank of Queensland (BOQ) | +0.2% | $6.61 | +1% |
| Macquarie Group (MQG) | -0.5% | $246.10 | -2% |
The hold ratings deserve a second look, because “hold” is doing more work than the label suggests. NAB carries a hold with +2% implied upside. ANZ carries the same hold label but with -6% implied downside, and BOQ sits at -8%. That is an eight-percentage-point spread inside a single rating category.
Broker earnings forecasts for ASX banks have been a consistent source of tension between market pricing and analyst consensus through 2026, with one major research house projecting cash earnings 4-6% below market consensus for FY27, a gap that quantifies the room available for earnings disappointment if NIM compression and rising arrears land in line with the more cautious scenario.
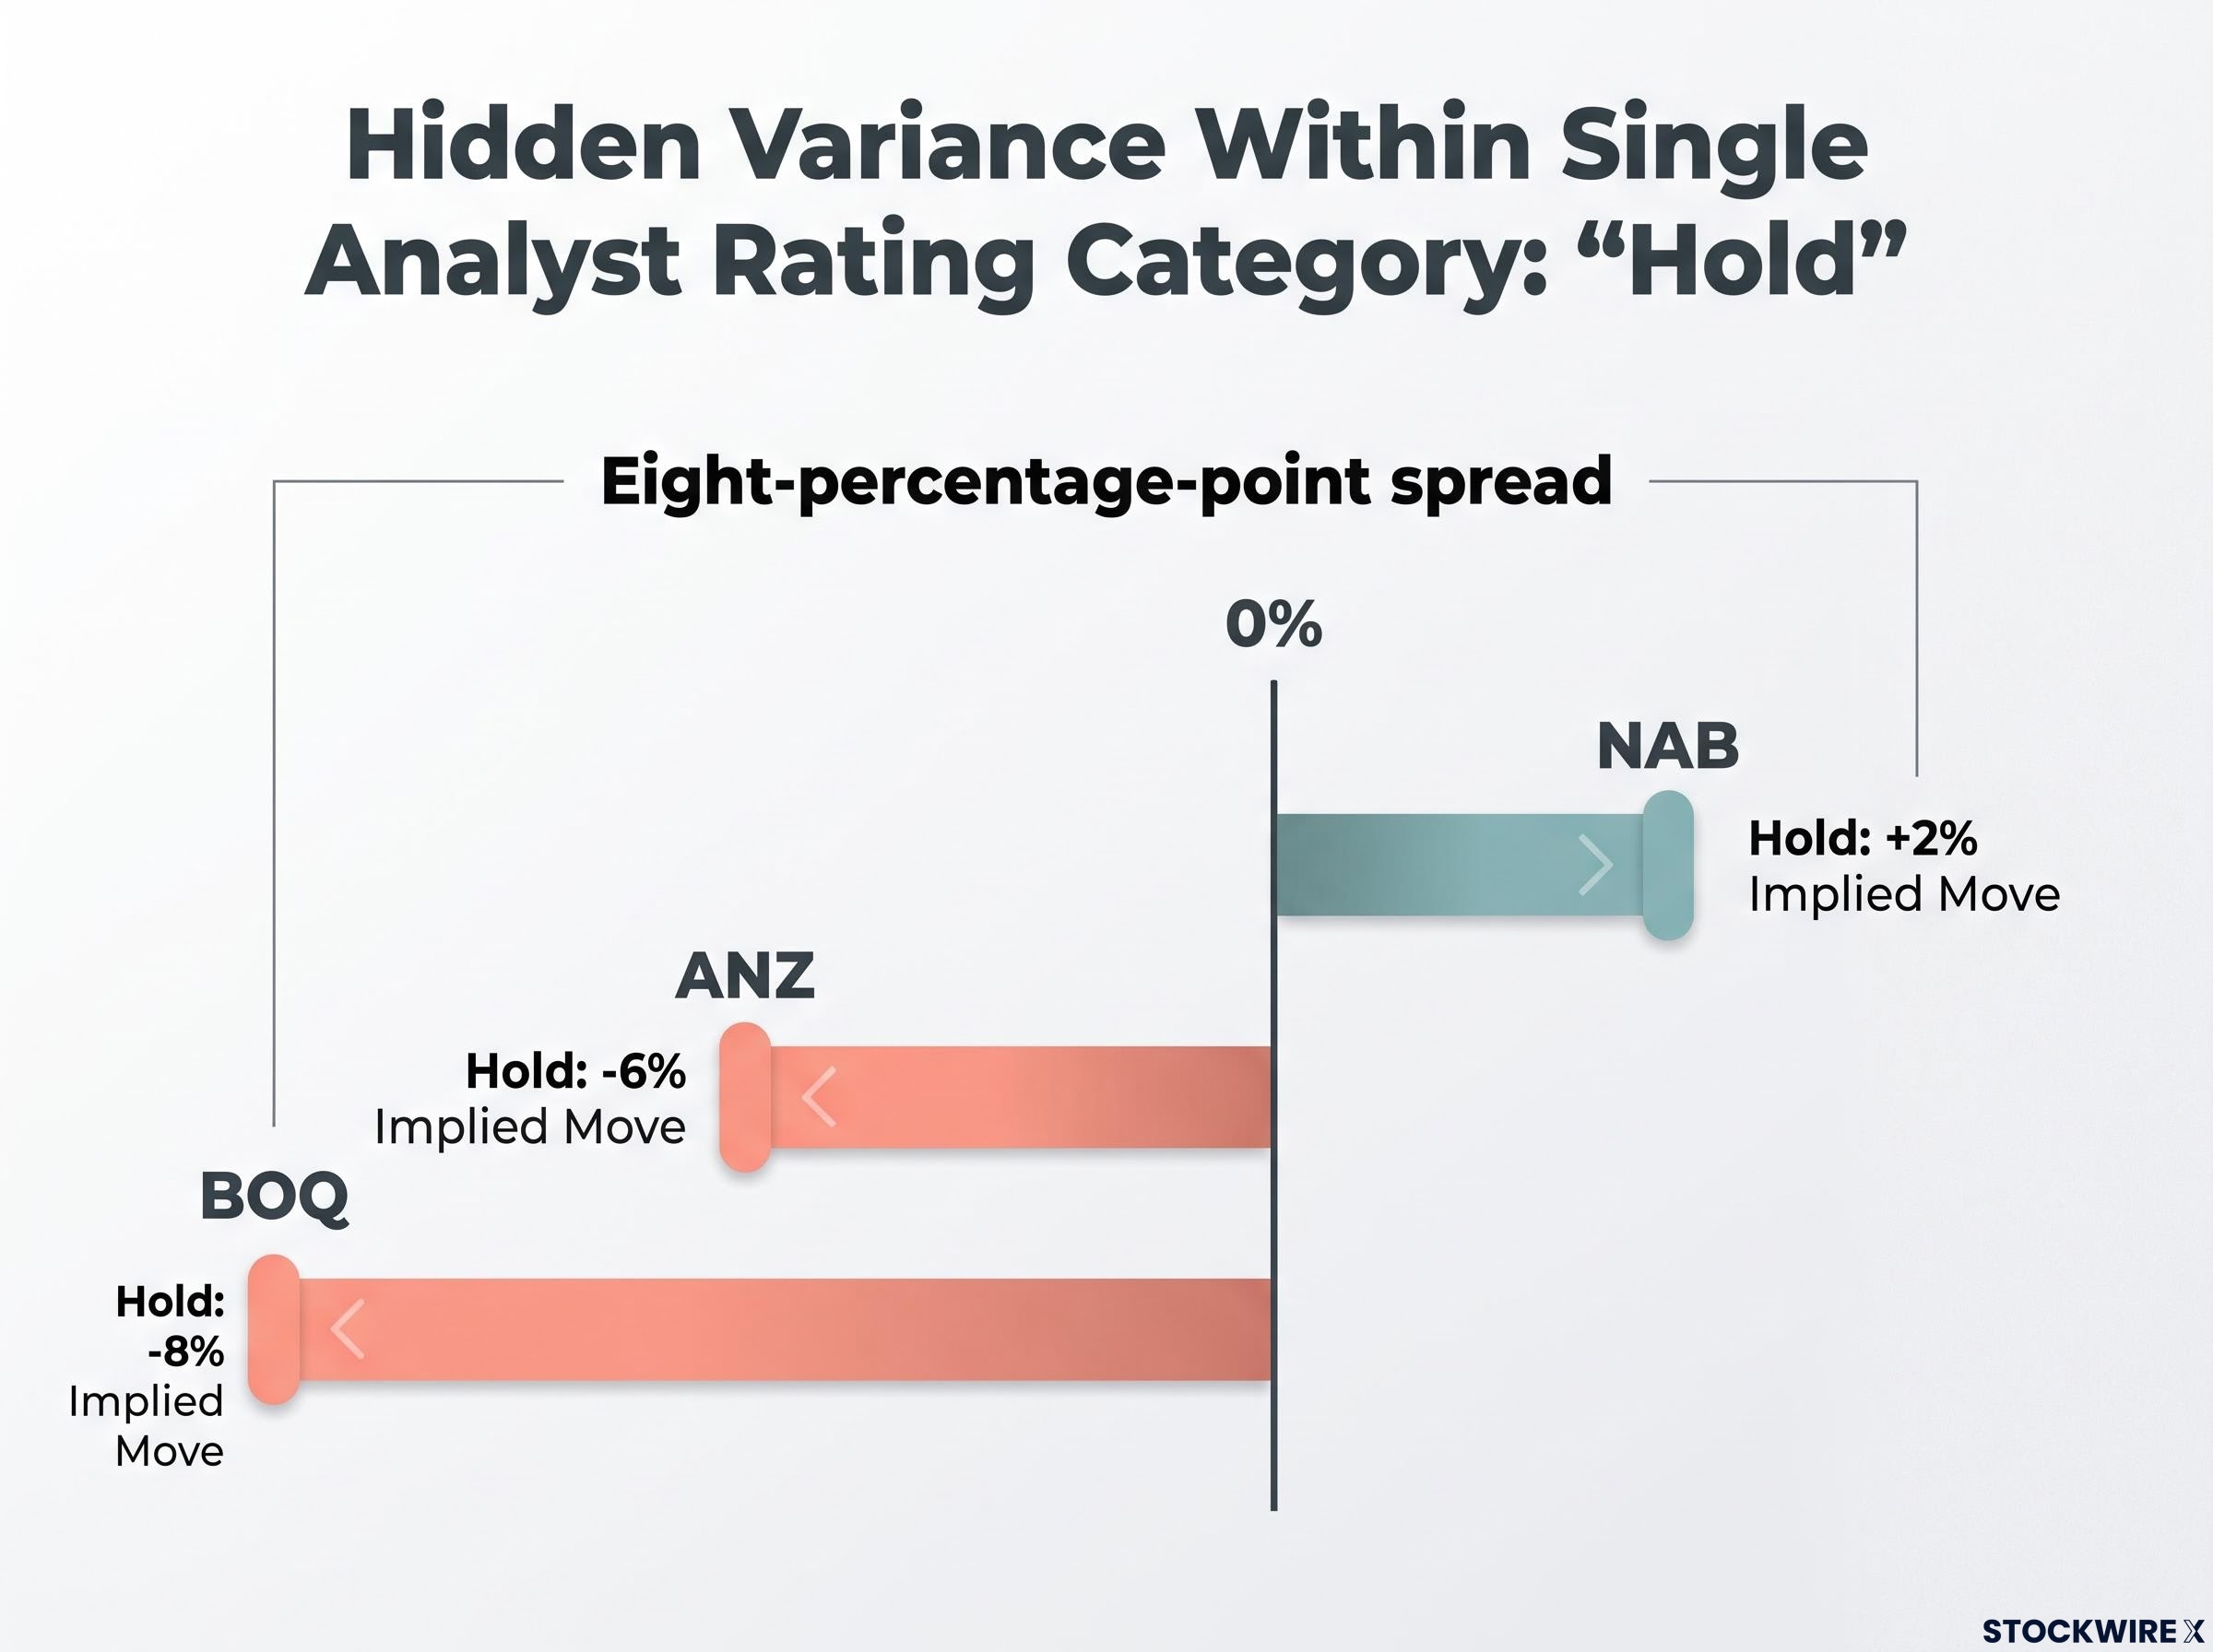
The read for you is simple: do not treat hold as a resting place. It is a range with a directional lean, and the price target gap tells you which way each name leans. A hold on NAB and a hold on BOQ are not the same instruction.
Mid-tier banks and Macquarie: reading past the hold ratings
Bank of Queensland’s -8% implied move, the weakest in the table, reflects analyst concern about margin pressure and limited diversification relative to its size. A smaller bank with a narrower income base has fewer levers to pull when NIMs compress.
Bendigo and Adelaide Bank sits on a sell rating but a modest -3% implied move, close to where Westpac also sits. That combination tells you analysts see limited upside at current pricing, but not acute downside risk either. The stock is judged roughly fair rather than dangerously stretched.
And then there is Macquarie: the only stock with a majority buy, +10% implied upside, despite falling around 2% in September. At the other end, CBA carries the strongest sell consensus and the largest projected downside of any bank in the group. That contrast is where the real positioning signal lives.
The CBA-versus-MQG divergence and what it tells investors about sector positioning
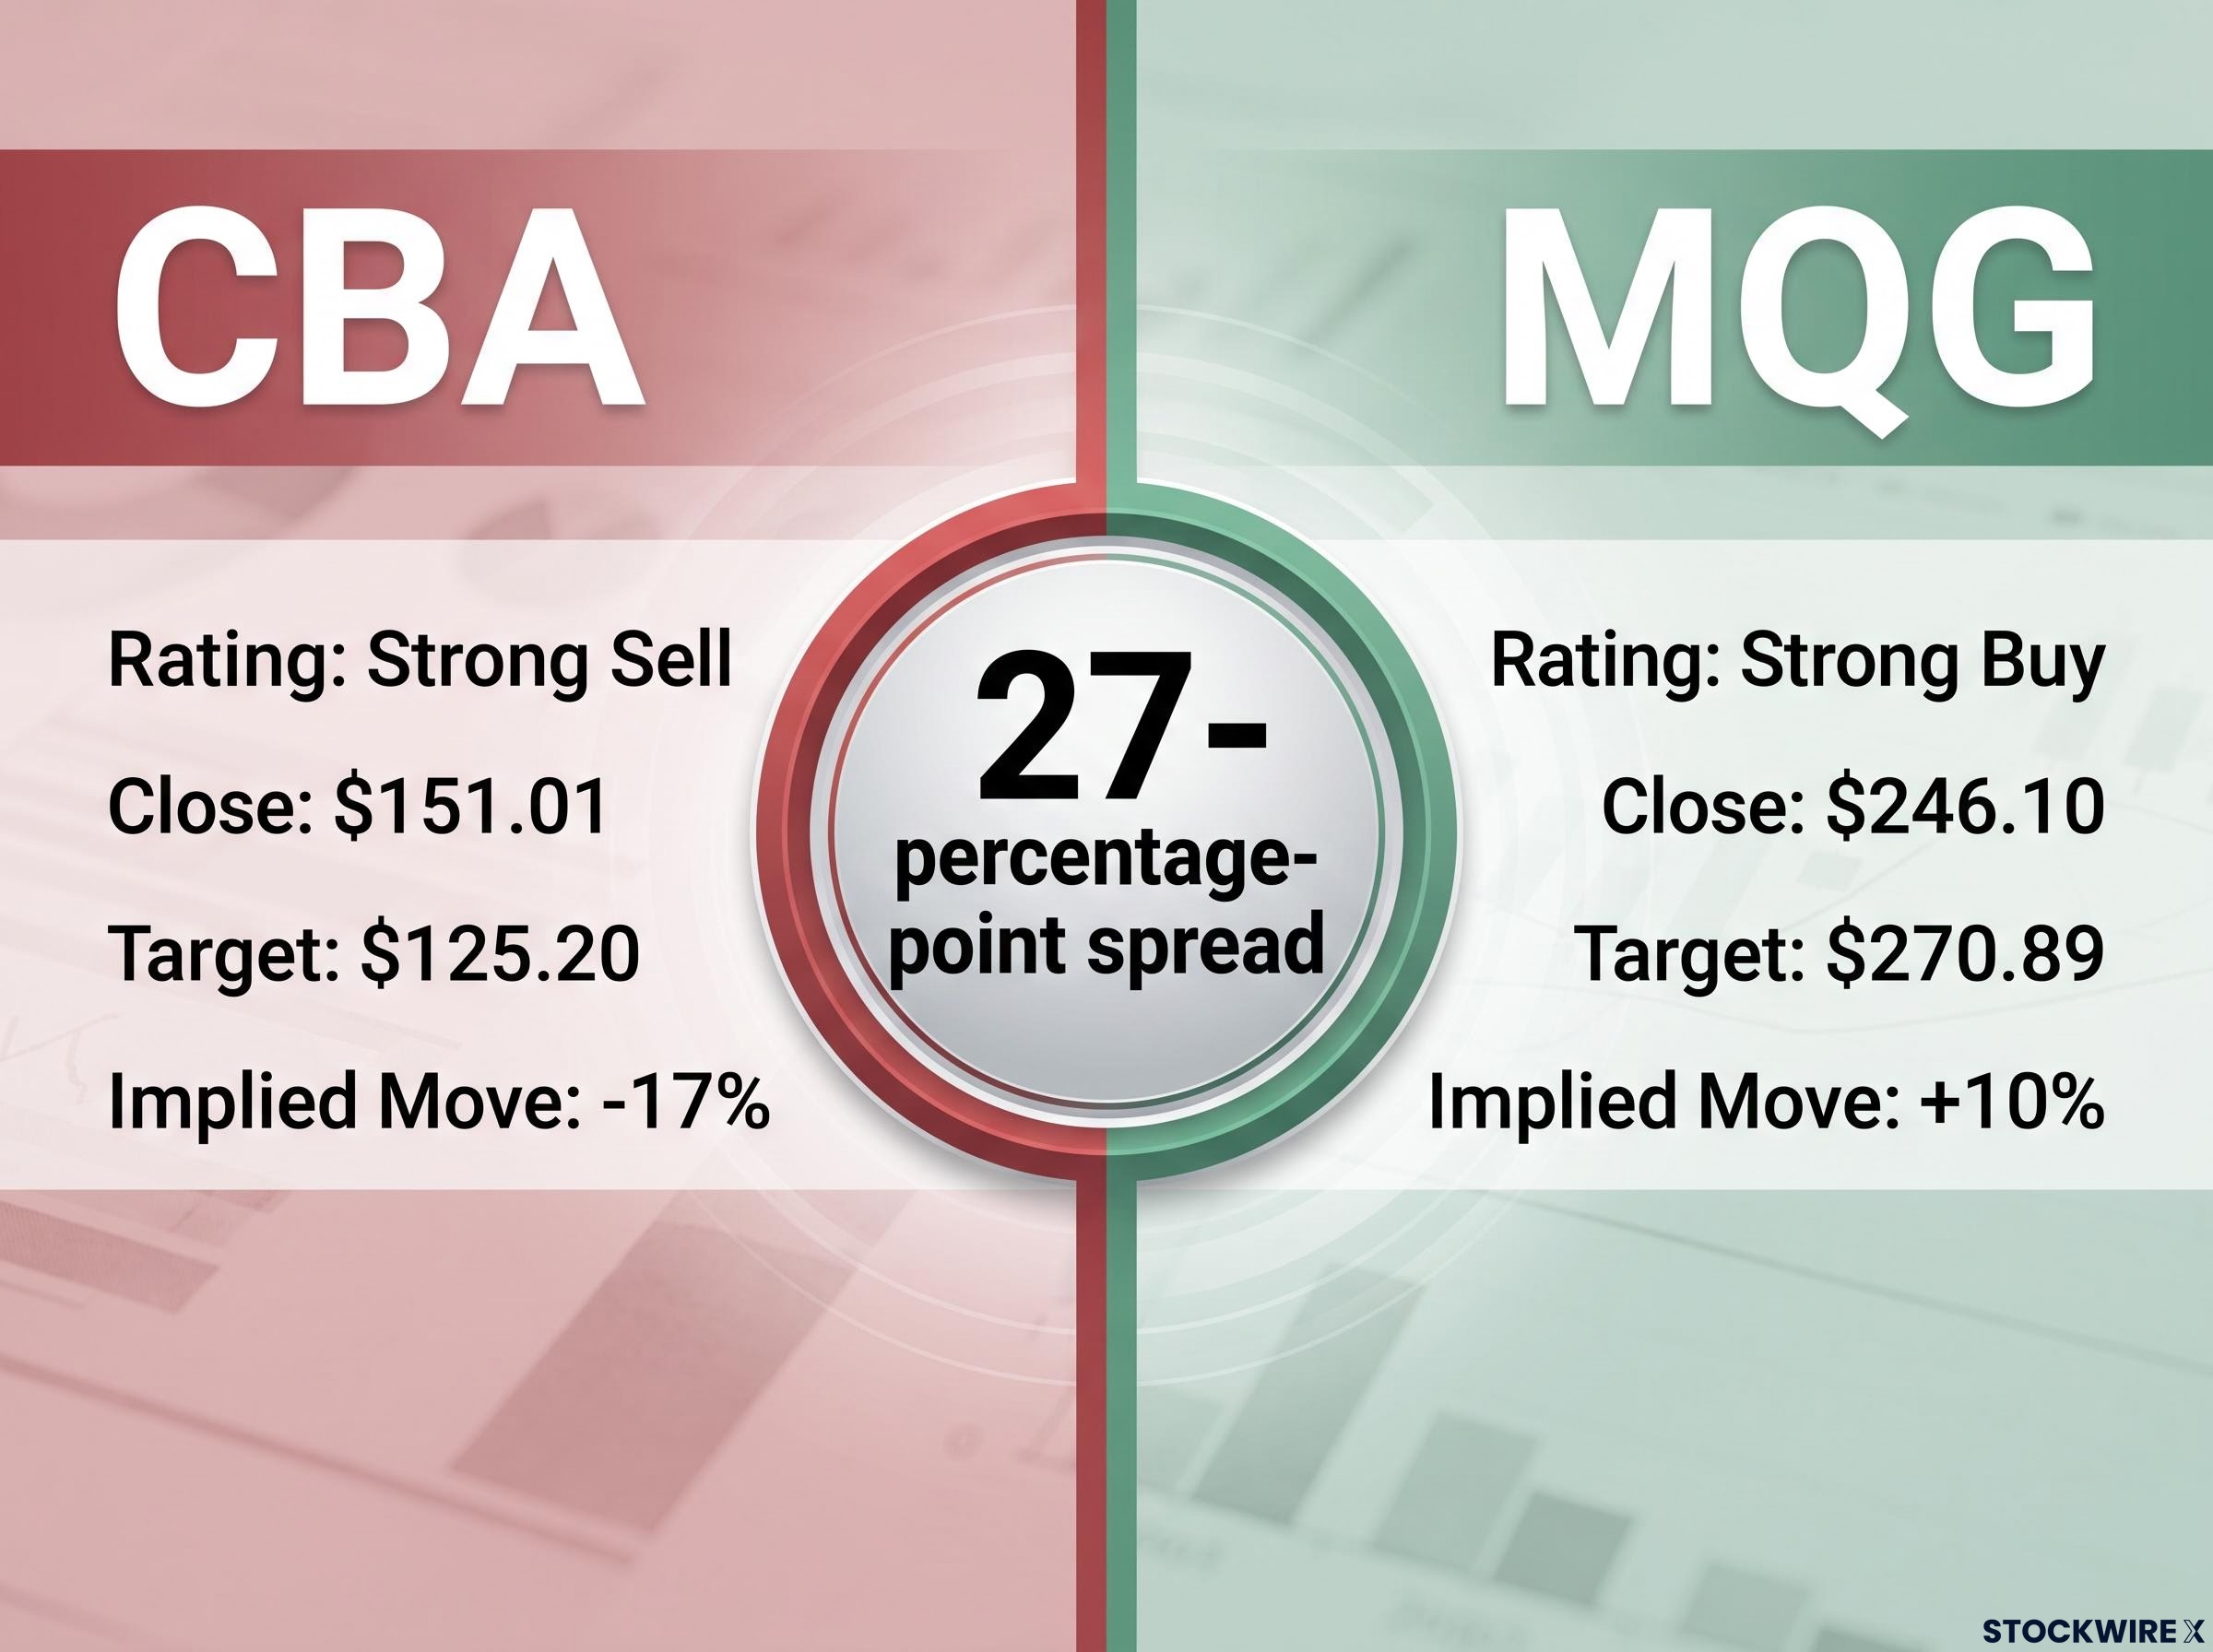
The sharpest signal in the entire dataset is the gap between two stocks in the same sector: CBA with roughly 17% implied downside, Macquarie with roughly 10% implied upside. That is a 27-percentage-point spread, and understanding why it exists gives you a framework you can apply well beyond these two names.
Start with CBA. The strong sell consensus is not a judgment that the franchise is weak. Analysts across UBS, Morgan Stanley, Morningstar and Macquarie broadly acknowledge CBA as operationally the strongest of the Big Four. The argument is about price.
CBA’s average analyst target of $125.20 against its end-September close of $151.01 implies downside of approximately 17%, the largest projected decline among all ASX bank stocks in this group.
CBA trades at a substantial premium to NAB, ANZ and Westpac on both price-to-earnings and price-to-book measures. The consensus view is that the quality premium has overshot, leaving the stock priced for perfection with little room for error. It also holds the largest Australian housing exposure of the Big Four, so when arrears and impairment risks rise, CBA has the most earnings at stake. That consensus has persisted for an extended period, with no change recorded in September 2026.
Macquarie is the mirror image. Its strong buy rests on business mix, not momentum. The group earns across investment banking, asset management, infrastructure and renewables, commodities and global markets, in addition to domestic banking. That diversification means its earnings are far less tethered to the Australian mortgage cycle squeezing the majors.
A large share of Macquarie’s income is fee-based and performance-linked, tied to global themes like infrastructure spending and the energy transition rather than local NIMs. Its commodities and markets divisions can also benefit from exactly the volatility that unsettles domestic lenders.
The read for you is not a tip to sell one and buy the other. The 27-point gap is telling you what kind of bank exposure analysts believe is correctly priced for this macro cycle, and what kind is not. The question to ask of your own holdings is whether you own the housing-concentrated, domestically focused risk brokers are discounting, or the diversified, fee-driven model attracting buy ratings.
The case for staying in Australian banks despite the macro headwinds
None of this makes the sector uninvestable, and there is a genuine competing view worth weighing rather than dismissing.
- Oligopoly structure: The Big Four dominate retail and business banking behind high barriers to entry, supporting pricing power even in tougher conditions.
- Capital strength: APRA-driven standards mean the majors hold robust CET1 ratios and heavy collective provisions, limiting downside to dividends and book value.
- Loan repricing flexibility: Banks can reprice variable loans, adjust fixed-rate offers and rebalance product mixes to offset funding-cost pressure.
- Digitisation savings: Branch rationalisation and digital investment have cut unit costs, protecting earnings even as credit growth slows.
- Franked dividend yield: Australian banks offer relatively high, franked yields, a particular draw for income-focused and self-managed superannuation fund investors.
Franked dividend yield mechanics create meaningfully different after-tax returns across investor types, with pension-phase SMSF members receiving franking credits as direct ATO cash refunds rather than tax offsets, which is why the income-focused case for holding the majors through a difficult rate cycle is strongest precisely for the investor group least concerned with capital appreciation.
Those last two points are specifically Australian, and they are why many domestic income investors hold the majors through cycles that worry institutional analysts. The sector sits in a balanced risk-reward position: elevated macro risk on one side, entrenched market position and capital strength on the other.
What the data is telling investors before October begins
Pull the three threads together and a single read emerges. The macro trajectory points to further tightening, September’s clean price signal showed the market discriminating between housing-heavy and diversified names, and the broker consensus confirms where analysts think the mispricing sits.
The near-term catalyst is the 3 November 2026 RBA board meeting. Westpac Economics’ base case is another 25 basis point hike. If that lands, it applies further pressure to the housing-concentrated franchises brokers are already discounting, and with headline inflation still running 100 basis points above the top of the 2-3% target band, the case for restraint is thin.
The read for you is that broker consensus is not a static scorecard. What changes the consensus matters more than what it currently says, so the inflection points are what to watch:
- The 3 November RBA decision. A hike validates the current bearish lean on housing-heavy names; a pause would complicate it.
- Any shift in CBA’s consensus. The strong sell has held unchanged for months. Movement here would be a meaningful signal that analysts see the valuation risk resolving.
- Macquarie’s next quarterly trading update. This is the read on whether the global diversification thesis underpinning its $270.89 target is actually tracking.
This article is for informational purposes only and should not be considered financial advice. Investors should conduct their own research and consult with financial professionals before making investment decisions.
Past performance does not guarantee future results. Financial projections and price targets are subject to market conditions and various risk factors, and these forward-looking statements are speculative and subject to change based on market developments.