A long-dated U.S. government bond ETF just posted eight straight losing sessions, printing the kind of price swings you would expect from a stock fund. In the same window, a newly public rocket company has traded within a narrow band, calm by comparison.
That is the inversion. TLT, the iShares 20+ Year Treasury Bond ETF, strung together eight consecutive down days starting around 22 September 2026, while its medium-duration cousin IEF broke below a support zone visible across roughly 25 years of price history.
For U.S. investors, this is not a trivia question. If you hold bonds directly, own a bond-heavy target-date fund, or sit in rate-sensitive equity sectors like real estate, homebuilders, financials, or utilities, the rising interest rates impact has already reached your statements. The rate environment has moved in ways that break the assumptions baked into most conventional portfolios.
Here is what the data actually tells you: the mechanics behind the inversion, which sectors feel it most, and what it means for how you weigh risk in your own holdings.
What TLT’s eight losing sessions are actually telling you
The starting point is not an opinion. It is a run of red on the screen.
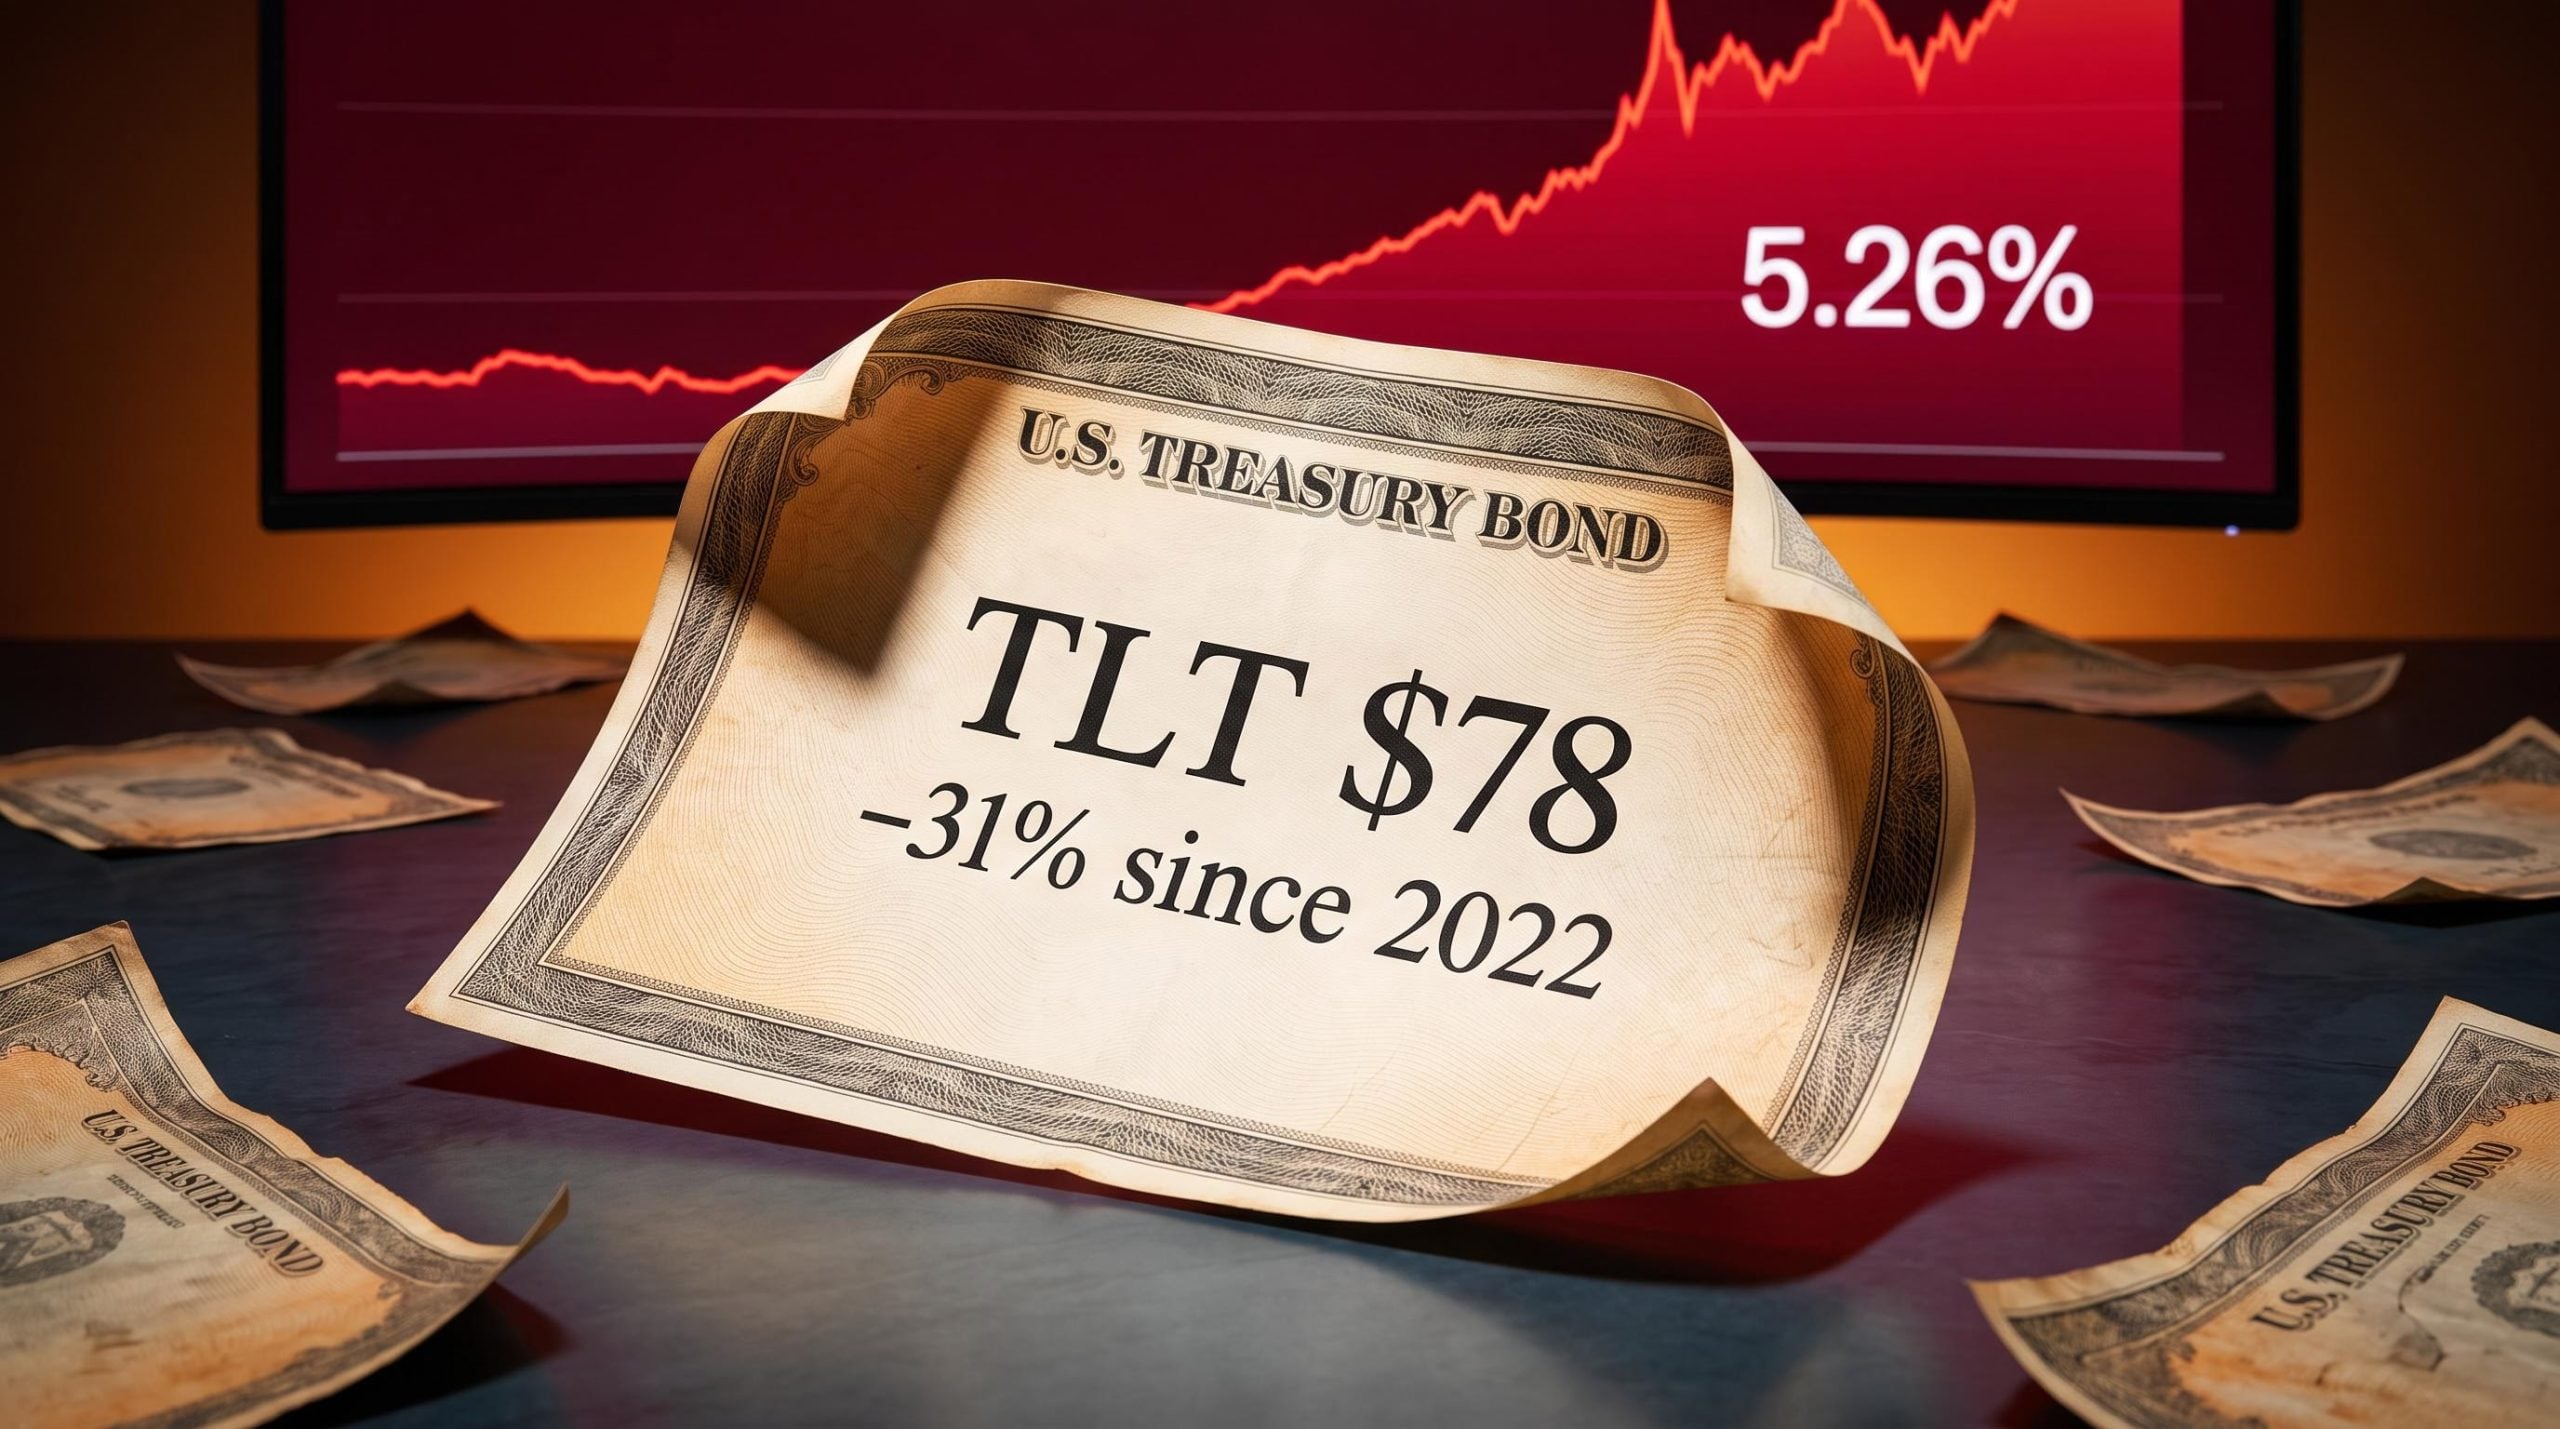
TLT has lost ground for eight sessions in a row, and the longer arc is worse: a cumulative price decline of roughly 31% since 2022, which averages out to about negative 6.7% per year over the past five years. IEF, with its shorter duration, has held up far better, averaging around negative 1% per year over the same five-year stretch before breaching that long-standing support level.
Here is how the two stack up right now:
- TLT: price near $78, 30-day SEC yield near 5.49%, five-year average annual return approximately negative 6.7%
- IEF: price approximately $95.25, five-year average annual return approximately negative 1%
None of this is a credit event. The U.S. government is not missing coupon payments. These losses are purely a function of how bond prices and yields move in opposite directions, amplified by how far out TLT sits on the maturity curve.
When yields rise, prices fall (and the math compounds quickly)
The rule of thumb is simple: when the yield on a bond rises, its price falls, and the longer the bond’s maturity, the harder that fall lands.
Treasury yields climbed repeatedly through late 2026, with the 10-year pushing toward multi-year highs across September and October. The 20-year sat near 5.25% and the 30-year near 5.24% in early September, and the long end kept grinding higher from there.
The 10-year Treasury yield reached approximately 5.26% in late September 2026, among its highest levels in years.
That matters because “safe” and “stable in price” are not the same thing. A Treasury can be safe from default and still hand you an equity-sized loss on paper, which is exactly what TLT holders have discovered.
When big ASX news breaks, our subscribers know first
Duration explained: the number that determines how much you lose
If you want to know how much a bond fund will move when rates shift, you only need one number: duration.
Effective duration is the approximate percentage change in a bond’s price for a one-percentage-point move in yield. It is, in plain terms, a measure of how leveraged your position is to interest rates.
Bond duration is the single number that translates a yield move into a dollar loss: a fund with a duration of 17 loses roughly $85,000 on a $500,000 position from a single one-percentage-point rate rise, compared to $30,000 for a fund with a duration of 6, even though both carry the label ‘bond fund.’
Work through the comparison. TLT carries an effective duration of roughly 15.39-16 years, so a 100-basis-point rise in long yields translates to roughly a 15-16% price decline before convexity effects. IEF, at an effective duration of about 7-8 years, would fall closer to 7-8% on the same move. Same rate shock, roughly double the pain.
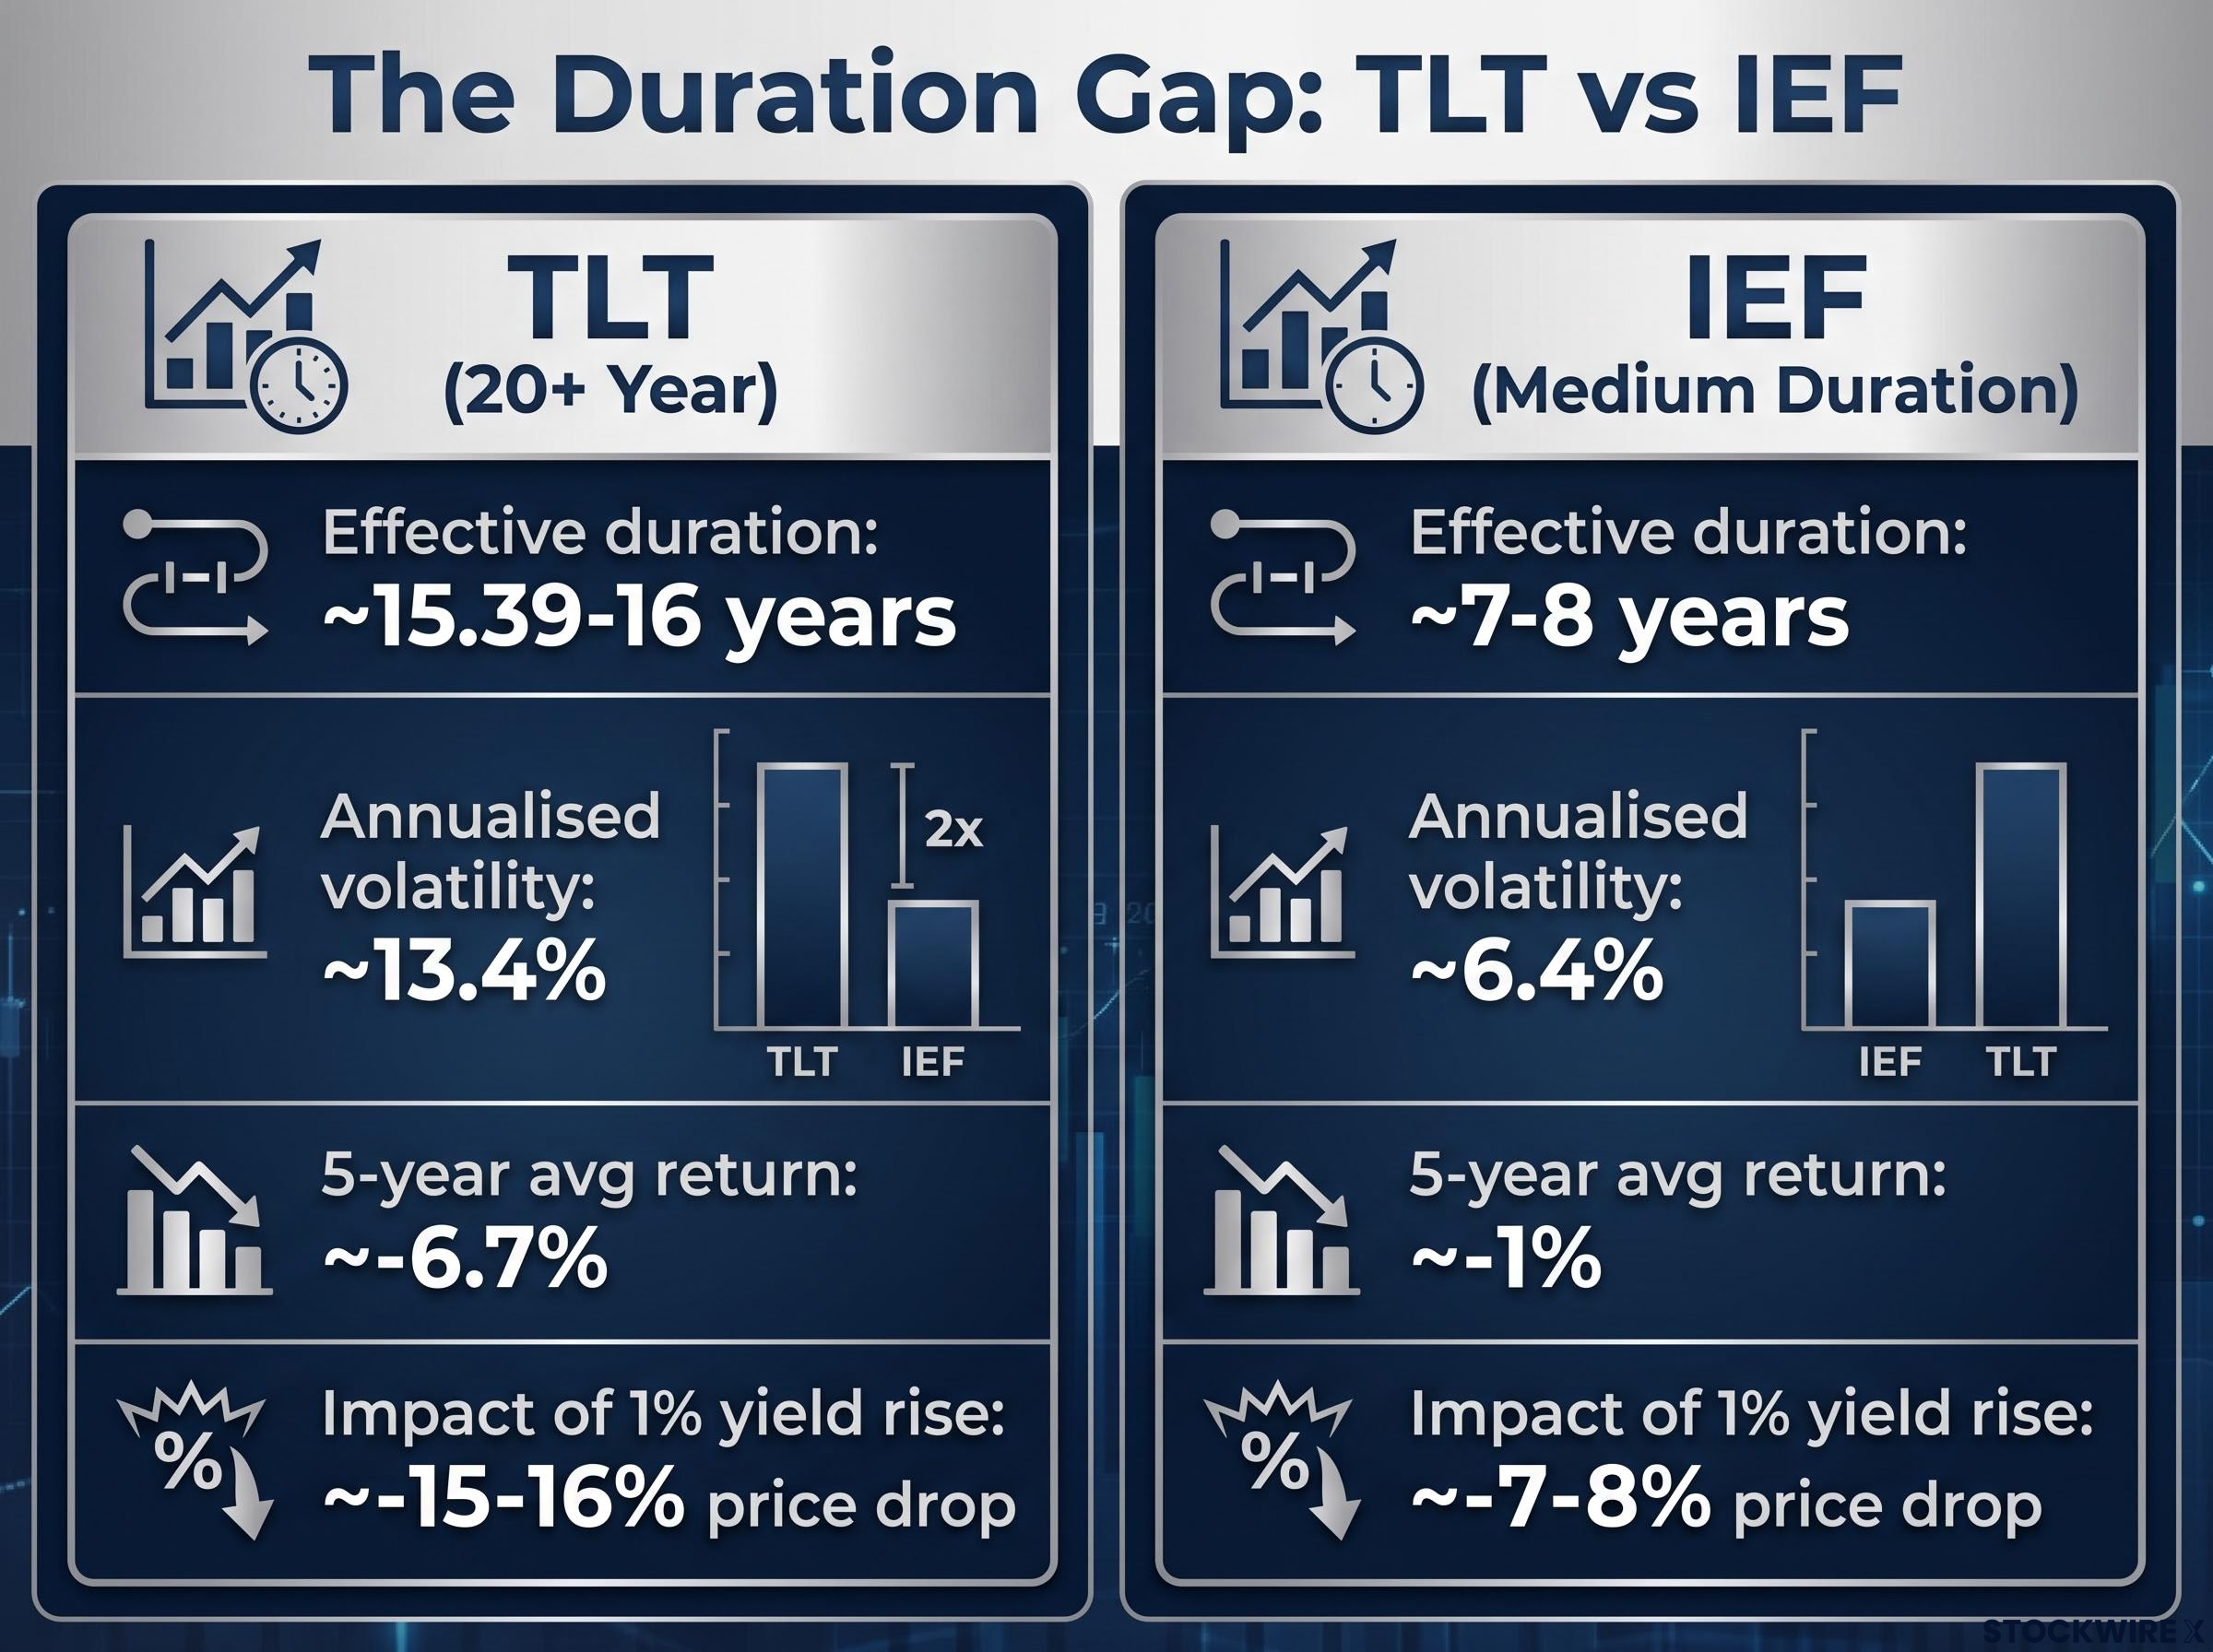
That single number explains the volatility gap. TLT’s annualised volatility sits near 13.4%, with a standard deviation around 13.89%, firmly in equity-fund territory. IEF’s annualised volatility runs closer to 6.4%, with a standard deviation near 6.8%, which is what most people expect from a bond.
| Metric | TLT | IEF | What it means |
|---|---|---|---|
| Effective duration | ~15.39-16 years | ~7-8 years | TLT carries roughly twice the rate sensitivity |
| Annualised volatility | ~13.4% | ~6.4% | TLT swings like an equity fund; IEF like a bond |
| Five-year average annual return | ~-6.7% | ~-1% | Long duration has been deeply punished |
| Impact of 1% yield rise | ~-15-16% | ~-7-8% | The duration number is your loss estimate |
A 7 September 2026 report made the same point in portfolio terms: a one-percentage-point rise in long yields would knock roughly 16% off a 20-plus-year bond portfolio, framing long Treasuries explicitly as a source of mark-to-market risk comparable to equities. Once you read duration as a leverage number, you can apply it to any bond fund you own, and you can see why the TLT holder is taking on far more rate risk without proportionally more yield to show for it.
How SpaceX ended up looking safer than a government bond
Now the strangeness lands. A government bond ETF has been swinging at roughly 13-14% annualised volatility, while SpaceX, one of the most aggressive growth stories on the market, has traded in a comparatively tight band near $150-$155 since going public.
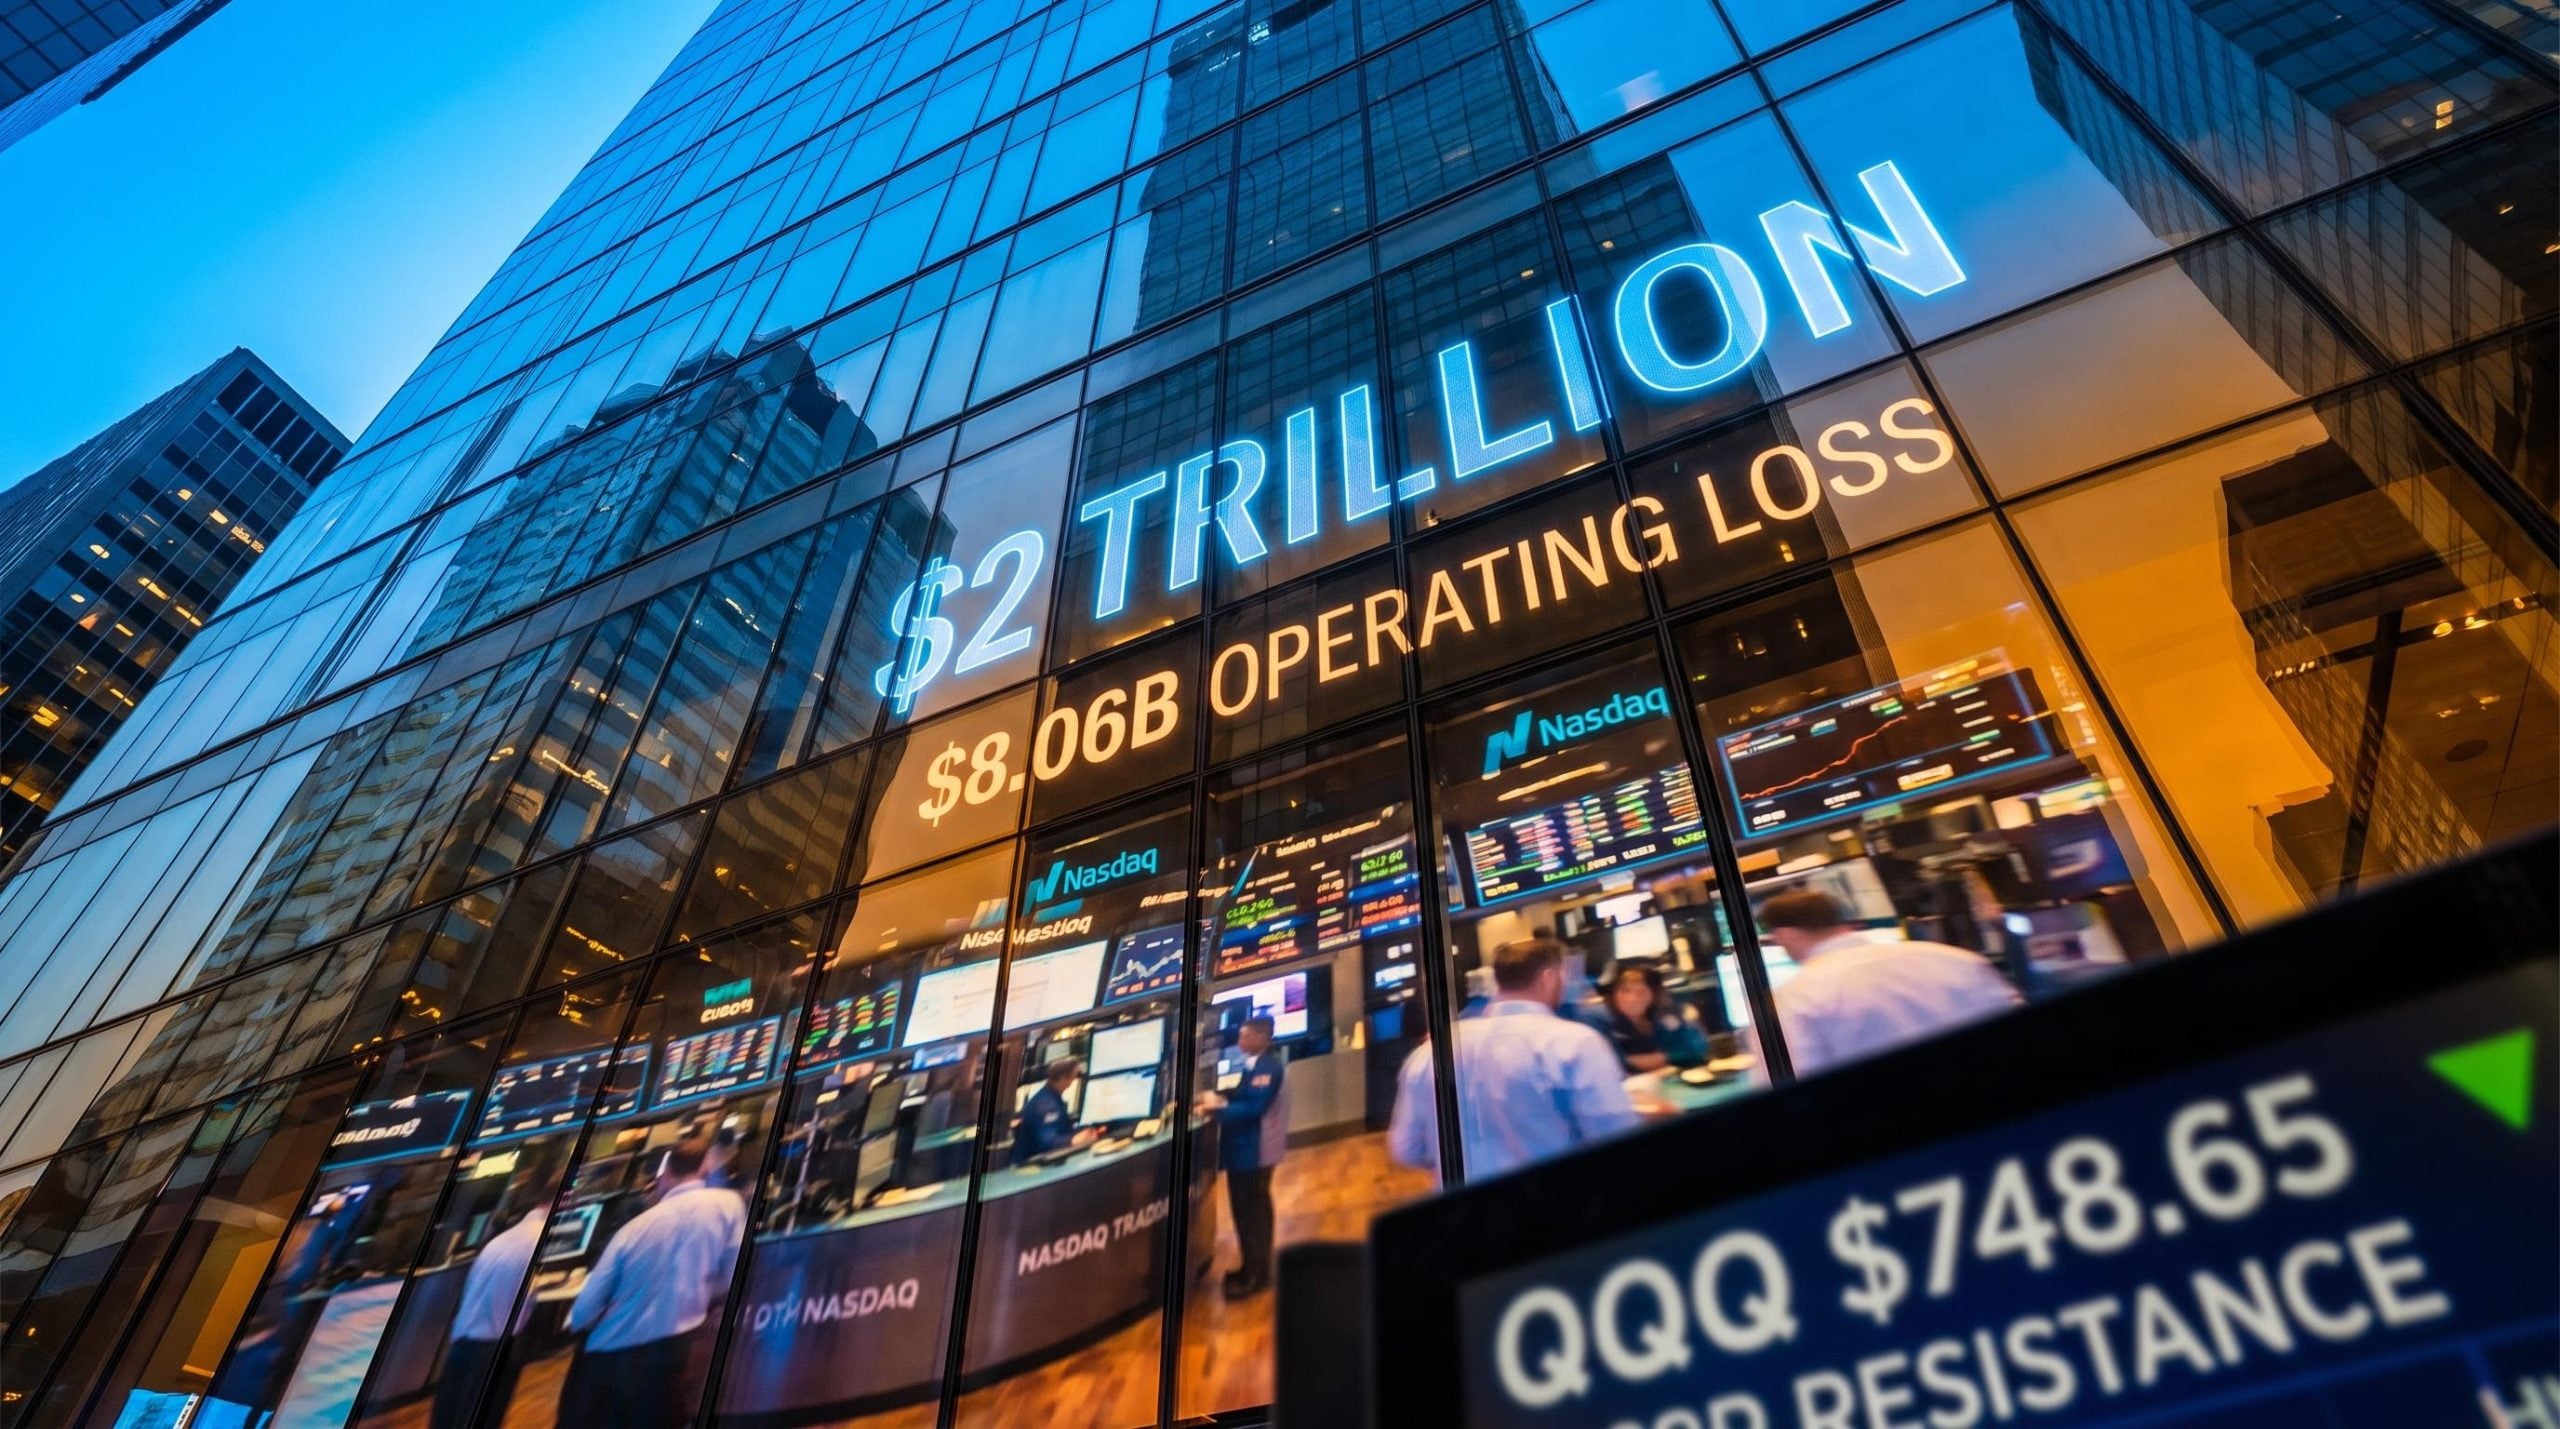
The rocket company priced its IPO at $135 per share in June 2026, closed its first day near $161, and has since settled into that narrow range at a market capitalisation close to $2 trillion. Set against TLT’s eight-session slide, the apparent calm of a newly listed space company looks like the risk hierarchy flipping on its head.
That calm deserves scrutiny. SpaceX’s pre-IPO price history ran from an implied valuation near $560 billion in early 2025, to roughly $800 billion in a December 2025 secondary sale, to about $1.75 trillion at IPO, and much of that journey happened in illiquid secondary markets. Those markets traded through opaque special-purpose vehicles with limited price discovery, which suppresses measured volatility rather than proving genuine stability. Infrequent marks produce smooth charts; they do not produce safety.

A one-percentage-point rise in long yields would knock roughly 16% off a 20-plus-year Treasury bond portfolio, which is why the world’s largest sovereign wealth fund was reported to be weighing the sale of around $80 billion of long-dated Treasuries.
The useful move here is to stop treating “safe” as one idea. It is really three separate questions:
- Safe from default
- Safe from mark-to-market loss
- Safe from a liquidity crisis
SpaceX’s apparent stability answers only the third, and only for now. TLT is failing the second in a visible, measurable way, while still passing the first and third convincingly.
Why institutional investors are not abandoning Treasuries entirely
Bond managers at firms such as PIMCO and BlackRock caution against reading the inversion as the end of Treasuries. Their point is that default-free status, deep liquidity, and crisis-scenario diversification are distinct properties from short-term price volatility, and a bad year of mark-to-market losses does not erase them.
The sharper framing is that the risk hierarchy has not simply flipped; it has become multi-dimensional. Which risk matters most depends on your horizon and the kind of shock you are hedging against, and a long Treasury can be the wrong tool over three months and the right tool in a genuine equity crisis.
Where rising rates hit hardest across the market
Rate risk does not stay inside bond funds. It travels through every asset whose valuation leans on the yield curve, and that curve has been moving sharply and persistently.
Real estate feels it first. IYR, the real estate ETF, fell from roughly $107 on 28 July to around $95 in a short, continuous slide, as higher Treasury yields lifted the discount rates and cap rates applied to property income. Financials followed: XLF dropped close to 10% from an all-time high of $58.39 to about $53.55, as rising yields inflicted mark-to-market losses on bank securities portfolios even where higher rates widen lending margins.
The damage extends beyond mark-to-market losses on securities portfolios: regional and community banks carry commercial real estate concentrations of 289-314% of Tier 1 capital, facing a $930 billion maturity wall in 2026 alone, a source of refinancing pressure that the aggregate ‘banking system is resilient’ framing tends to obscure.
Homebuilders carry a wrinkle worth knowing. Lennar was flagged as a short on a large topping pattern and slipped about 1.6% on the referenced session, with Floor & Decor declining alongside it, yet persistent housing shortages and demographic demand can cushion rate-driven affordability pressure, so the drawdowns may run milder than a pure rate model predicts.
| Sector / ETF | Transmission mechanism | Observed drawdown | Structural caveat |
|---|---|---|---|
| Real Estate (IYR) | Higher yields lift cap rates, lowering property valuations | ~$107 to ~$95 | Leveraged commercial property faces added refinancing stress |
| Financials (XLF) | Mark-to-market losses on securities offset wider margins | ~10% from $58.39 to $53.55 | Well-funded banks may still benefit from wider margins |
| Homebuilders (XHB / Lennar) | Mortgage rates cut affordability and marginal demand | Lennar ~-1.6% on session | Housing shortages can soften the hit |
| Utilities | Higher discount rates compress regulated cash flows | Valuation compression | High leverage also raises interest expense directly |
| Home Improvement (Home Depot) | Housing slowdown dampens renovation and project spend | ~30% from $400+ peak | Drawdown comparable to its 2008 decline |
Home Depot makes the point vivid. The stock peaked above $400 after the 2024 election and has since fallen into the $200s, roughly a 30% drawdown from peak, a decline the original source described as comparable in magnitude to its 2008 financial crisis fall. If any of these sit in your retirement account or equity sleeve, the message is that rate damage is accumulating across the whole book, not just the bond portion.
Has this happened before, and how long did it last?
Bond market dislocations are not new, and three past episodes help you calibrate whether this one resolves quickly or grinds on.
- 1994 Bond Massacre: triggered by a surprise, rapid Fed tightening cycle that inflicted heavy losses on long-duration holders; it resolved relatively quickly once the tightening path became telegraphed and predictable; today differs because the move starts from far higher debt levels and heavier sovereign supply.
- 2013 Taper Tantrum: triggered by the Fed signalling reduced asset purchases, which sent yields jumping; it stayed short-lived because it was a communication shock rather than realised rate hikes; today differs because the market is pricing both actual hikes and a structural reassessment of deficits.
- 2022-2026 rate shock: triggered by aggressive tightening and inflation surprises, producing TLT’s roughly 31% cumulative loss and negative 6.7% average annual return; what makes it harder to time is that the 2025-2026 phase is driven by persistent fiscal deficits, sovereign supply pressure, and term-premium repricing rather than a simple inflation catch-up.
Commentary around Treasury Secretary Scott Bessent’s public statements was cited in the original source as adding to the sour sentiment during the reference period, feeding the sense that the long end had further to adjust.
The deeper context behind this episode is that the QE decade, when 10-year yields averaged 1.5-3%, was the historical outlier produced by unprecedented central bank intervention; the current level of long yields reflects the removal of artificial suppression rather than a new and alarming regime, though the fiscal arithmetic at current debt levels makes the adjustment structurally harder to reverse than in previous cycles.
The 2022-2026 episode is driven by fiscal deficit scale and term-premium repricing, not just a policy-rate adjustment, which makes it structurally harder to time than either 1994 or 2013.
The historical base rate tells you these dislocations do eventually resolve. It also tells you this one has already lasted longer and cut deeper than either precedent, so assuming a quick snapback is less supported by the evidence than it might feel in the moment.
What the rate chaos changes about how you position from here
The central insight is not that bonds are broken. It is that the old risk hierarchy has become horizon-dependent and multi-dimensional, so you need to be explicit about which type of risk you are actually managing.
That cuts both ways. TLT’s 15-16 year duration means the same math that cost holders roughly 16% on a one-point rate rise would add roughly 16% on a one-point fall, and a violent short-covering rally remains on the table, particularly as October’s political and policy attention intensifies.
So before you touch any rate-sensitive holding, run it through three questions:
- What is the duration of this asset? That number is your loss and gain estimate for every one-point move in yields.
- Which type of safety does it actually provide? Safe from default, safe from mark-to-market loss, or safe from a liquidity crisis. They are not the same.
- What is my horizon relative to this holding’s duration? A 15-year duration bond held for 18 months is a very different bet than the same bond held to maturity.
The takeaway is not “avoid bonds” or “buy bonds.” It is know your duration, know your horizon, and know which risk you are being paid to take.
This article is for informational purposes only and should not be considered financial advice. Investors should conduct their own research and consult with financial professionals before making investment decisions. Past performance does not guarantee future results, and financial projections are subject to market conditions and various risk factors.