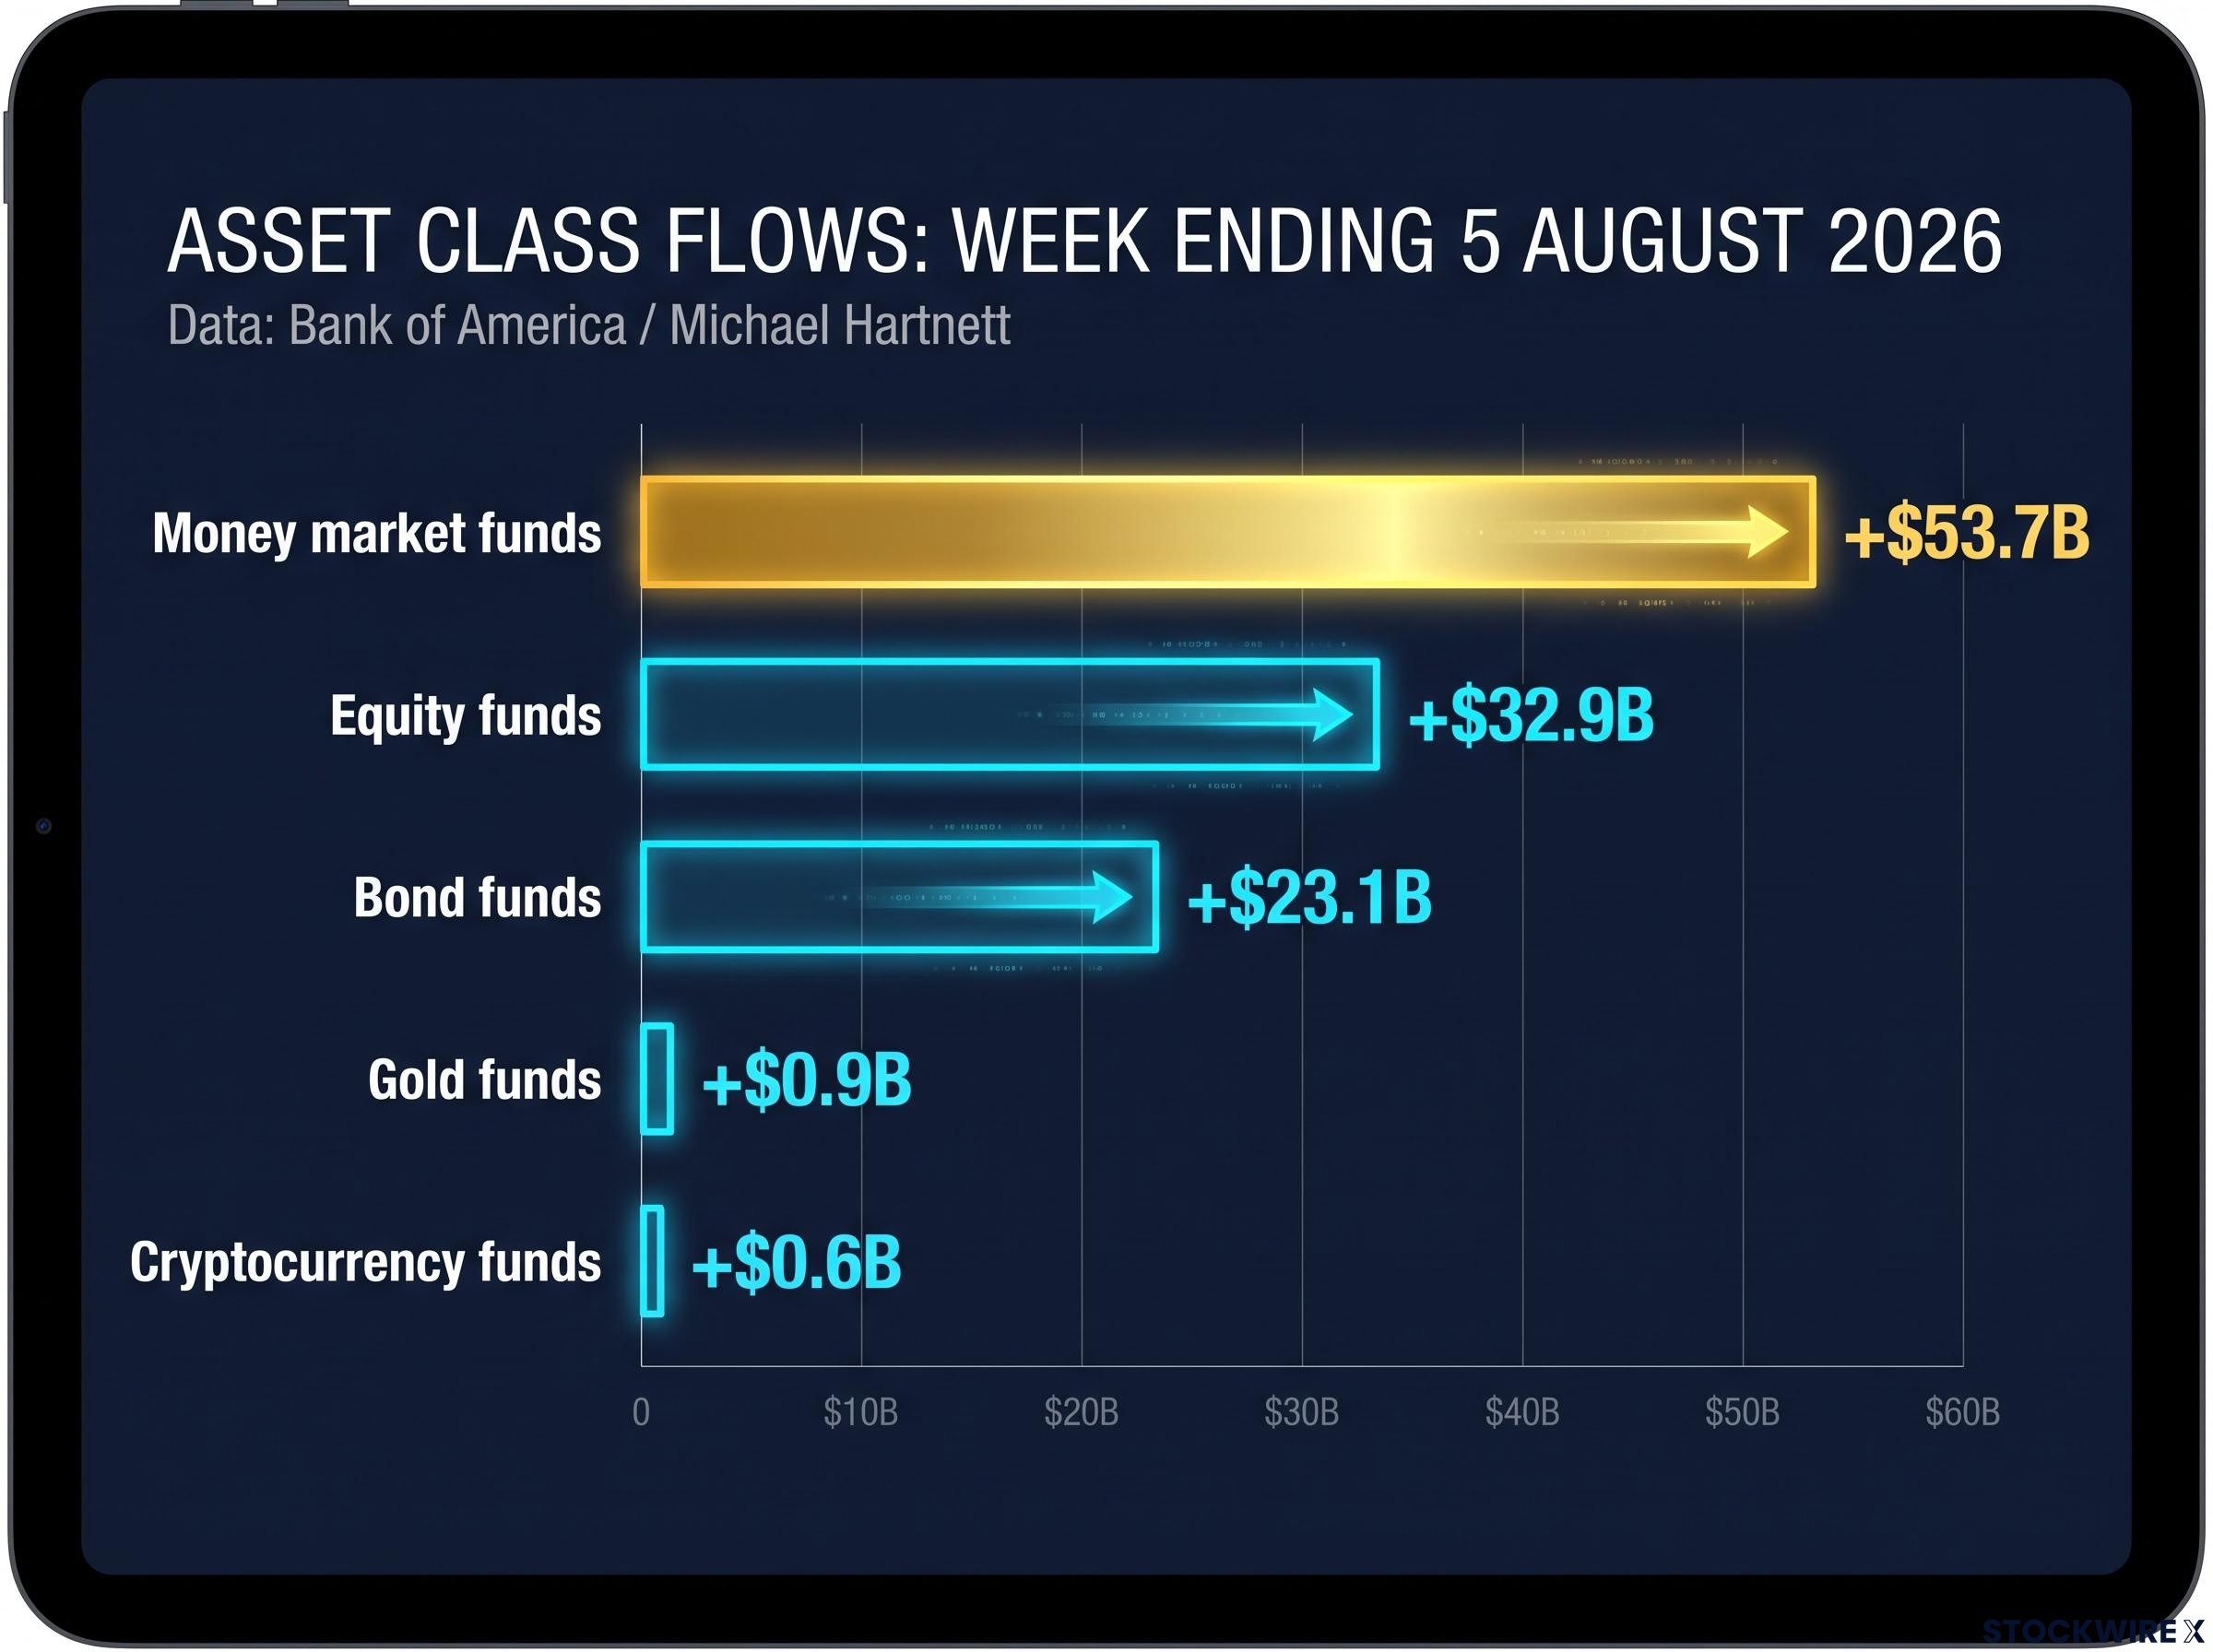
Money market funds captured $53.7 billion in a single week, while that same period to 5 August 2026 also saw capital flowing into equities, bonds, gold, and cryptocurrency all at once. That is not a straightforward risk-on signal. It is something more complicated.
The data, drawn from Bank of America’s weekly flow report as compiled by Michael Hartnett, captures a market defined by selectivity rather than exuberance. U.S. equities and technology are running at record annualised inflow paces. Emerging markets delivered a strong single week while their annualised trend remains the most negative it has been since 2015. These are not contradictions to smooth over. They are the story.
Here is where institutional and retail capital actually went this week, what the headline numbers compress into a single sentiment label, and what the underlying trends tell you about the dominant investment thesis of this moment.
The week’s full flow picture: risk-on with a very large safety net
| Asset Class | Weekly Flow (Week Ending 5 August 2026) |
|---|---|
| Money market funds | +$53.7B |
| Equity funds | +$32.9B |
| Bond funds | +$23.1B |
| Gold funds | +$0.9B |
| Cryptocurrency funds | +$0.6B |
Every category was positive. That is the risk-on headline. But the cash figure is not a footnote. It dwarfs gold and crypto inflows combined and represents more than 60% of equity inflows in absolute size.
The posture is best characterised as “buy risk, keep the parachute.” Investors are expressing risk appetite while maintaining substantial downside optionality, which is categorically different from a conviction-driven risk-on rotation.
The $23.1 billion in bond inflows arriving alongside strong equity inflows reinforces the picture. This is not an all-in equity bet. It is a late-cycle posture where investors want growth exposure but still want duration, income, and a very large cash cushion sitting underneath it all.
When big ASX news breaks, our subscribers know first
Sector rotation in focus: what the tech outflow and $217 billion annualised run rate reveal together
For the first time in six weeks, technology funds recorded a net weekly outflow, registering -$0.7 billion for the period. Read in isolation, that looks like the start of a rotation away from tech.
Read against the annualised figure, it looks like a rounding error.
What the annualised data tells you
The annualised inflow pace for technology sits at +$217 billion, a record. That figure reflects persistent, structurally embedded conviction in AI infrastructure, cloud scale, and software platform economics.
Two questions matter here, and they have different answers:
- Is tech in trouble? No. A $0.7 billion weekly outflow against a $217 billion annualised run rate is short-term profit-taking, not a reversal.
- Is tech crowded? Yes. The crowding risk is not that investors are selling. It is that positioning is rich enough that future outperformance depends increasingly on earnings delivery rather than multiple expansion driven by ongoing inflows.
That distinction, between a tactical outflow and a structural reversal, is what determines whether a tech overweight still makes sense or whether the trade has become a consensus position with diminishing forward returns.
Record inflow pace, concentrated positioning: reading the U.S. equity dominance data
Weekly inflows into U.S. equities reached +$9.6 billion, pushing the annualised pace to a record $652 billion.
That figure carries real gravity. Passive vehicles (index funds and exchange-traded funds) and the dollar’s reserve-currency status structurally amplify U.S. inflows beyond what active conviction alone would produce. The result is a self-reinforcing dynamic where flows push index weights higher, which attracts more passive capital, which pushes weights higher again.
At a $652 billion annualised pace, flows themselves become a positioning indicator. The marginal buyer is an increasingly important variable: the more future optimism that has already been “pre-paid” through flows, the less room remains for further appreciation without an earnings catalyst to justify the positioning.
Both readings of this data are simultaneously valid and worth holding:
- Bullish signal: The scale validates U.S. equity leadership. Genuine institutional and retail conviction is driving flows at unprecedented levels.
- Crowding risk: A substantial portion of expected future returns may already be embedded in current positioning and valuations. Sophisticated investors monitor record inflow paces as a contrarian risk indicator for exactly this reason.
Technology’s first weekly outflow in six weeks sits inside this broader picture. U.S. equity dominance is primarily an index and large-cap phenomenon, and tech sits at its core.
Barclays framed June 2026’s $150 billion monthly U.S. equity inflow as a FOMO culmination rather than a fundamental re-rating, arguing that crowding risk in U.S. equities reaches its most dangerous form when every potential buyer has already committed capital, capping upside while amplifying the velocity of any reversal.
What the emerging markets paradox reveals about how institutions actually use EM
On a weekly basis, emerging market equities attracted +$8.6 billion, which might suggest recovering appetite for the asset class. The annualised picture tells a different story: flows are running at -$55 billion per year, the weakest reading since 2015.
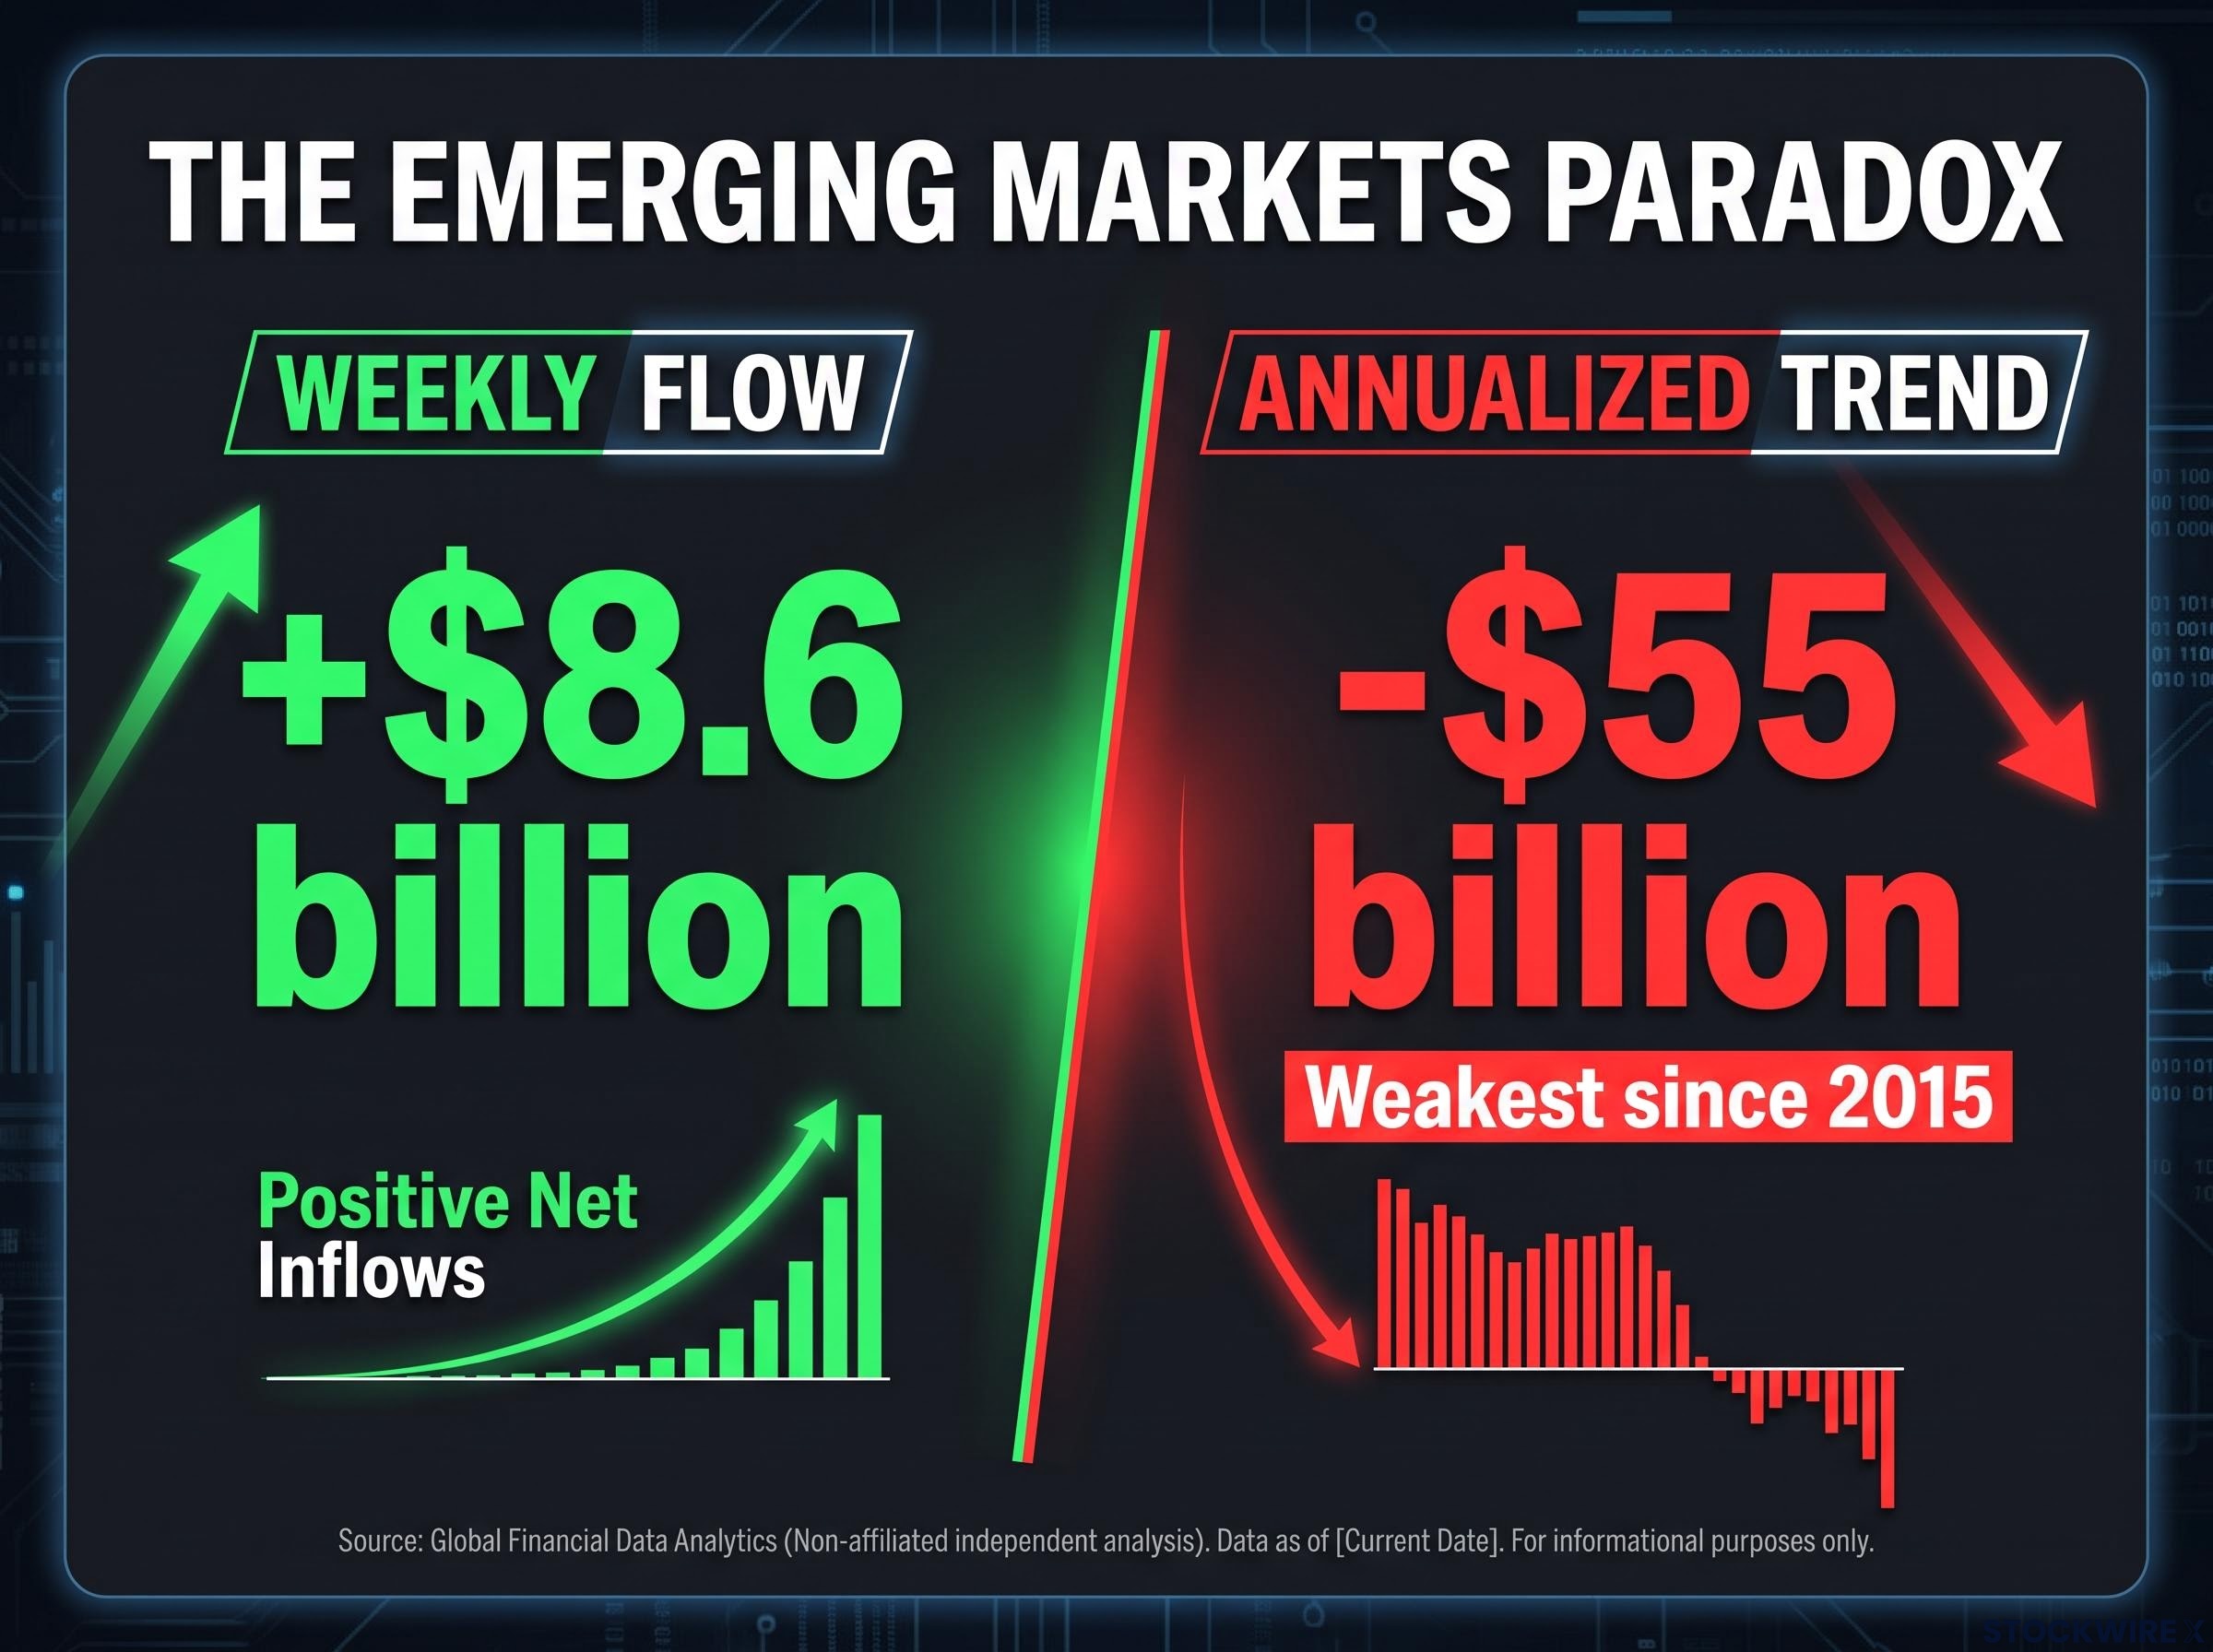
The two numbers are not separate data points. They are a matched pair that reveals how institutions actually interact with EM. The weekly figure suggests risk appetite. The annualised figure says investors are withdrawing capital at crisis-comparable levels, a period that combined a China slowdown, a commodity bust, and Fed liftoff pressure on EM currencies and balance sheets.
This pattern, strong single-week inflows against a deteriorating annual trend, is the signature of tactical positioning without strategic conviction. Investors are likely trading catalysts (foreign exchange moves, commodity prices, country-specific news) rather than rebuilding long-term EM allocations.
EM is a market investors trade but do not trust.
Until annualised flows show sustained reversal across multiple weeks, the +$8.6 billion is better read as short-covering or catalyst-driven trading than as evidence that institutional allocators are rebuilding structural EM positions.
The structural EM outperformance case rests on four forces identified by Morningstar, including a 10th-percentile valuation relative to U.S. equities, the first confirmed dollar downcycle since the early 2000s, a projected 40% cumulative EPS growth cycle through 2027, and China’s reduced index weighting reducing single-country concentration risk, none of which are visible in the weekly flow data alone.
- What the weekly figure suggests: Risk appetite is returning, and EM may be turning a corner.
- What the annualised figure suggests: The structural underweight remains deeply entrenched, and single-week inflows have not historically predicted regime shifts without multi-week follow-through.
The EM paradox is the most consequential unresolved question in this week’s data.
Sustained conviction versus tentative stabilisation: comparing developed market flow patterns outside the U.S.
| Market | Weekly Flow | Streak / Context | Institutional Driver |
|---|---|---|---|
| Japan | +$2.6B | Ninth consecutive week of inflows | Corporate governance reform, BOJ normalisation, currency/exports narrative |
| Europe | +$55M | First positive week in three weeks | Stabilisation; structural headwinds persist |
Japan: nine weeks and a specific thesis
Nine consecutive weeks of inflows is institutional behaviour, not tactical noise. The flows validate a specific investment case built around three pillars: corporate governance reform driving higher shareholder returns through buybacks and dividends; Bank of Japan (BOJ) policy normalisation, which reduces the distortions of ultra-loose monetary policy and makes Japanese equities more conventionally investable; and a currency and exports narrative that continues to attract global allocators seeking non-U.S. developed market exposure.
Japan’s structural equity drivers, corporate governance reform lifting average TOPIX price-to-book from 1.1x to 1.5x, Bank of Japan rate normalisation reshaping financial sector returns, and AI supply chain diversification demand pulling capital into Tokyo, are the same pillars institutional flow data has been confirming across nine consecutive weeks of inflows.
Japan is the only non-U.S. developed market with a clearly persistent, thesis-driven inflow pattern in current flow data.
Europe: stabilisation is not the same as a bid
After two consecutive weeks of outflows, Europe returned to positive territory with +$55 million for the week. In absolute terms, it is a rounding line next to Japan’s $2.6 billion.
The distinction matters. “No longer being sold” is not the same as “being bought.” Sluggish economic growth, energy and geopolitical overhangs, and long-standing structural underweights in global portfolios explain the gap. The worst of the de-risking phase may be over. Strategic conviction has not returned.
The Japan versus Europe comparison gives you a working definition of what institutional thesis adoption looks like in flow data: one produces consecutive-week compounding; the other produces a $55 million rounding line.
What the full flow picture tells you about the dominant investment thesis of this moment
Step back from the individual asset classes and regions, and five characteristics define the current investor posture:
- Risk-on, but not all-in. Equities, credit, and crypto all received inflows. But cash was the largest single destination. Risk appetite exists with a substantial liquidity cushion underneath.
- Concentrated conviction in U.S. equities and tech. Both are running at record annualised paces ($652 billion and $217 billion, respectively). That concentration amplifies crowding risk if either leadership narrative falters.
- EM as a trading vehicle, not a strategic allocation. A strong single week on top of a multi-year-worst annual outflow is the signature of tactical opportunity, not re-embrace.
- Japan as the credible diversification alternative. Nine consecutive weeks of thesis-driven inflows make Japan the clearest non-U.S. developed market story in current data.
- Europe in a neutral transition zone. Moved from “actively de-risked” to “neutral,” but not yet attracting the kind of persistent buying that would signal genuine re-rating.
The cash pile is the single most important variable to watch going forward. If the $53.7 billion weekly money market figure begins rotating into risk assets in subsequent weeks, it signals a deepening of conviction. If it grows further, it signals the parachute is being tightened, not loosened.
The BofA Fund Manager Survey from May 2026 registered institutional cash sell signals simultaneously across three independent indicators, including a net 50% equity overweight, cash levels below the 4.0% threshold, and a Bull and Bear reading of 7.8, forming a late-cycle configuration that gives the current $53.7 billion weekly money market figure additional interpretive weight.
The twin crowding risk data points ($652 billion annualised U.S. equity pace, $217 billion annualised tech pace) and the EM regime-shift question (+$8.6 billion weekly versus -$55 billion annual) remain the open tensions embedded in this picture.
What changes the current flow picture, and what does not
The things this data does not change are straightforward: U.S. equity structural dominance via passive flows, technology’s secular overweight status, and Japan’s thesis-driven momentum. All three would require sustained multi-week deterioration to signal a genuine shift, not a single contrary week.
The variables that would change the story are specific and monitorable:
- Sustained EM annualised flow reversal. The -$55 billion annualised figure needs to show improvement across multiple consecutive weeks to signal a genuine regime shift rather than tactical bouncing.
- Deterioration in U.S. equity inflow pace. A meaningful decline from the $652 billion annualised run rate would indicate the marginal buyer is pulling back.
- A second consecutive tech weekly outflow. One week of -$0.7 billion is noise. Two or more consecutive weeks of outflows against the $217 billion annualised pace would warrant closer examination.
- Cash pile trajectory. The direction of the $53.7 billion weekly money market figure in subsequent weeks is the clearest sentiment indicator in the current data.
Tracking these variables week to week gives you earlier visibility into sentiment shifts than waiting for quarterly macro narratives to confirm what the flow data has already been saying.
This article is for informational purposes only and should not be considered financial advice. Investors should conduct their own research and consult with financial professionals before making investment decisions. Past performance does not guarantee future results.