What a Random ASX Backtest Reveals About Managing Market Risk
4 hrs ago

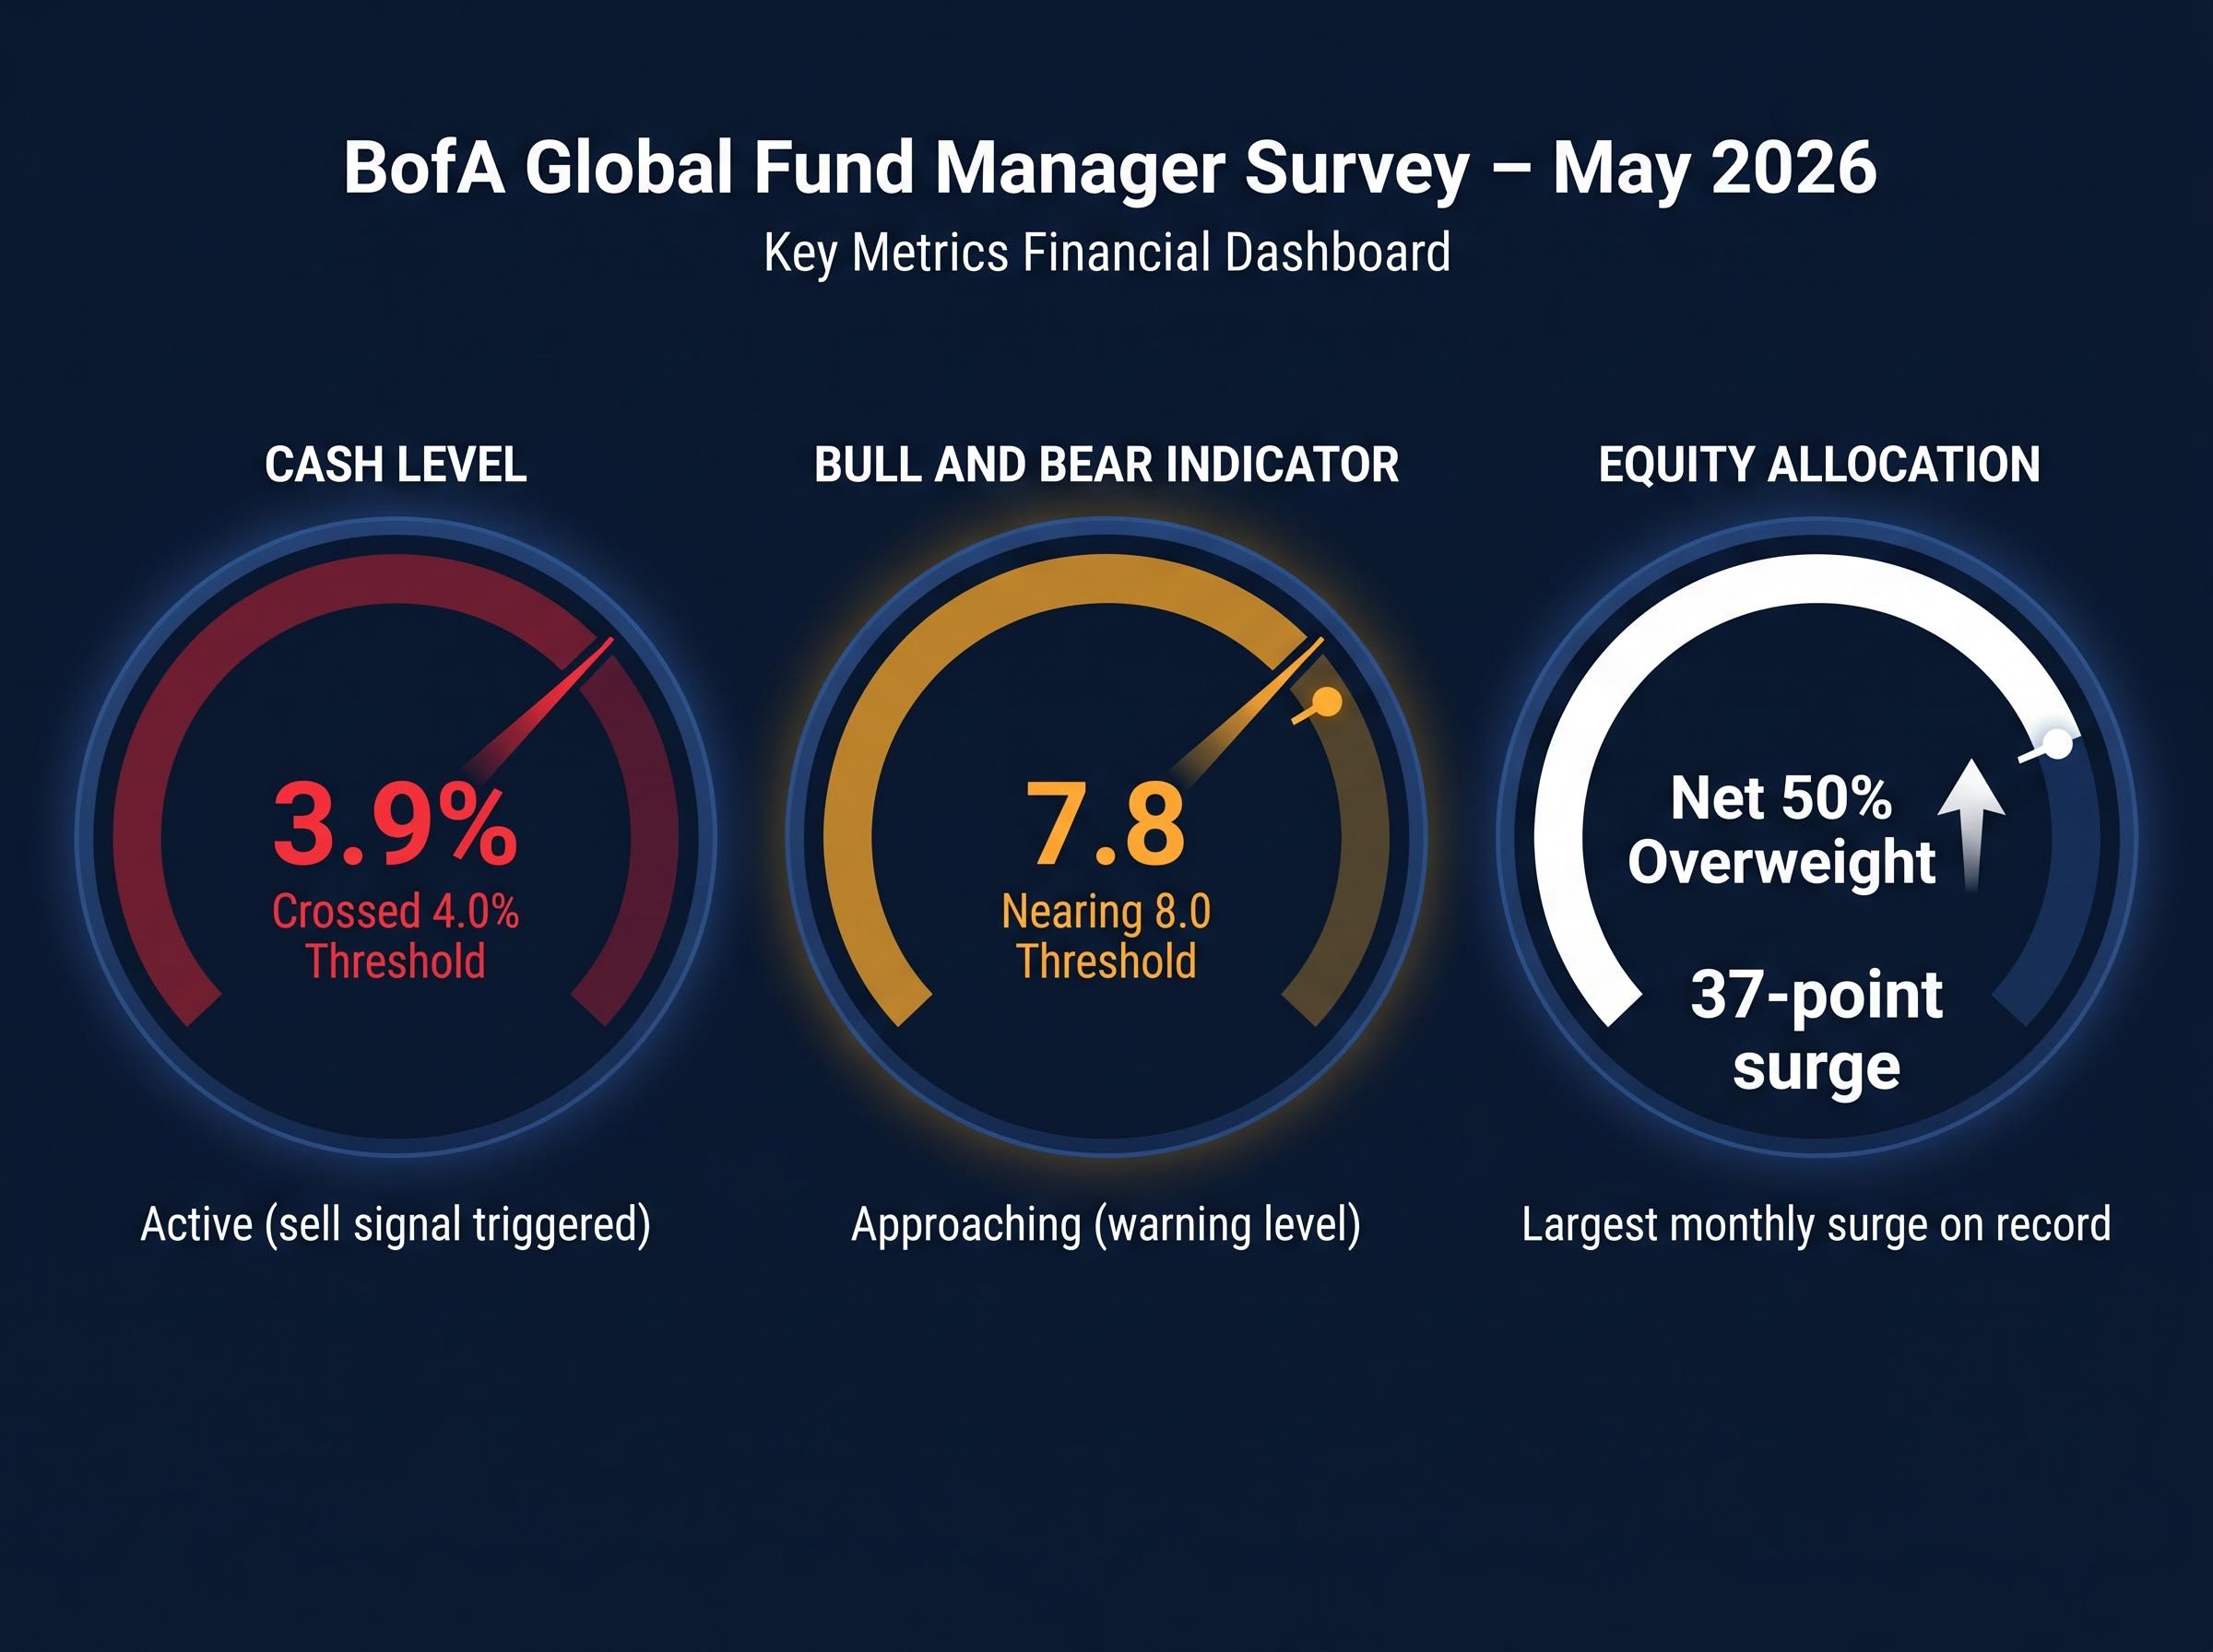
In a single month, institutional investors made the largest equity allocation leap ever recorded in the BofA Global Fund Manager Survey, a 37-percentage-point surge to a net 50% overweight in equities. That is not a sign of quiet conviction. For contrarians, it is a configuration worth examining with precision, because three independent indicators within the same survey are now simultaneously flashing caution against a backdrop of rising Treasury yields, geopolitical pressure on oil markets, and a global equity rally that has pulled institutional cash levels below the threshold BofA uses to flag stretched positioning.
What follows decodes what the survey’s specific readings historically mean for forward returns, identifies where crowding risk is most concentrated, and explains what conditions could turn stretched positioning into a disorderly unwind.
It is rare for a single survey release to produce one confirmed sell signal, a second approaching its trigger, and a record allocation extreme all at once. The May 2026 BofA Global Fund Manager Survey has done exactly that, and the convergence carries more analytical weight than any individual reading in isolation.
| Indicator | Current reading | Signal threshold | Status |
|---|---|---|---|
| Cash level | 3.9% | 4.0% | Active (sell signal triggered) |
| Bull and Bear Indicator | 7.8 | 8.0 | Approaching (warning level) |
| Equity allocation | Net 50% overweight | N/A (record reading) | Largest monthly surge on record |
The speed of the equity allocation move is as significant as its magnitude. A 37-point single-month jump is not a gradual build in confidence; it is a rush into risk assets that leaves positioning extended before the next catalyst arrives.
The BofA cash sell signal activates when average cash allocations fall to 4.0% or below. The logic is mechanical: when investors have already deployed most available dry powder into risk assets, the marginal buyer pool shrinks. At 3.9%, the May 2026 reading places this signal firmly inside active territory, not merely approaching it.
A reading of 7.8 on the Bull and Bear Indicator is a warning, not a triggered signal. The distinction matters. If the indicator crosses 8.0 in the June survey, both independent BofA signals will be simultaneously active for the first time in this cycle.
Net 66% of respondents expected global consumer price inflation to increase, a backdrop that adds further tension to the positioning picture.
The contrarian logic begins with a simple observation: when institutional allocations to equities reach record levels, the marginal buyer has largely already bought. The pool of capital available to sustain further gains has contracted, and the pool of capital that could sell on a negative surprise has expanded.
Net 50% overweight in equities is the highest reading since January 2022. BofA itself characterised the current configuration as near-complete bullish capitulation, flagging early June as a potential profit-taking window.
Financial commentators at CNBC described the combination of the 37-point allocation jump, cash at 3.9%, and the Bull and Bear Indicator at 7.8 as a late-cycle sentiment extreme, a configuration that tends to appear at or near market tops rather than at the start of durable rallies.
The historical pattern that emerges from prior sentiment extremes is not one of immediate collapse. Prior Bull and Bear Indicator sell signals were followed by a more measured sequence:
The practical insight is not that a reversal is imminent. It is that the risk-reward calculus for adding further equity exposure has shifted materially when positioning is this stretched.
A contrarian indicator measures consensus positioning and becomes a risk signal precisely because it reflects what has already happened to capital allocation, not what is about to happen to fundamentals. The survey tells investors where the money already sits. It does not tell them what earnings will do next quarter.
The mechanism works in three steps:
The 4.0% cash threshold and the 8.0 Bull and Bear level are both constructed from composites of sentiment, positioning, and flow data. Together, they approximate how much room the market has left to absorb a shock.
Net 23% of respondents expected higher short-term interest rates, the highest reading since October 2022. Even the survey’s own respondents are internalising a more hawkish macro environment while simultaneously holding record equity overweights. That contradiction is itself a data point.
The survey does not predict when a reversal happens. It identifies that the cost of being wrong has increased. Investors use these readings to adjust position sizing and hedging exposure, not to move to cash on a fixed date.
Long global semiconductors is the most crowded trade in the May 2026 survey, and the conviction surge that produced the reading is as notable as the level itself.
Semiconductor conviction reached 73% in May 2026, a 49-percentage-point increase month-on-month, making it the largest single-month conviction surge for any trade in the survey’s recent history.
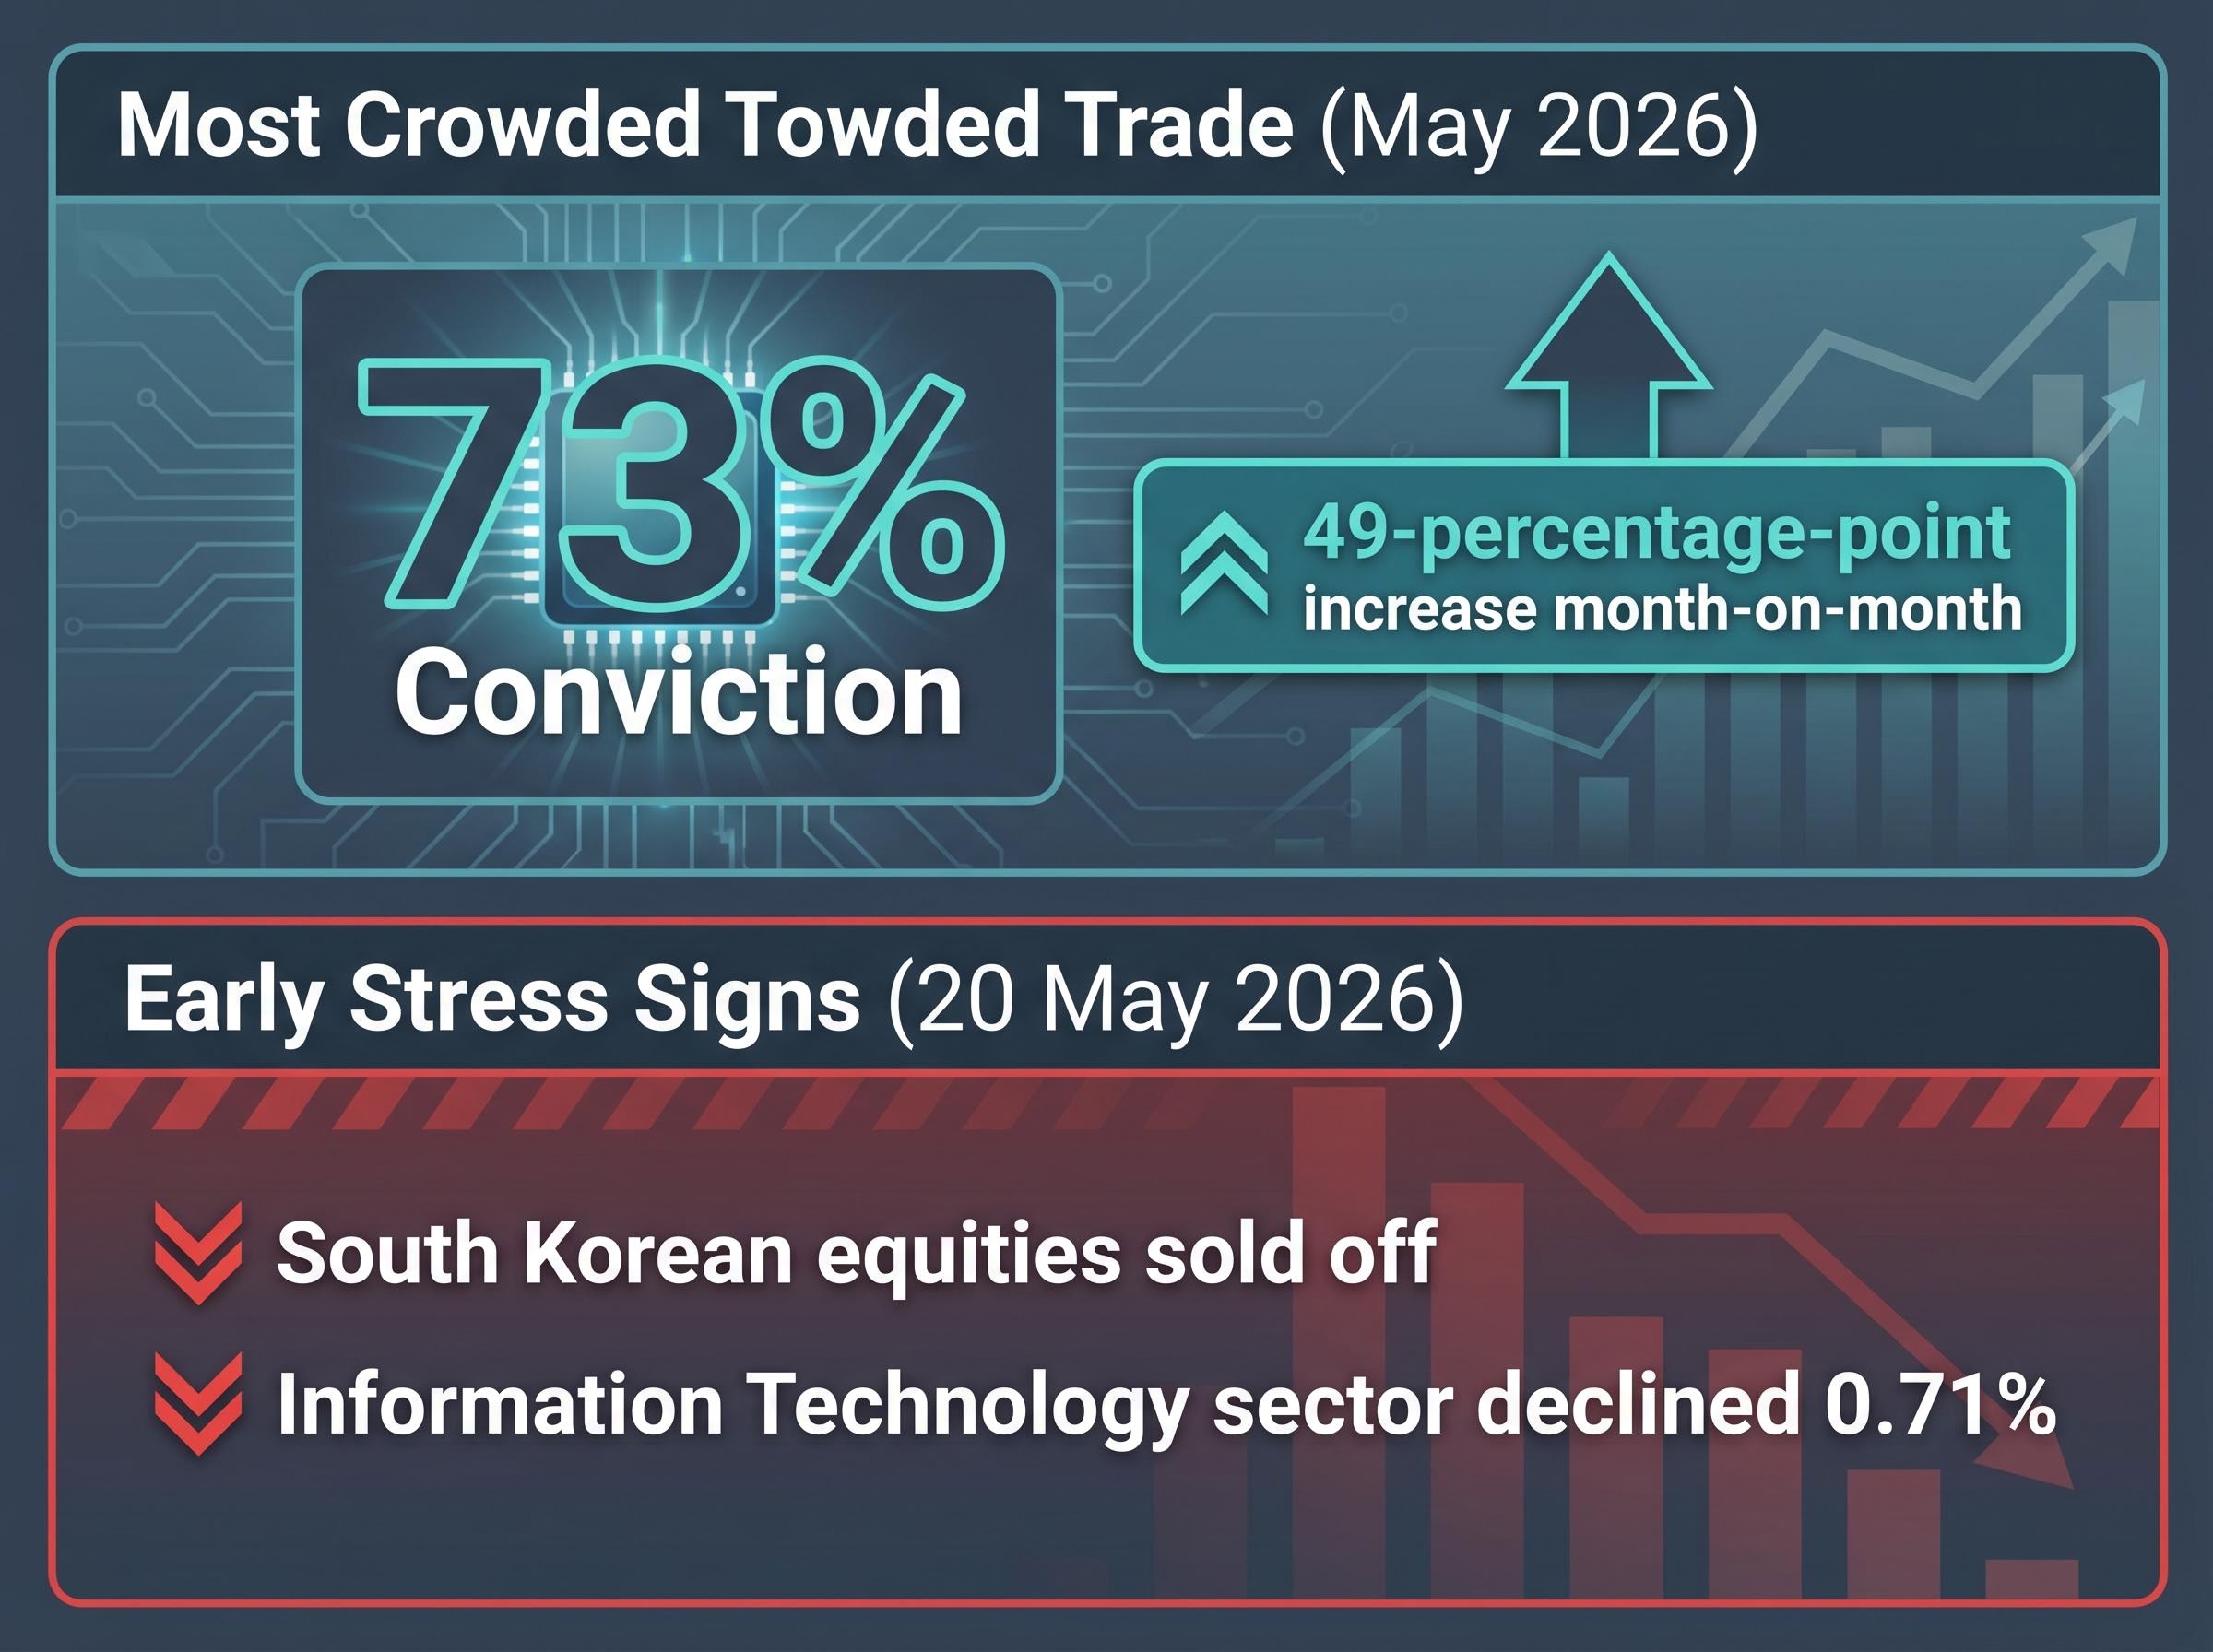
The crowding risk specific to semiconductors is structural. Concentrated institutional ownership means that any sentiment shift or fundamental disappointment triggers simultaneous selling among similarly positioned funds. Bloomberg coverage highlighted that semiconductor ETFs and megacap chip names were seeing crowded ownership, with valuation concerns rising even as AI-driven enthusiasm continued to sustain elevated inflows.
Early evidence of stress was already visible. South Korean equities sold off on 20 May 2026 amid semiconductor sector concerns, and the Information Technology sector declined 0.71% in the same session as broader defensive rotation occurred.
Three conditions would accelerate a semiconductor unwind:
For investors holding semiconductor or AI-adjacent positions, the 73% conviction reading defines where the unwind risk is most concentrated if sentiment shifts.
Stretched positioning is only dangerous if there is a credible catalyst to trigger repositioning. A second inflation wave, transmitted through an energy supply shock, is the specific scenario where the survey’s extremes meet a plausible external trigger.
The transmission chain is direct:
| Stage | Catalyst | Mechanism | Positioning implication |
|---|---|---|---|
| 1 | Strait of Hormuz disruption | Oil supply removed from market | Energy prices spike |
| 2 | Oil price surge | Inflation re-accelerates | Central bank easing delayed |
| 3 | Rates higher for longer | Growth multiples compressed | Equities vulnerable at record overweight |
Goldman Sachs estimated that each additional month the Strait of Hormuz remains closed adds approximately US$10 per barrel to year-end oil prices.
As of 20 May 2026, WTI crude stood at US$104.03 per barrel and Brent at US$110.91 per barrel. Morgan Stanley stated that 2026 inflation risks remain elevated if energy supply shocks intensify, and that central bank easing could be delayed materially under such a scenario.
Net 66% of survey respondents expected global CPI to increase, and market-implied probability of a Fed rate hike by year-end reached 42% as of 20 May 2026. Net 23% expected higher short-term rates. The market is beginning to price this risk while equity allocations remain at record overweight; that contradiction defines the fragility.
The survey’s configuration suggests three categories of contrarian response, none of which requires predicting the timing of a reversal:
The survey’s own respondents illustrate the late-cycle dissonance. Half of respondents anticipated Fed rate reductions within 12 months, yet net 23% expected higher short-term rates, the highest since October 2022. BofA flagged early June as a potential profit-taking window.
Three macro scenarios positioning is least prepared to absorb:
This article is for informational purposes only and should not be considered financial advice. Investors should conduct their own research and consult with financial professionals before making investment decisions. Past performance does not guarantee future results.
Five simultaneous extremes, record equity overweight, an active cash sell signal, the Bull and Bear Indicator at 7.8, semiconductor crowding at 73%, and inflation re-acceleration as the top tail risk, form a coherent late-cycle configuration rather than isolated data points. Each amplifies the others. Depleted cash means less capacity to absorb a shock. Concentrated semiconductor positioning means the unwind, if it comes, will be sharp and self-reinforcing. An energy-driven inflation spike is the catalyst that connects the macro risk to the positioning risk.
The survey does not determine when a reversal happens. It reveals, with unusual clarity, how exposed the market is to being wrong. The question to carry forward is whether the June 2026 survey shows the Bull and Bear Indicator crossing 8.0. If it does, both independent BofA sell signals will be active simultaneously, and the analytical weight of this configuration will be difficult to dismiss.
The BofA Global Fund Manager Survey is a monthly poll of institutional investors that tracks asset allocation, cash levels, and sentiment. Investors watch it as a contrarian tool because extreme readings in equity overweights or cash levels have historically preceded periods of weaker forward returns.
The BofA cash sell signal activates when average cash allocations fall to 4.0% or below, indicating that most available dry powder has already been deployed into risk assets. At 3.9% in May 2026, the signal is firmly active, meaning the marginal buyer pool has shrunk and markets are more vulnerable to any catalyst that triggers repositioning.
The BofA Bull and Bear Indicator is a composite of sentiment, positioning, and flow data that ranges from 0 to 10. A reading above 8.0 is considered a sell signal; the May 2026 reading of 7.8 is a warning level, one move away from confirmation.
Long global semiconductors reached 73% conviction in the May 2026 BofA survey, a 49-percentage-point surge in a single month. Concentrated institutional ownership means any sentiment shift or fundamental disappointment could trigger simultaneous selling among similarly positioned funds, creating asymmetric downside risk.
A second inflation wave driven by an energy supply shock would delay central bank easing, compress growth multiples, and put equities under pressure precisely when institutional allocations are at a record overweight. Goldman Sachs estimated each additional month the Strait of Hormuz remains closed adds approximately US$10 per barrel to year-end oil prices, amplifying this risk.