Why 30% Recession Odds Are Harder to Trade Than 60%
10 hrs ago
Most Australian investors spent the better part of a decade doing the same thing: trimming emerging market exposure and letting US tech compound. The trade worked so well it stopped feeling like a trade and started feeling like common sense. Then the MSCI Emerging Markets Index delivered a 38% return over the 12 months to the end of May 2026, against the S&P 500’s 16%.
That gap is not a rounding error. Morningstar research published today, 3 July 2026, attributes the outperformance not to momentum or luck but to four identifiable structural forces that have been building beneath the surface. The question now is whether those forces hold, and whether your current allocation reflects a genuine view or simply an inherited underweight you have not revisited.
Here is the framework for evaluating those four forces and the three variables that will determine whether they persist.
Start with the raw numbers, because they deserve to land before anything else complicates them.
| Index | 12-Month Return (to end May 2026) | Source |
|---|---|---|
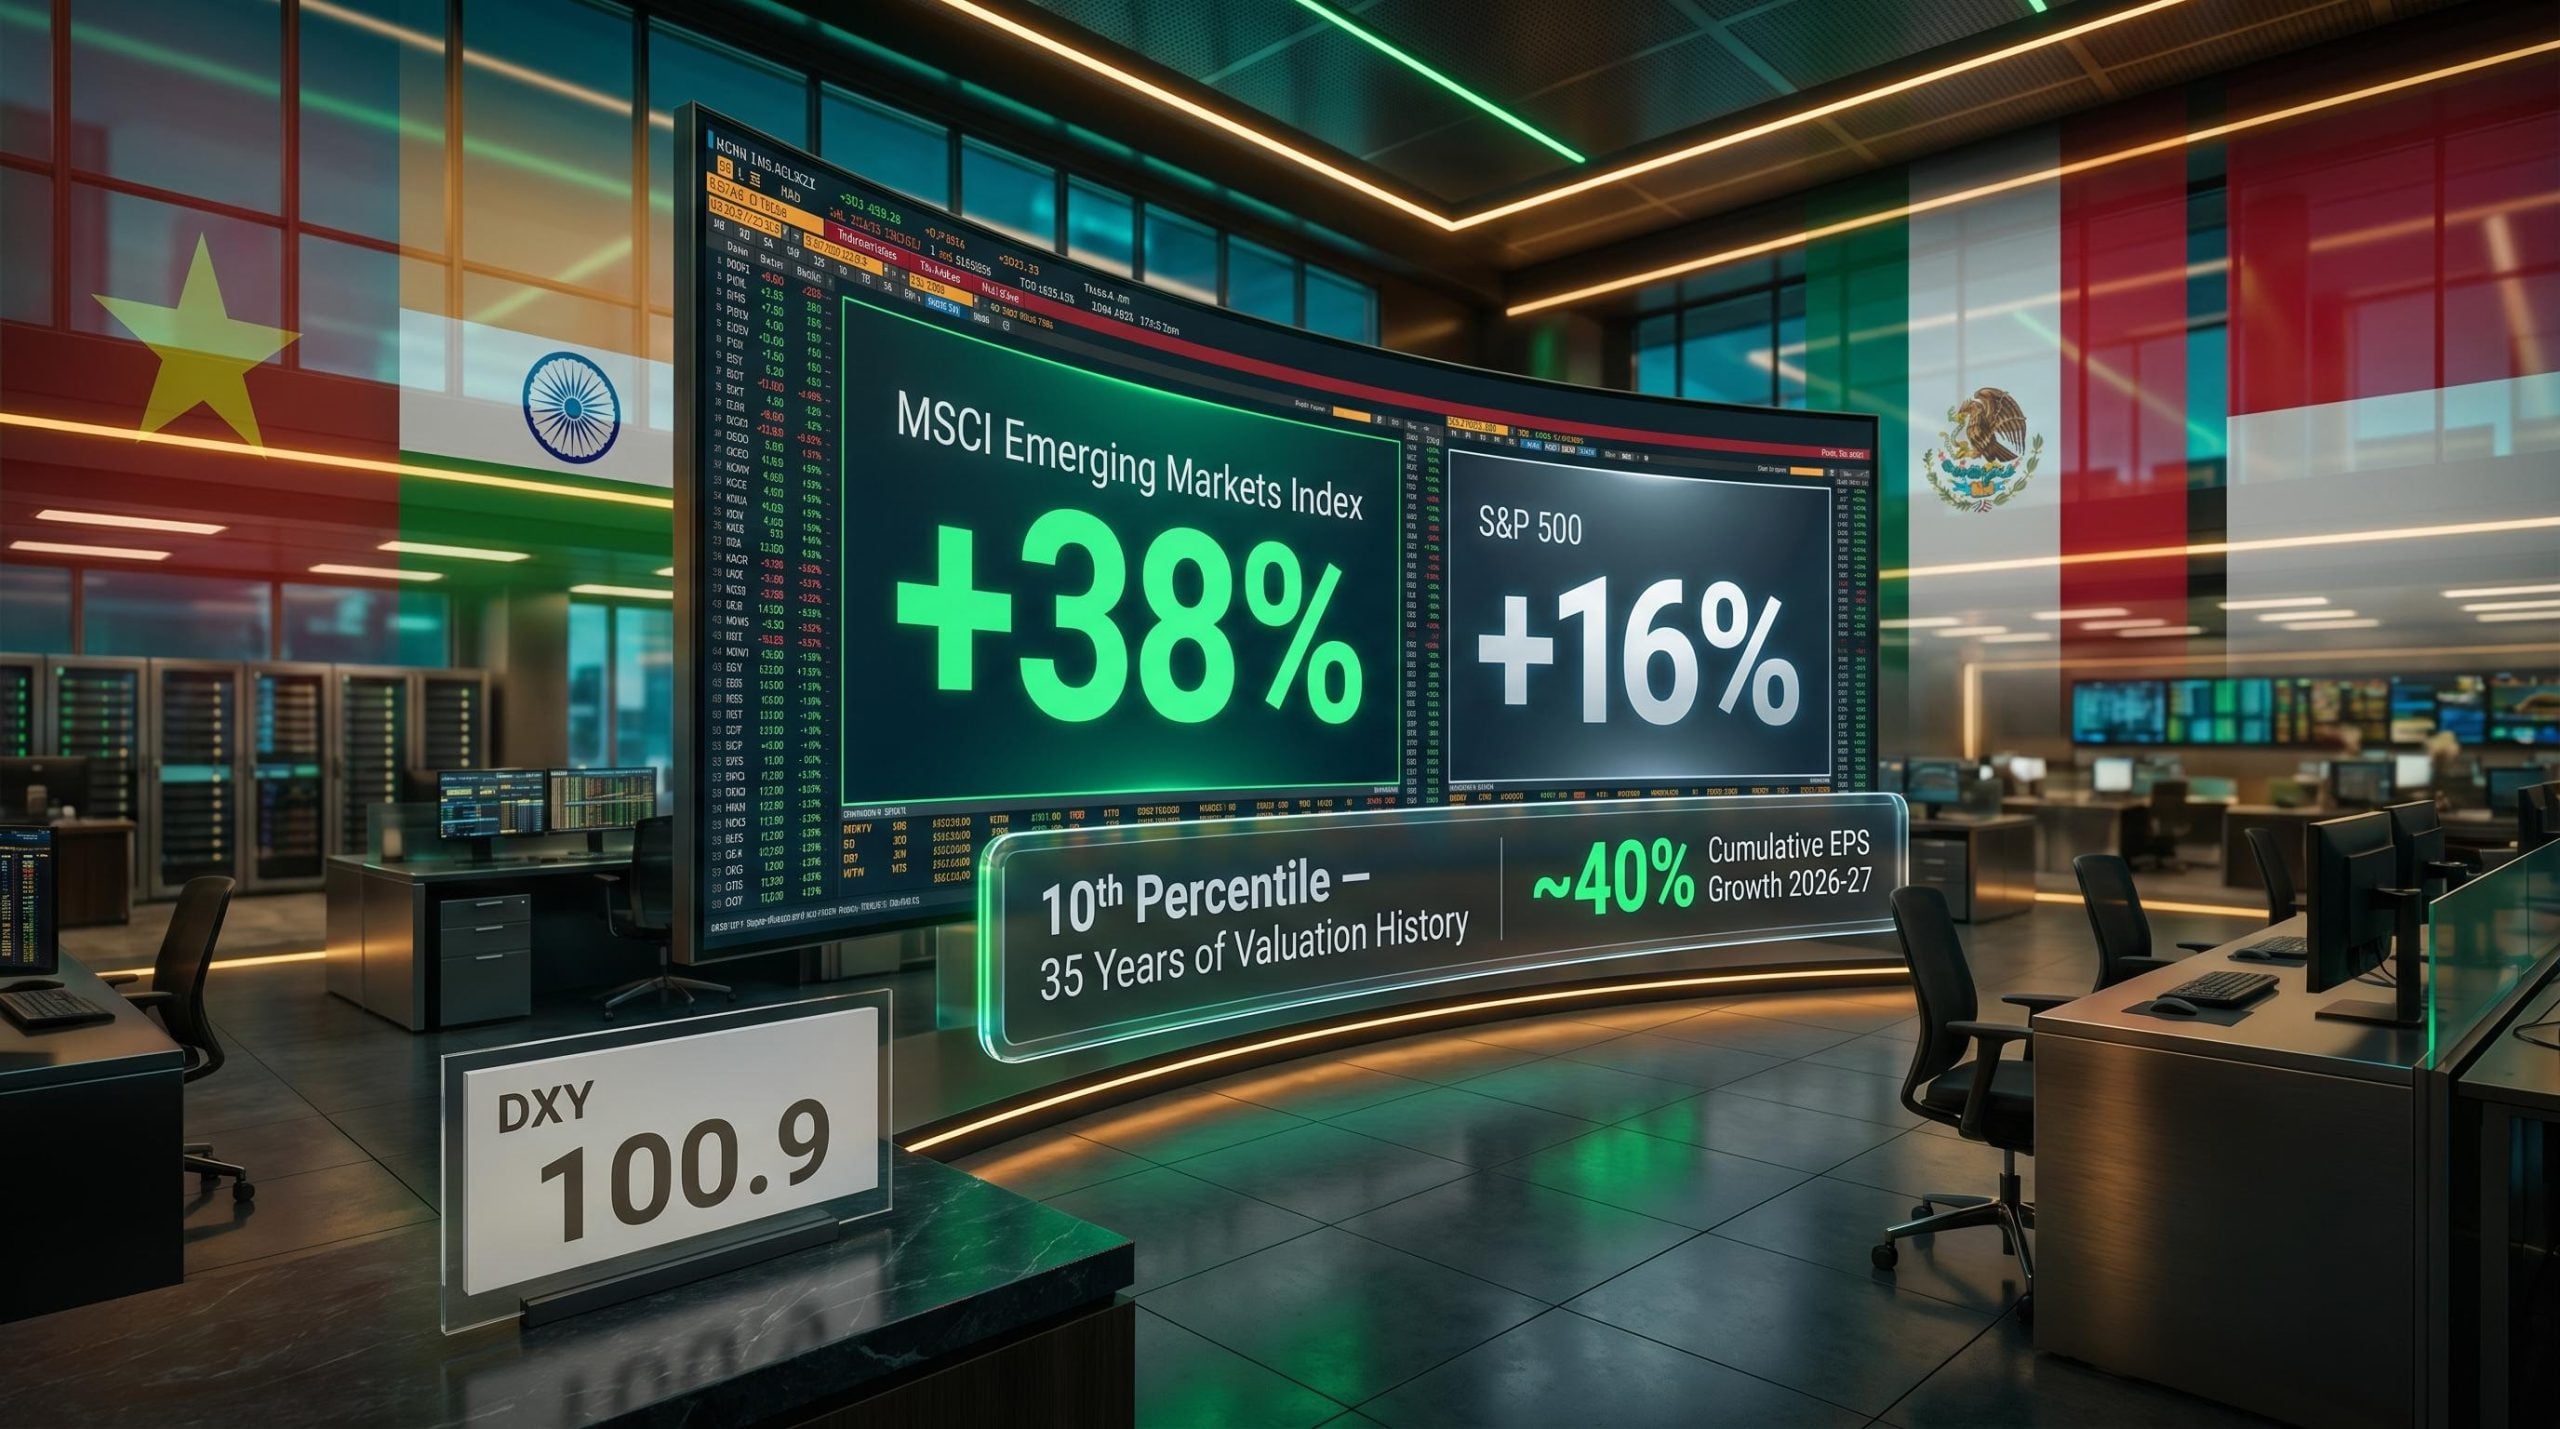
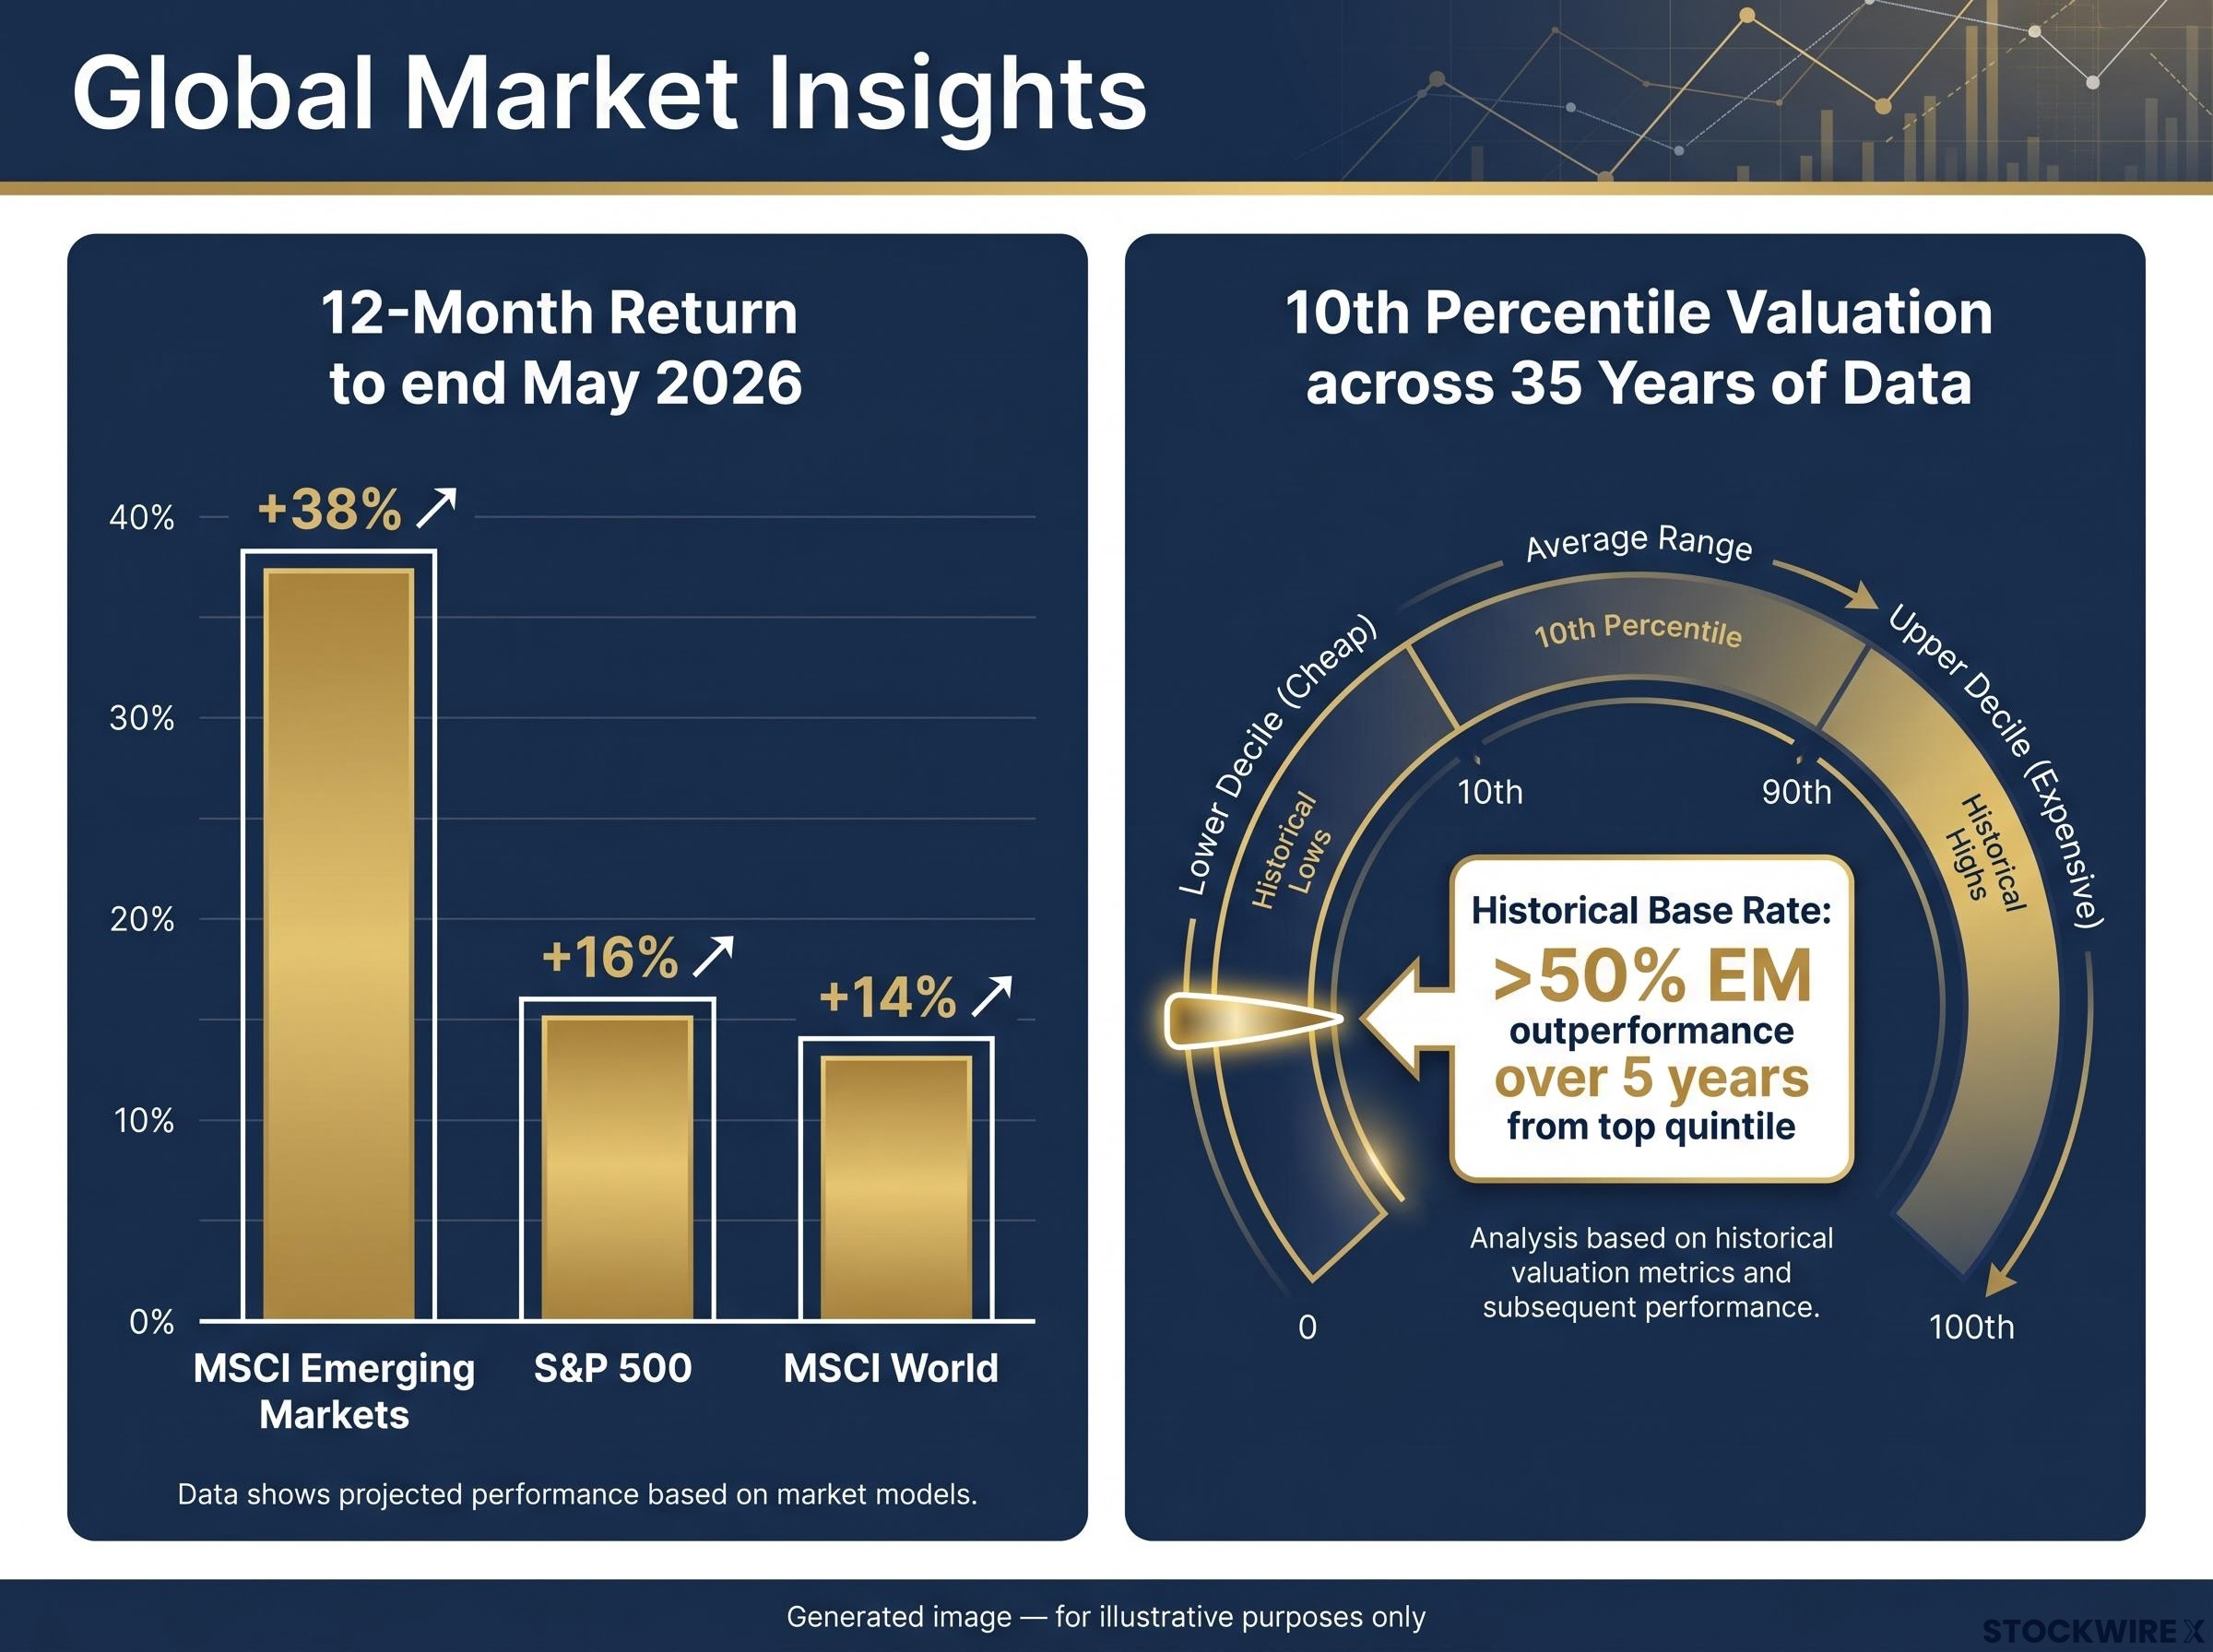
| MSCI Emerging Markets | +38% | Morningstar / Eva Cook, 3 Jul 2026 |
| S&P 500 | +16% | Morningstar / Eva Cook, 3 Jul 2026 |
| MSCI World | +14% | Morningstar / Eva Cook, 3 Jul 2026 |
Separate MSCI index and ETF data through mid-2026 shows the EM return at approximately 39% against the S&P 500’s approximately 23%. The small difference reflects a slightly later measurement endpoint, not a conflicting story. Both data sets point the same way.
The more important distinction is what kind of 38-39% move this is. A gain that size from a depressed starting valuation looks fundamentally different from a bubble forming at the top of a cycle. One is a re-rating; the other is a warning.
According to Morningstar’s research, the 38-39% gain reflects a re-rating from depressed valuation levels rather than late-cycle bubble formation.
That characterisation matters. If you stayed underweight emerging market stocks through this period, the question you face is no longer theoretical. It is a concrete opportunity-cost calculation, and the next four sections determine whether that cost is likely to keep compounding.
The performance data gets attention. The valuation data is what changes allocation decisions.
According to Morningstar research from Eva Cook, Director of Manager Research at Morningstar Australasia, the relative pricing of emerging market equities against US equities has fallen to the 10th percentile across 35 years of recorded observations. Put another way, EM stocks have rarely been this inexpensive compared to their developed-market counterparts in the entire modern data record.
That alone is striking. What makes it actionable is the forward-return pattern.
Looking back across 35 years of data, whenever EM valuations reached the top quintile of cheapness relative to US equities, subsequent five-year returns for EM stocks have on average beaten US equities by more than 50%.
The 10th percentile starting point and the greater than 50% historical outperformance are not a guarantee. They are a base rate, the kind of asymmetric starting point that shapes long-term allocation decisions rather than short-term trades. For an Australian investor deciding how much EM exposure to hold, this data shifts the burden of proof. The historical base rate for strong EM returns from this valuation is high, which means the case for continued underweight needs to be argued on its own terms rather than assumed as a default.
The same dynamic operates across international developed markets: valuation spreads between US Technology and European and Japanese equities are near multi-decade extremes, with MSCI EAFE trading at roughly a 50-55% forward P/E discount to the S&P 500 IT sector, a gap that historical concentration episodes suggest is unlikely to persist at that magnitude.
A caveat deserves direct treatment: cheap can get cheaper. The historical evidence for this valuation signal operates over approximately five-year horizons. Shorter periods carry meaningful timing risk even when starting valuations are supportive.
For Australian superannuation investors and long-term holders, that caveat is less binding than it sounds. A five-year horizon is a realistic one for most super members. The valuation case is more directly actionable for someone with that timeframe than it would be for a trader looking at the next quarter.
Valuation sets the floor. Two macro forces explain why the floor is now rising.
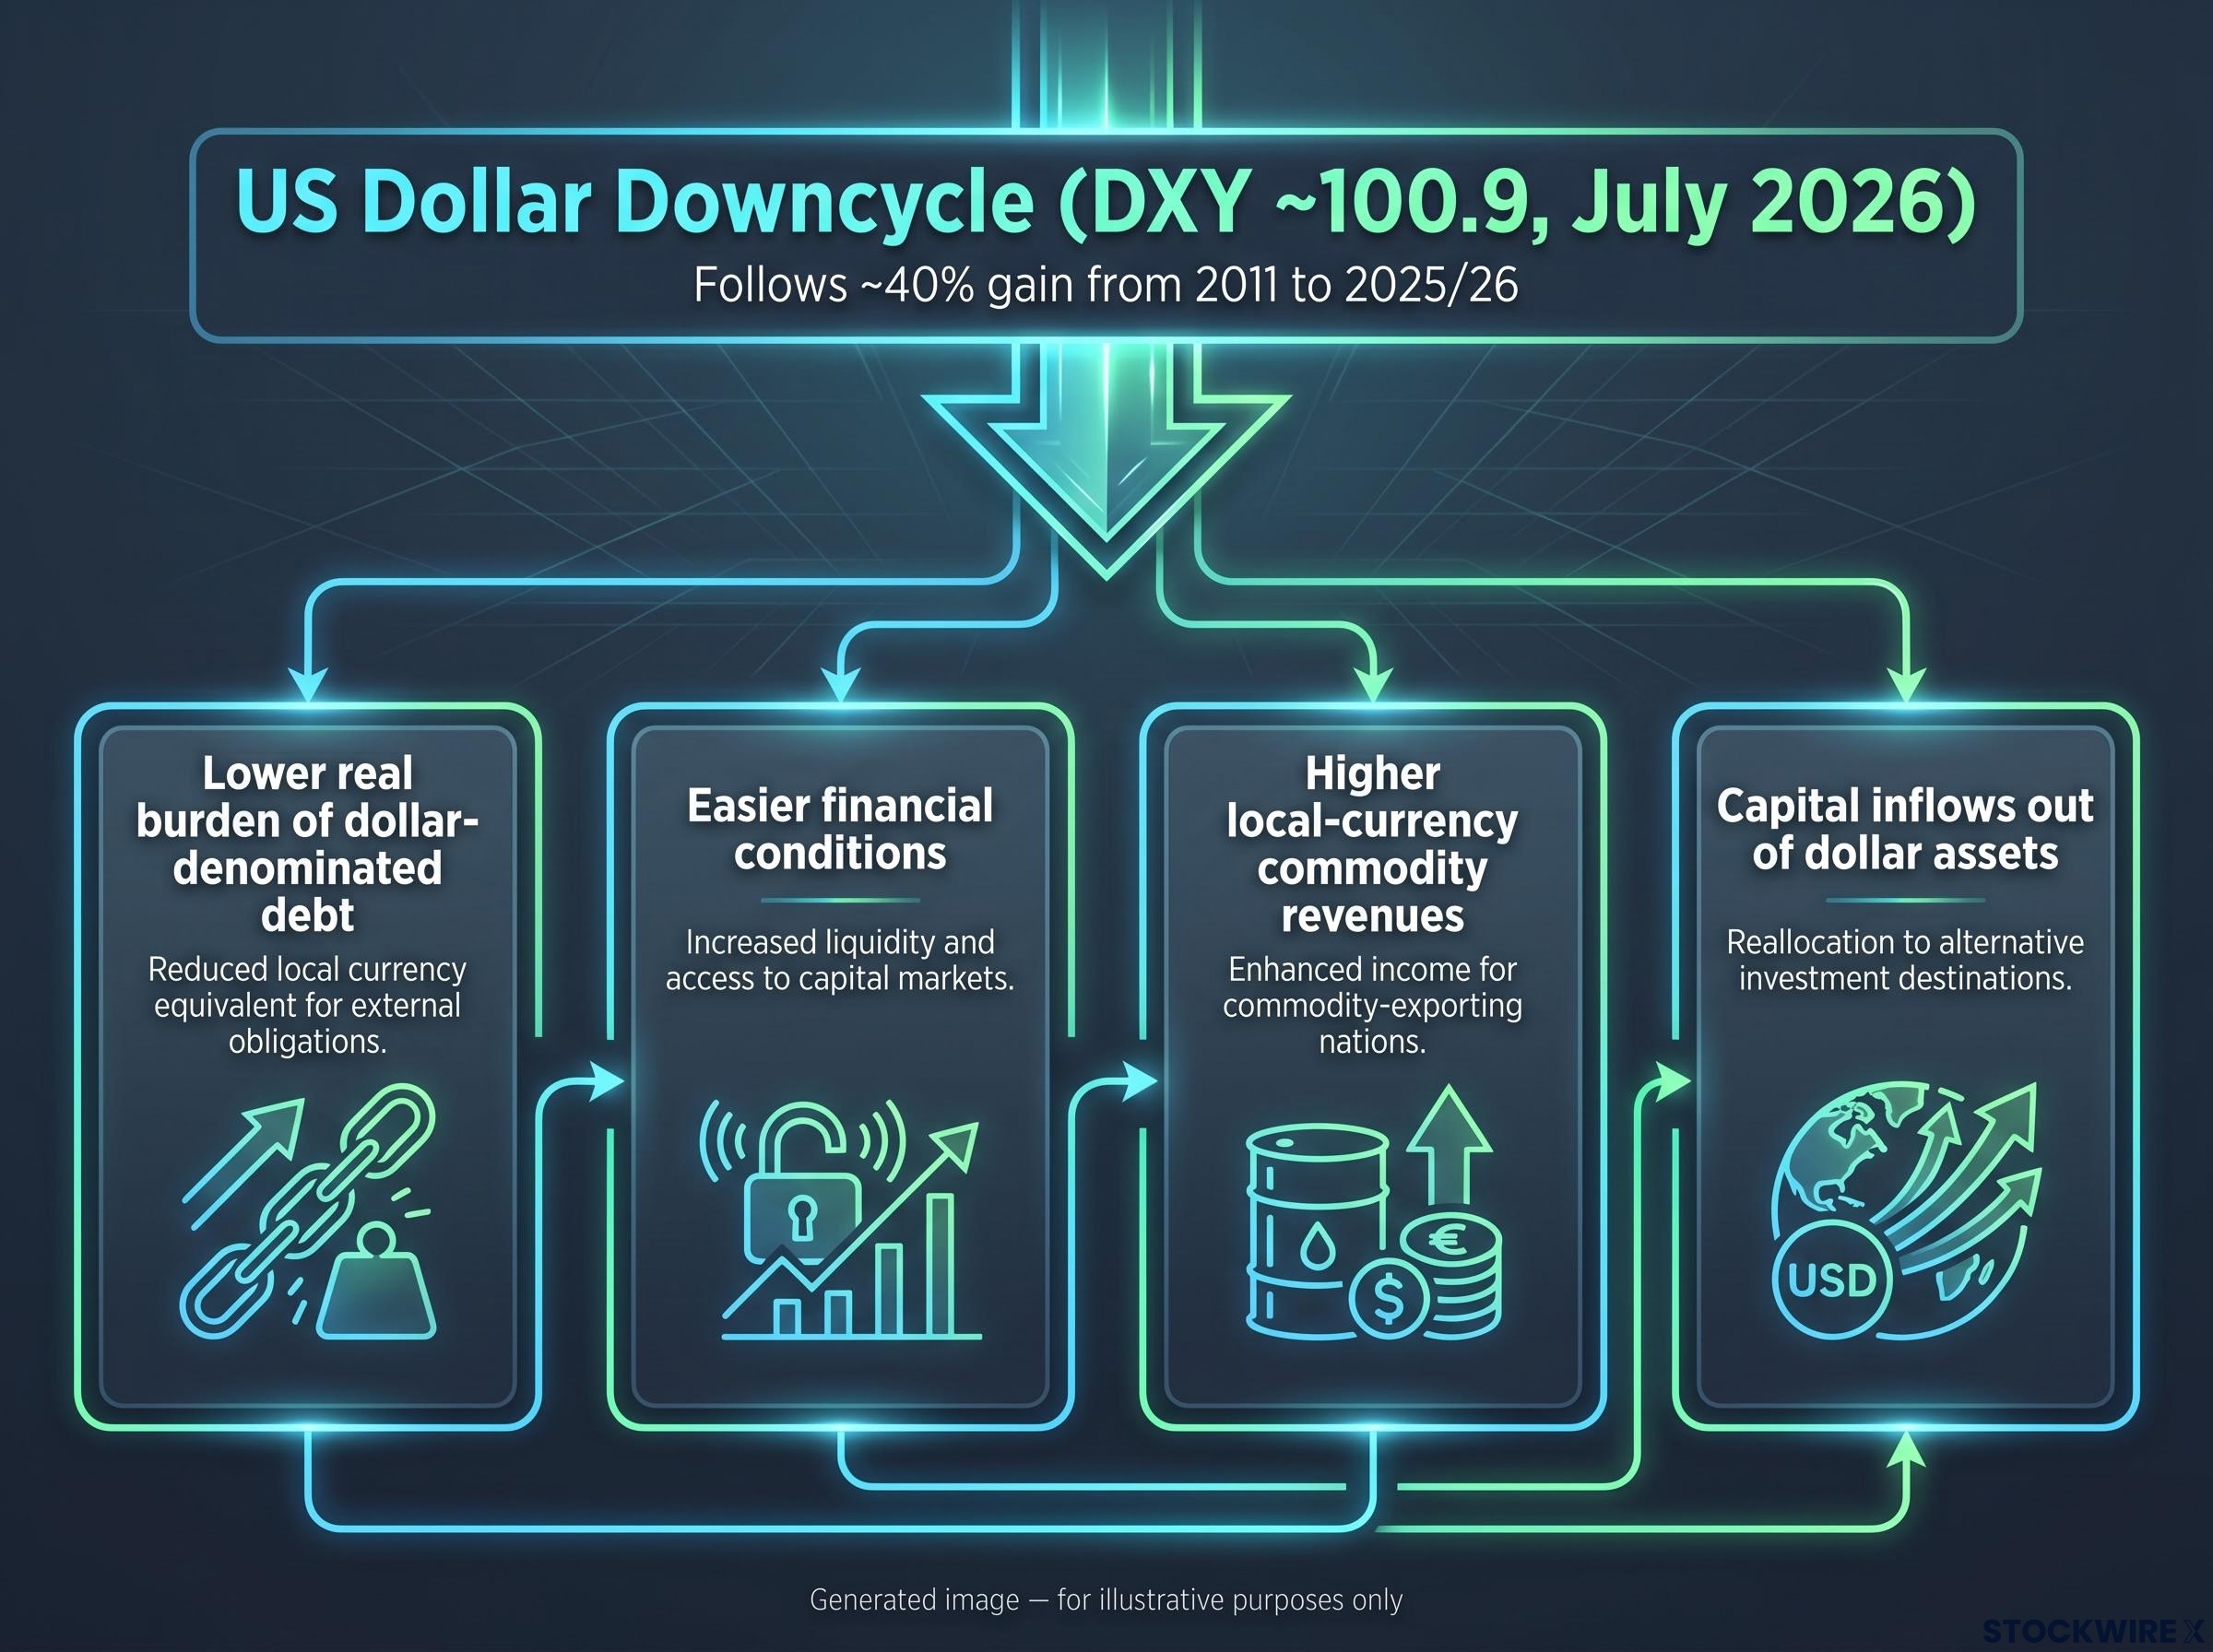
The first is the US dollar cycle. After gaining roughly 40% against a wide basket of currencies across the 15 years from approximately 2011 to 2025/26, the greenback’s long upcycle appears to have run its course. That extended period of dollar strength was a defining feature of the era in which US equities led and EM lagged. Specialist managers referenced in the Morningstar research believe the first confirmed dollar downcycle since the early 2000s is now underway, with the DXY sitting at approximately 100.9 as of early July 2026.
A sustained dollar downcycle benefits emerging market equities through four channels:
These four channels work simultaneously. When the dollar weakens, EM receives a tailwind from multiple directions at once, which is why the dollar cycle is the single most consequential variable in the entire thesis. If it holds, Australian investors holding EM assets receive both the equity return and a currency tailwind. If the dollar reverses sharply, both channels work against them simultaneously.
Non-dollar currency positioning has become a distinct sub-theme within the EM rotation: UBS formally backed five currencies including the Australian dollar and Norwegian krone on 7 June 2026, citing the same structural dollar reversal logic that underpins the EM investment case, while Goldman Sachs issued a notable counterpoint in late May, reversing its own dollar-weakness call on structural AI capital expenditure grounds.
The second tailwind is earnings recovery, and it comes with a structural improvement that previous EM cycles lacked.
Specialist managers cited by Morningstar note that emerging market corporate profits reached a low point in 2023 and have since been on a steady upward path, with cumulative earnings-per-share (EPS) growth of around 40% projected across 2026 and 2027.
Here is why this matters more now than a similar earnings recovery would have a decade ago. During the 2010s, Chinese companies were regularly bringing large volumes of new shares to market. This heavy dilution of the per-share base meant that even solid headline earnings growth failed to flow through to existing shareholders in any meaningful way, severing the connection between economic expansion and actual investment returns.
That issuance overhang has now largely wound down. With the supply of new shares no longer absorbing gains, the approximately 40% cumulative EPS forecast for 2026-27 looks far more likely to be reflected in equity prices than a comparable growth number would have been during the prior cycle. The mechanism linking earnings to share valuations has been restored in a way it was not for much of that earlier period.
When the 2025 tariff shock hit, the initial read for most investors was straightforward: tariffs threaten EM exporters, particularly those dependent on US market access. The thesis looked vulnerable.
The outcome told a different story. Instead of dealing a blow to the EM case, the tariff environment pushed companies to spread their supply chains across a wider range of emerging economies rather than concentrating in China:
The diversification broadened the set of EM economies receiving investment flows, which actually reduced concentration risk relative to a China-heavy EM universe of five years ago. China’s weighting in the MSCI Emerging Markets Index has fallen to approximately 20% as of late May 2026, down from higher levels earlier in the decade.
Geopolitical fragmentation accelerated this supply-chain reorganisation well before the 2025 tariff shock formalised it: five major economies committed hundreds of billions of dollars to semiconductor, EV, and battery industrial policy across 2024-2025, creating structurally distinct regional blocs that are now separately investable rather than interchangeable components of a single global production system.
The MSCI Emerging Markets Index fact sheet confirms the current country composition, including China’s approximate 20% weighting, and the methodology that determines how supply-chain shifts translate into index-level exposure changes over time.
There was a second, less obvious effect. According to Morningstar’s Eva Cook, the imposition of tariffs weighed on investor confidence in US assets broadly, and that shift in sentiment fed directly into the dollar weakness that provides an additional leg to the EM investment case.
The post-tariff backdrop, characterised by a weaker dollar, stronger commodities, and better earnings transmission, marks a sharp departure from the environment that held back EM returns across much of the prior decade.
The tariff shock was supposed to be the headwind. It turned out to be a stress test the thesis largely passed, and a catalyst that accelerated the structural realignment already underway.
A strong structural case still needs a risk framework. These are not disclaimers. They are specific conditions you can monitor.
Latin American and other resource-heavy EM economies carry an additional layer of commodity and cycle risk, making their equity markets sensitive to swings in global commodity prices that sit outside the four-pillar framework.
Each of these risks is a monitoring condition. An investor who has a clear view on the dollar and a realistic picture of China’s current index weight has already addressed the two that matter most.
The issue for most Australian investors is not whether emerging market stocks belong in a long-term portfolio. It is whether their current allocation size reflects the improved risk-reward profile or simply an inherited underweight from the era of US dominance.
Before sizing a position, you need a view on three variables:
On vehicles, a distinction matters. Broad EM index exposure captures the beta but concentrates holdings in a few large technology and consumer names. Active managers may better exploit valuation dispersion across the EM universe, particularly in smaller and frontier markets where the valuation story is most compelling.
Investors ready to act on an EM allocation will find our dedicated guide to ASX emerging market ETFs compares IEM, EMKT, and BEMG across management fees, index methodology, country weights, and year-to-date performance, including which fund’s multifactor screen produced the strongest 2026 returns.
Investors who remain structurally underweight EM now face a tangible opportunity-cost risk if the dollar downcycle and earnings recovery continue as anticipated. The five-year horizon over which the valuation signal is historically most reliable is one that most Australian superannuation members already have.
This article is for informational purposes only and should not be considered financial advice. Investors should conduct their own research and consult with financial professionals before making investment decisions. Past performance does not guarantee future results. Financial projections are subject to market conditions and various risk factors.
All four structural pillars are now pushing in the same direction: EM valuations sitting at the 10th percentile of 35 years of history, an earnings recovery that should flow more cleanly through to per-share returns than it did in previous cycles, the first confirmed dollar downcycle since the early 2000s, and a post-tariff reorganisation of global supply chains that has widened EM’s economic footprint.
For most of the past decade, the default position was US overweight and EM underweight. The current data suggests the default case now runs the other way. The investor who has not revisited that positioning is implicitly betting against all four pillars at once, which is an active choice even if it feels like doing nothing.
The durability of this shift ultimately hinges on three variables: the dollar thesis holding, earnings delivering against the approximately 40% cumulative EPS forecast, and China risk remaining contained at its current index weight. Those are the conditions to watch. They are specific, they are measurable, and they will tell you whether this structural case is playing out or breaking down.
The burden of proof has shifted. The question is whether your allocation has shifted with it.
—
The MSCI Emerging Markets Index tracks large and mid-cap equities across developing economies including China, India, Brazil, Taiwan, South Korea, and others. As of late May 2026, China accounts for approximately 20% of the index, down from higher weightings earlier in the decade.
Morningstar research published 3 July 2026 identifies four structural drivers: EM valuations at their cheapest relative to US equities in 35 years, a recovering earnings cycle with approximately 40% cumulative EPS growth forecast for 2026-2027, the first confirmed US dollar downcycle since the early 2000s, and supply-chain diversification away from China following the 2025 tariff shock.
A weaker dollar benefits EM equities through four channels simultaneously: it reduces the real burden of dollar-denominated debt for EM sovereigns and companies, eases financial conditions, increases local-currency commodity revenues, and drives capital flows out of dollar assets and into EM markets.
The three most consequential risks are a dollar reversal (which would unwind the currency tailwind and tighten EM financial conditions at the same time), China-specific shocks given its approximately 20% index weight, and earnings disappointment against the approximately 40% cumulative EPS forecast for 2026-2027 that the re-rating now depends on.
Morningstar's framework points to three questions an investor needs to answer before sizing up: whether the dollar downcycle is genuine and sustained, whether EM earnings can deliver the approximately 40% cumulative EPS growth forecast for 2026-2027, and whether broad index exposure or active management better suits their view on China risk at roughly 20% of the index.