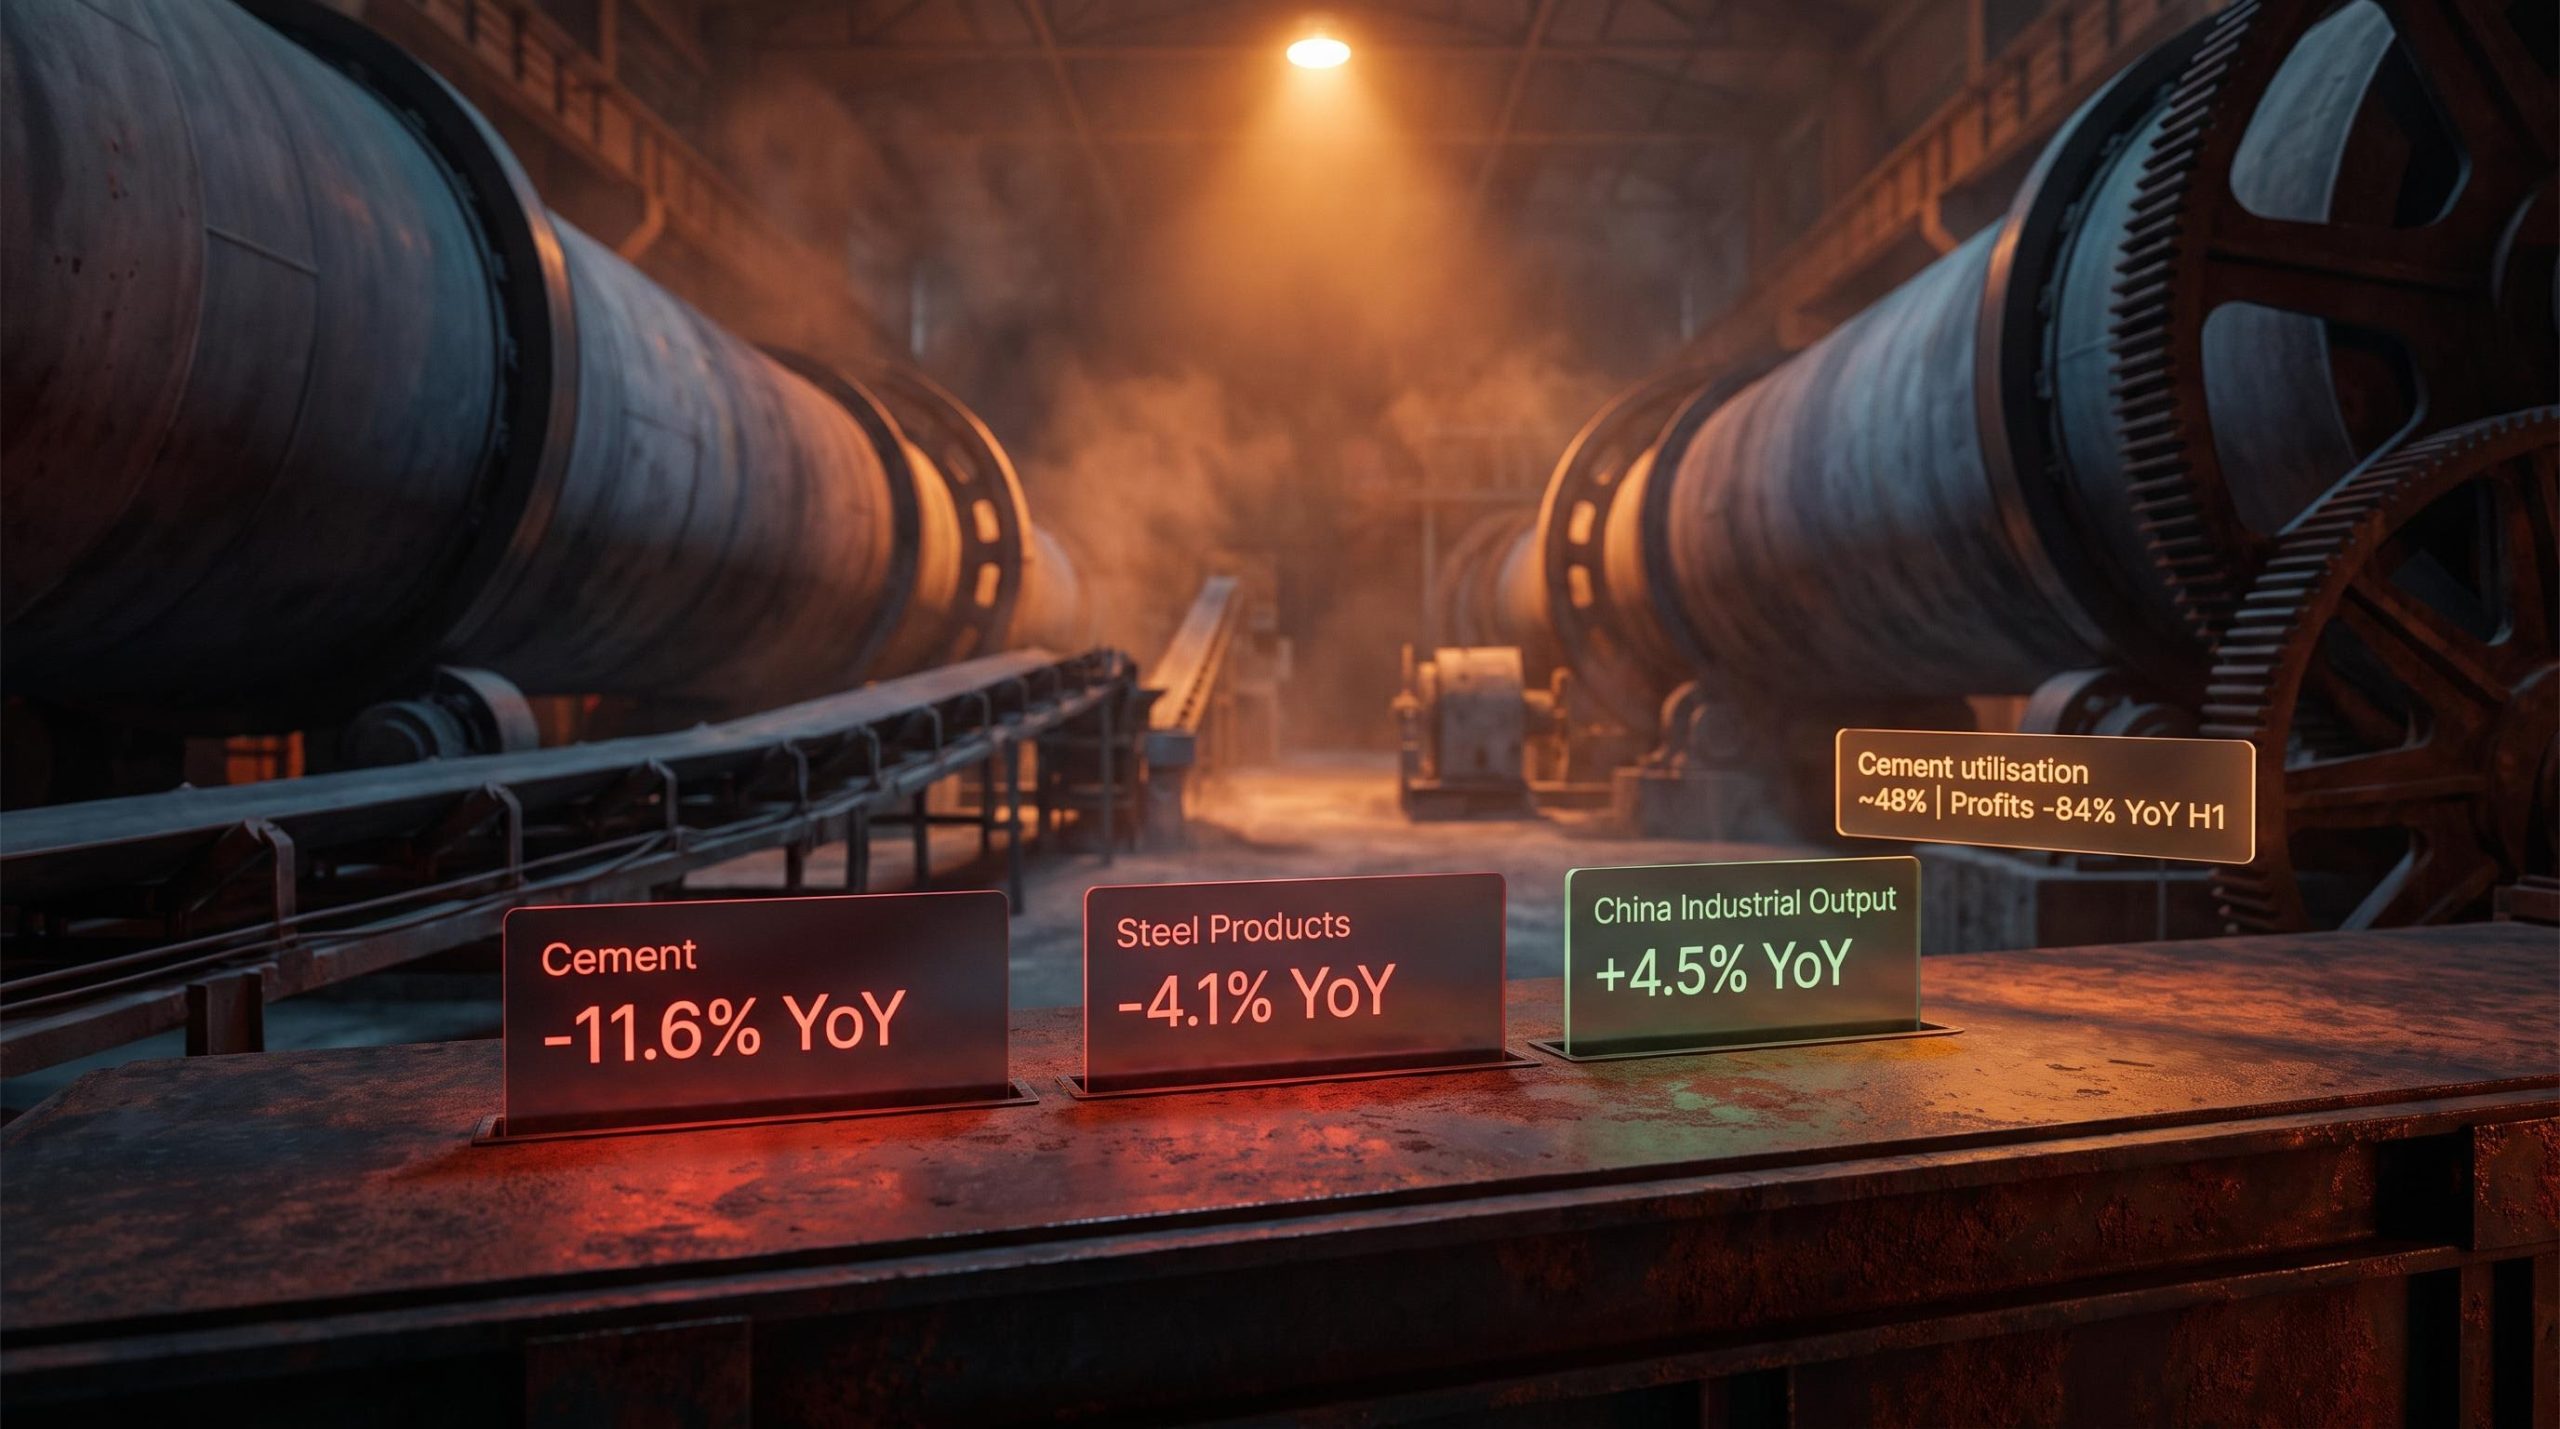
China’s industrial sector expanded at a 4.5% year-over-year rate in July, a headline that appears encouraging until three other figures from the same release come into view: cement output contracted 11.6%, steel products shed 4.1%, and flat glass production dropped 3.6%. These figures are not in conflict. They are measuring two different economies inside the same statistical release.
The gap between the headline and the materials-sector reality is not a one-month anomaly. It is a structural feature of China’s current industrial composition. The property downturn that began compressing residential construction demand years ago has now worked deeply enough into the supply chain that cement, steel, and flat glass are tracking multi-year lows, even as technology-linked manufacturing expands fast enough to keep the aggregate positive. If you are using the headline industrial growth figure to assess China exposure, you are reading a blended average that tells you almost nothing about the part of the economy most exposed to property distress.
Here is the disaggregated lens you need. This piece separates what is structurally recovering from what is still deteriorating, gives you the sector-level evidence, and explains why the most common offset narrative, infrastructure spending, is not doing what many investors assume it does.
Why 4.5% growth is not the number that matters
July’s industrial output reading of +4.5% year-over-year represented a notable step down from the +5.3% recorded in June, falling short of both the market consensus and ING’s forecast of +5.0%. When combined with earlier months, the January to July cumulative settled at +5.3%, a fraction below the +5.4% pace that prevailed through the first six months of the year.
- July: +4.5% year-over-year
- June: +5.3% year-over-year
- H1 cumulative: +5.4% year-over-year
- January-July cumulative: +5.3% year-over-year
- Market and ING forecast: 5.0%
ING’s Lynn Song noted that, relative to other domestic demand indicators, industrial activity showed greater staying power, a point that holds at the aggregate level but requires careful qualification.
Geopolitical risk premiums on China exposure are being shaped not only by the property cycle but by summit-driven market moves that analysts at Fidelity International flag as pricing in comprehensive agreement across trade, AI security, and Iran energy risks, each with materially different probability distributions that investors must separate before positioning.
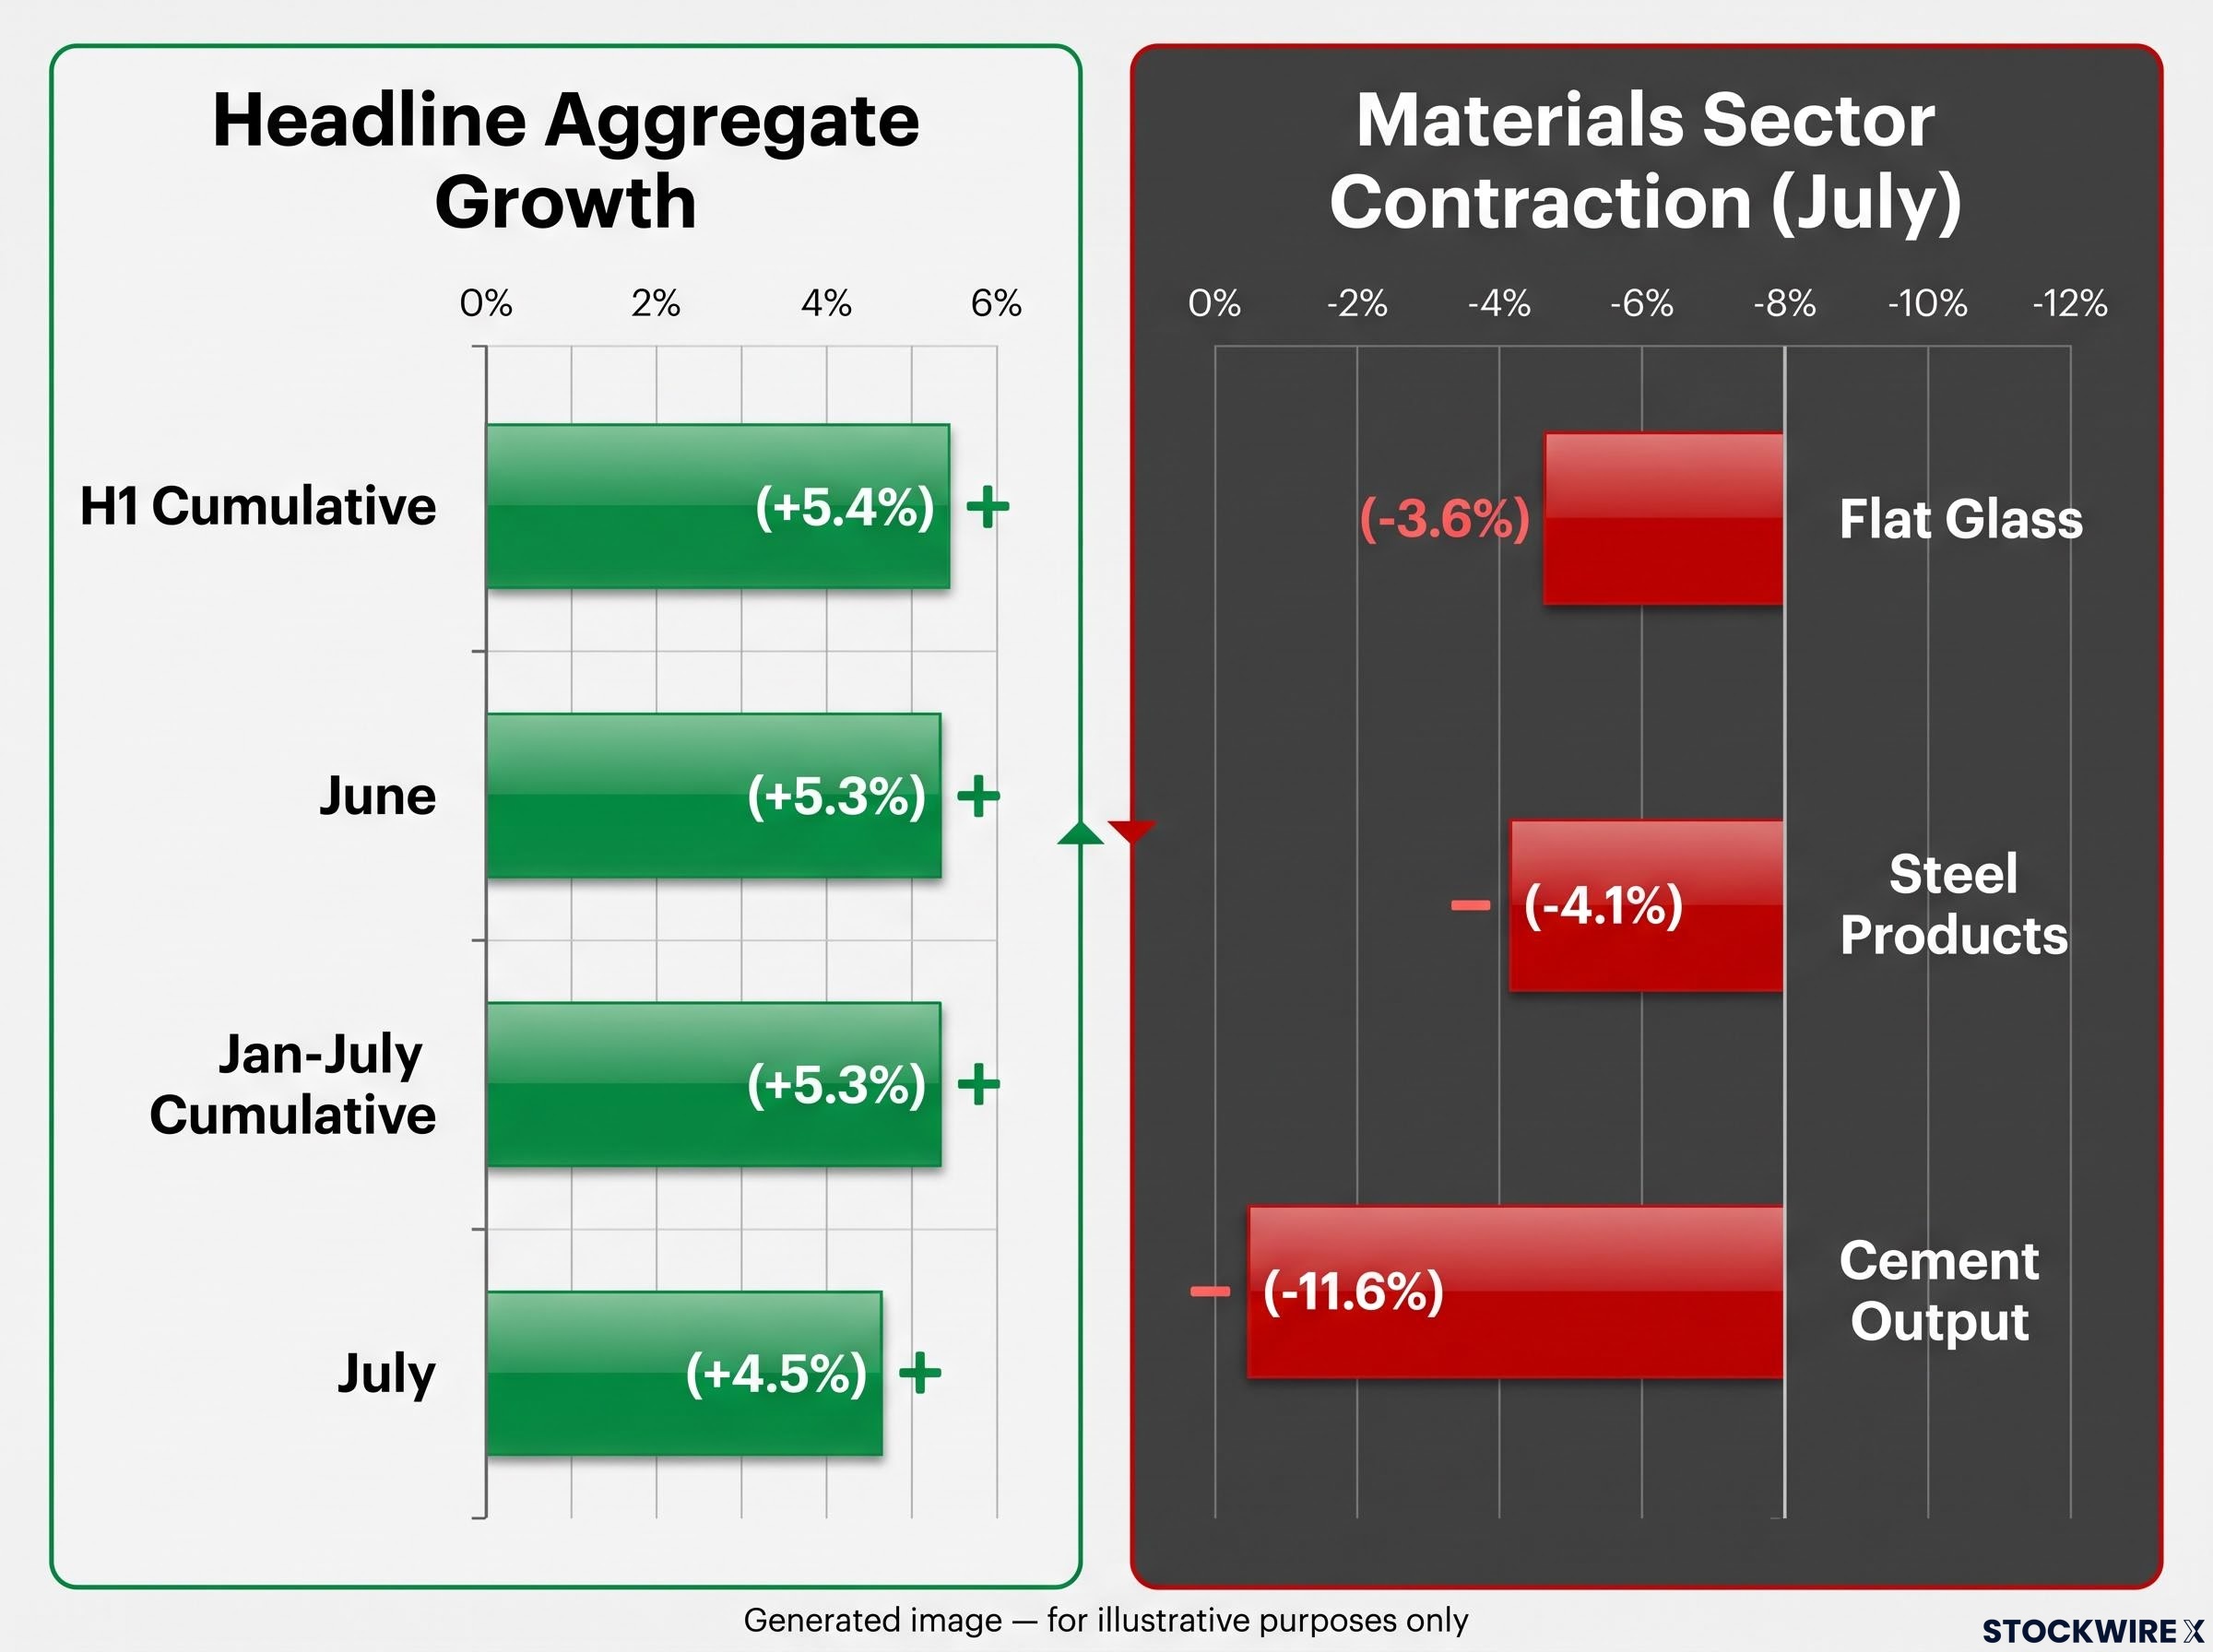
The deceleration and the forecast miss matter less for investors than the structural fact underneath them: the headline aggregates a contracting old economy with an expanding new one. A single number in the 4-5% range can stay positive indefinitely while the sectors most exposed to property distress continue deteriorating. Knowing this changes how to read every subsequent China data release.
When big ASX news breaks, our subscribers know first
What cement, steel, and flat glass are actually telling us
The three sectors most directly tied to China’s property cycle posted their weakest readings of the year in July. Taken individually, each tells a story of deepening stress. Taken together, they form a pattern that the headline industrial figure actively obscures.
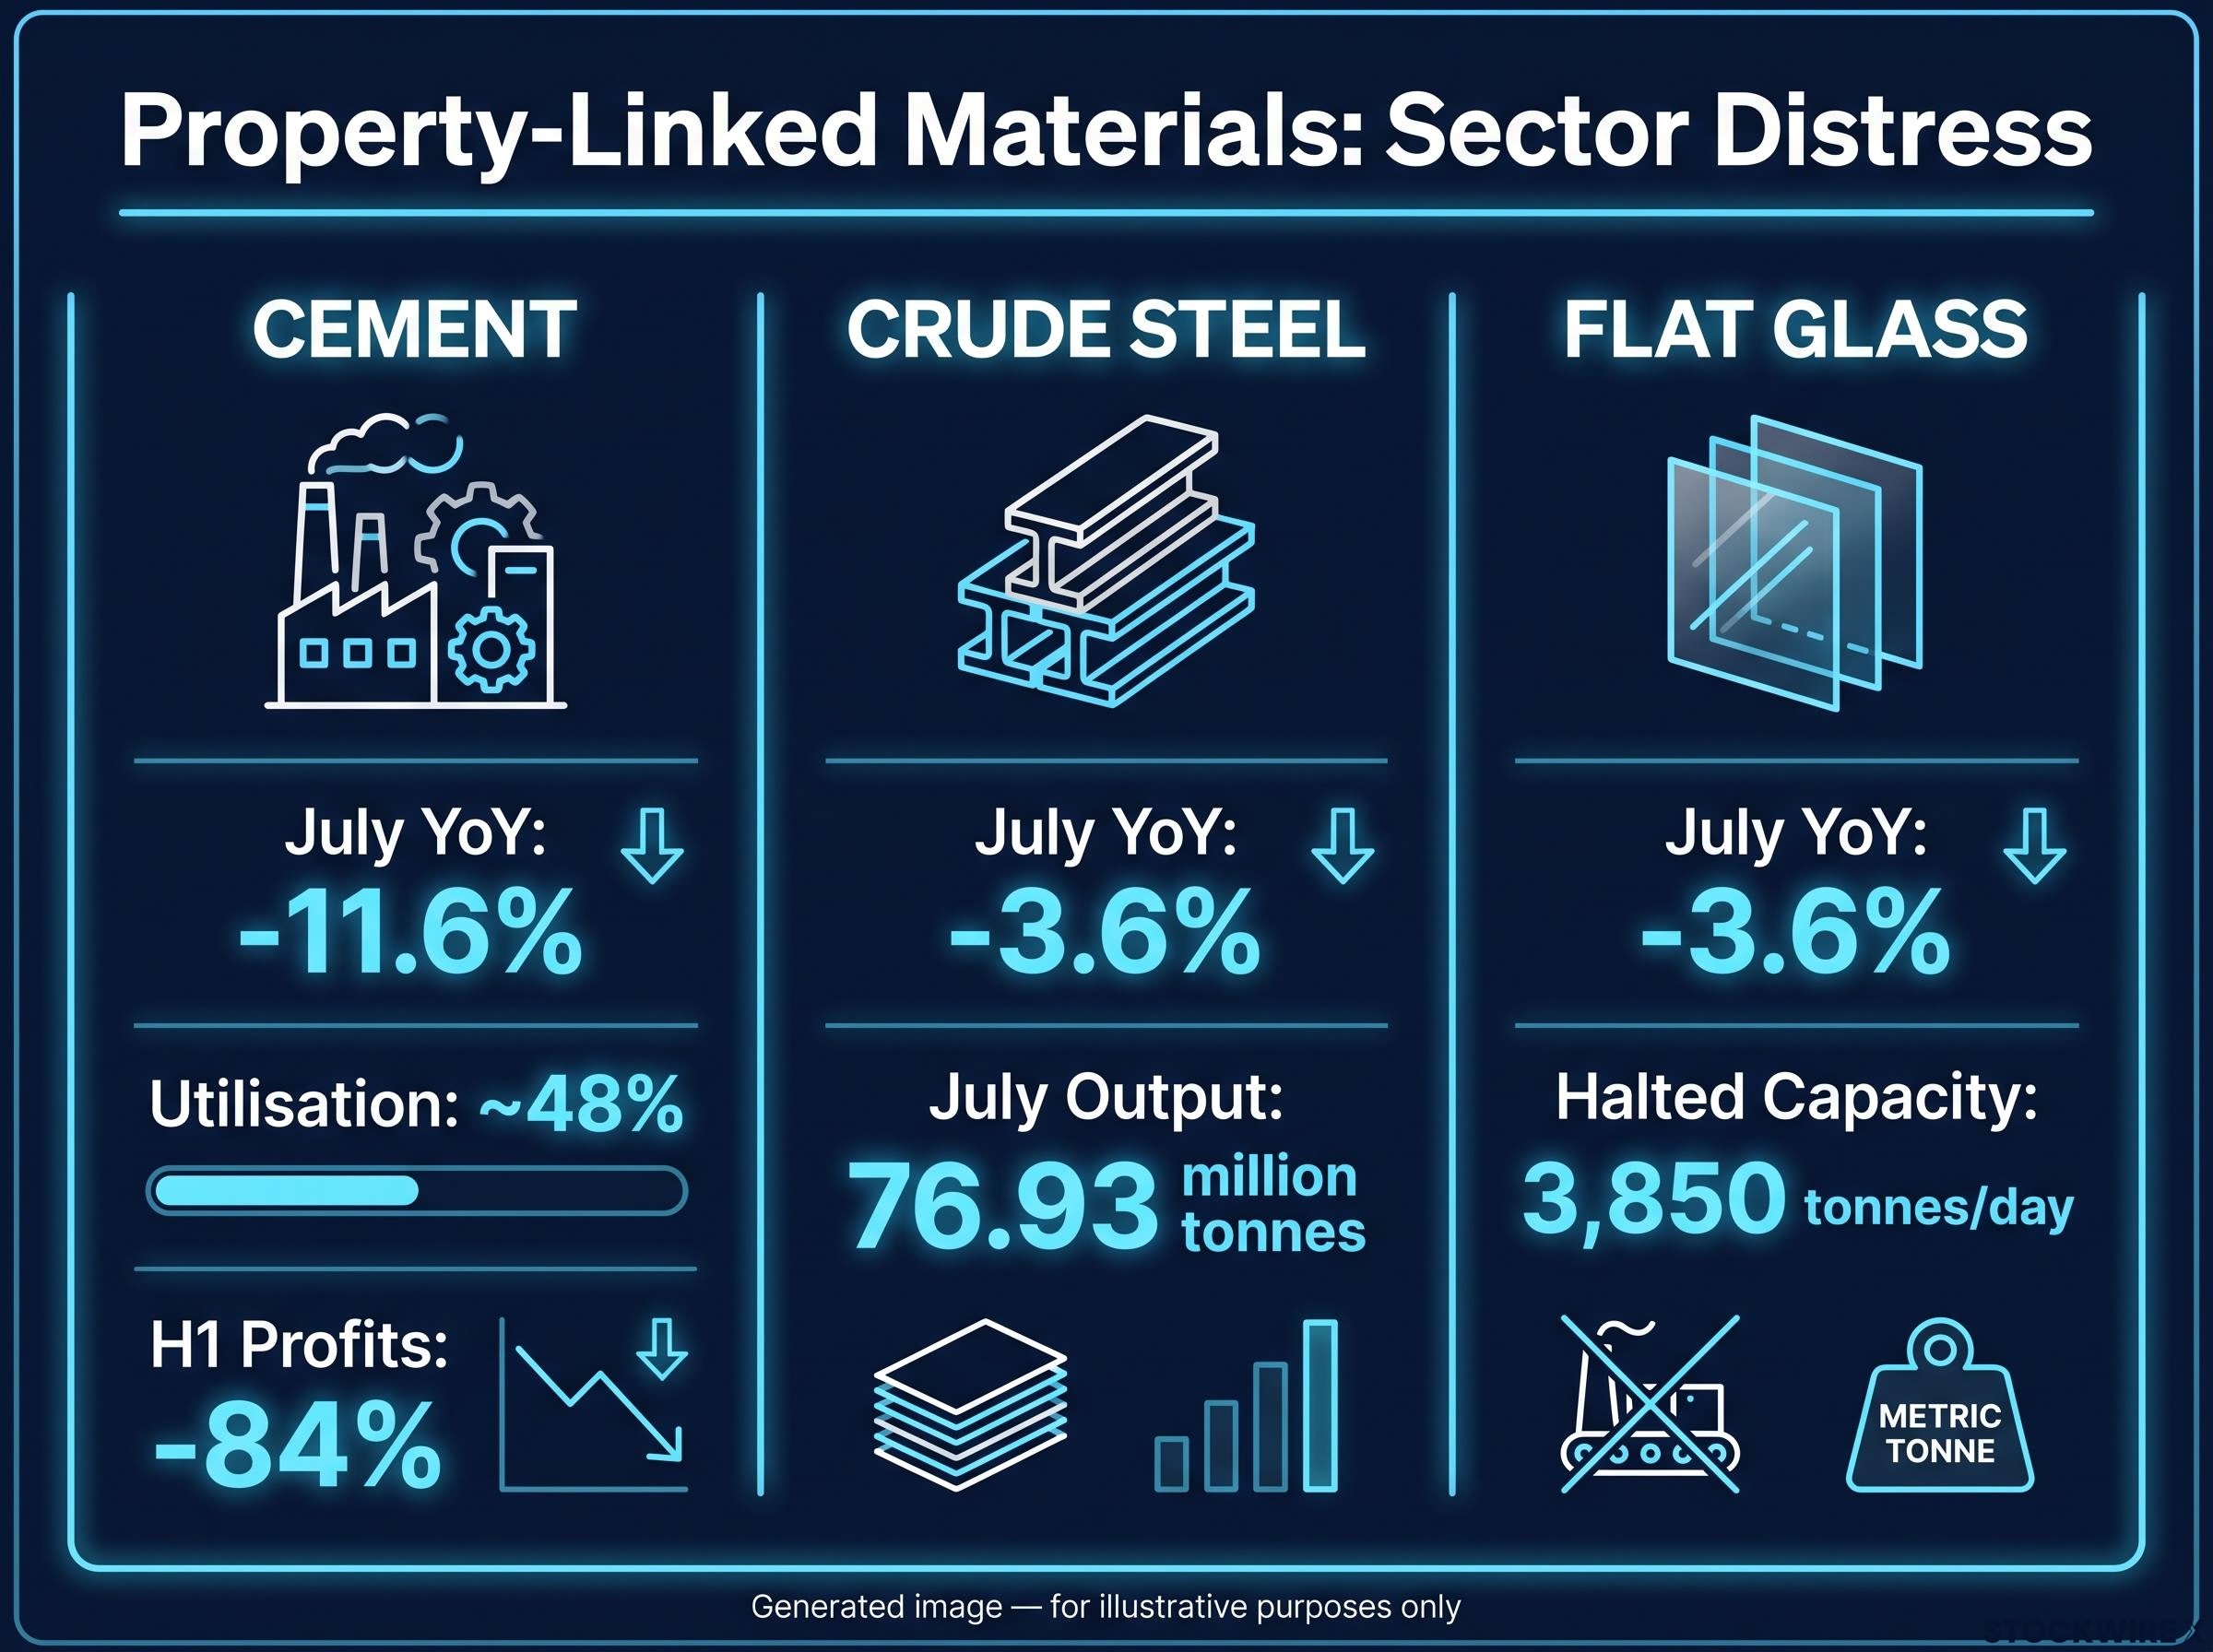
| Sector | July year-over-year change | H1 year-over-year change | Key structural signal |
|---|---|---|---|
| Cement | -11.6% | -8.0% | Utilisation ~48%; profits -84% YoY, sector in overall loss |
| Crude steel | -3.6% | -3.0% | Inventories rising; consumption falling faster than output cuts |
| Flat glass | -3.6% | -5.7% | 3,850 tonnes/day of furnace capacity reduced or halted by mid-July |
Cement: accelerating volume decline and a sector in loss
Cement posted the sharpest deterioration of the three. July output fell 11.6% year-over-year, a significant acceleration from the H1 cumulative decline of 8%, which itself brought total first-half output to 736 million tonnes, the lowest level in over a decade.
The volume decline is severe, but the profitability picture is worse. The industry’s utilisation rate sits at approximately 48%, meaning more than half of installed capacity is idle. Profits collapsed 84% year-over-year in the first half, tipping the sector into an overall loss. Nearly half of China’s cement capacity is running at a loss.
Steel: output cuts insufficient to clear rising inventories
July crude steel output dropped to 76.93 million tonnes, down 3.6% year-over-year, the weakest month of 2026. Steel product output fell 4.1% over the same period. The January to July cumulative reached 577.04 million tonnes, down 3.1% year-over-year, confirming that the slowdown is sustained rather than seasonal.
Mills have been cutting output, but not fast enough. Downstream consumption weakened faster than production, pushing inventories higher and weighing on prices. The steel sector is caught in a gap between supply discipline and demand reality.
Flat glass: volume down and capacity coming offline
Flat glass output declined 3.6% year-over-year in July, following a 5.3% drop in June (when production totalled 76.54 million weight cases) and a 5.7% cumulative decline across H1 (446.83 million weight cases).
What distinguishes flat glass from the other two sectors is the pace of capacity rationalisation. By mid-July, furnaces with a combined daily capacity of 3,850 tonnes had reduced or halted production, and the pace of these shutdowns accelerated compared with June. This is not cyclical softening. Producers are permanently pulling capacity offline.
The combined picture across all three sectors is a sustained, deepening contraction that is now producing structural capacity responses: mills cutting output below demand, furnaces halting, and a cement industry losing money at nearly half its installed capacity. These are high-frequency, publicly reported indicators of property-sector health, and right now they are signalling that the hangover is entrenching, not easing.
The structural split inside China’s industrial economy
The headline industrial output figure is the product of two forces pulling in opposite directions. Understanding the composition explains why the aggregate can remain positive while building-materials sectors deteriorate.
On one side, advanced manufacturing categories aligned with electric vehicles, batteries, solar, and electronics are expanding. These sectors contribute meaningfully to the industrial output index and are growing fast enough to offset contractions elsewhere.
On the other side, the property-linked sectors covered above are shrinking in both volume and profitability. Both feed into the same index. The positive aggregate is an arithmetic outcome, not an economic signal.
The same two-speed decomposition applied to trade data tells a structurally identical story: semiconductor exports surging over 100% year-on-year while domestic consumer spending turned negative for the first time since late 2022, confirming that the divergence is not confined to industrial output but runs across every major economic data series China publishes.
Old economy under pressure:
- Cement at decade-low output, utilisation at ~48%, profits down 84%
- Steel inventories rising as demand falls faster than supply
- Flat glass producers permanently shutting furnaces
New economy expanding:
- EV, battery, and solar manufacturing growing
- Electronics and advanced manufacturing categories contributing to headline growth
- High-tech output large enough to keep the aggregate positive
The infrastructure offset argument does not hold either. Despite ongoing public spending on highways, rail, and utilities, cement and steel output continued to fall through H1 and into July. Public investment has not recreated the demand intensity of the residential housing boom.
Cement and steel output declined through the first half of 2026 and into July despite documented, ongoing infrastructure spending. Public investment is smoothing the cycle at the margin, but it is not reversing the materials-sector contraction.
If your China industrial exposure is concentrated in construction-linked materials, the headline growth number is not just unhelpful. It is actively misleading, because it will stay positive even as your specific exposure deteriorates further.
Why infrastructure spending is not the rescue narrative it appears to be
The assumption that infrastructure spending can substitute for housing demand is the most commonly misread dynamic in China’s current industrial cycle. The output data shows it cannot, at least not at the scale required. Here is why.
- Materials intensity per unit of output differs dramatically. Residential construction historically drove materials demand at a scale that public infrastructure projects cannot replicate. Housing involves millions of dispersed, simultaneous building sites, each consuming cement, steel, and glass in high volumes per unit. A highway project, by contrast, is capital-intensive but uses less bulk material per unit of economic output.
- Geographic concentration limits the demand spread. Infrastructure projects tend to cluster in specific corridors and regions. Residential construction, at its peak, was happening simultaneously in thousands of cities and towns across China, distributing demand nationally. The loss of that geographic spread means materials producers across the country face weaker order books even when infrastructure budgets grow.
- Duration and continuity differ structurally. The housing boom sustained demand continuously over more than a decade. Infrastructure projects are discrete, phased, and subject to approval cycles. They cannot generate the same sustained, multi-year pull on materials supply chains.
The evidence supports this framework directly. Cement utilisation sits at approximately 48% and the sector is in an overall loss despite active infrastructure spend. All three materials sectors posted year-over-year declines during a period of documented public investment. The multi-year adjustment timeline, governed by developer balance sheets, household confidence, local government finances, and demographic headwinds, means a property-sector resolution is the necessary condition for materials recovery. A marginal increase in infrastructure spend is not sufficient.
For investors, this means that government stimulus announcements targeting infrastructure should not automatically be read as a positive catalyst for cement, steel, or flat glass producers unless they are specifically and substantially directed at residential construction.
What the materials data signals for investors assessing China exposure
The analytical framework above points to four practical portfolio implications.
- Differentiate your exposure within “China industrial.” Cement producers, basic steel, and flat glass manufacturers should sit under a separate risk lens from “China industrial” or “China macro” averages. The recovery conditions for these sectors are sector-specific, tied to property resolution, not to aggregate GDP or industrial growth improvements.
- Do not treat infrastructure announcements as automatic catalysts. The continued fall in materials output despite ongoing public investment confirms that infrastructure spend does not recreate the demand intensity of the housing boom. Highways and rail help at the margin but are not sufficient to restore utilisation and margins to prior levels.
The materials sector contrarian thesis argued by Bank of America’s Michael Hartnett rests on four non-correlated demand catalysts, including AI infrastructure spending and a US housing deficit exceeding four million units, but that thesis is geographically specific: it applies to global commodity demand dynamics, not to Chinese building materials producers whose recovery is gated on domestic property resolution.
- Treat property-linked materials as a separate risk cycle. The recovery timeline for these sectors is governed by developer balance sheets, household confidence, local government finances, and demographics. These are structural factors that operate on their own timeline, independent of headline GDP prints.
- Use sector output data as your monitoring framework. Cement, steel, and flat glass output figures are high-frequency, publicly available indicators. They tell you whether the property adjustment is easing or deepening, often before developer-level financial data does. Track them directly rather than relying on aggregate releases.
Cement sector profits fell 84% year-over-year in H1 2026, tipping the industry into an overall loss, with utilisation at approximately 48%. This is the single most striking data point in the current cycle and the clearest signal that the property-linked adjustment has not begun to resolve.
A portfolio that treats “China industrial” as a single risk category is effectively averaging a structurally shrinking old economy with a structurally expanding new one. The aggregate will stay positive long after individual positions in building materials have deteriorated substantially.
Broad China ETF exposure amplifies exactly this problem: IZZ, the ASX’s primary China large-cap ETF, blends technology and property-linked constituents into a single vehicle, meaning the headline return figure masks the same structural divergence that aggregate industrial output data conceals.
This article is for informational purposes only and should not be considered financial advice. Investors should conduct their own research and consult with financial professionals before making investment decisions.
Reading the split economy, not just the summary number
The core argument is straightforward: China’s headline industrial output figure is a weighted average of two structurally divergent economies, and using it as a single-indicator proxy produces systematically wrong conclusions about building materials exposure. 4.5% headline growth in July coexisted with -11.6% cement, -4.1% steel products, and -3.6% flat glass. Both readings are accurate. Only the disaggregated one is useful.
The current data, accelerating cement declines, the weakest steel month of 2026, and flat glass capacity being permanently pulled offline, shows no resolution yet. What would constitute a genuine turning-point signal is specific: a reversal in cement utilisation rates, stabilisation of steel inventories, and a halt to flat glass capacity cuts. Together, those would indicate that the property-linked adjustment is beginning to clear. The data places that inflection some distance away.
The durable habit is the disaggregation itself. Reading China industrial data by structural driver rather than relying on the aggregate will remain applicable across future data cycles, not just this one. The headline number will keep looking resilient. The sectors underneath it will keep telling a different story until the property resolution arrives.
Past performance does not guarantee future results. Financial projections are subject to market conditions and various risk factors.