The Nasdaq Composite fell about 4.5% in the week ending 16 October 2026. Over the same five sessions, the Dow Jones Industrial Average gained 0.7% and the equal-weight S&P 500 edged higher. For anyone relying on a broad index fund for tech selloff diversification, that split is the real story: the index fell, but the average stock did not.
The damage came from two specific places. The first was a financing scare around AI infrastructure lender-dependent firms, led by CoreWeave. The second was a memory-chip shock out of Asia.
Meanwhile, the 10-year Treasury yield spiked, then fell, and gold climbed. That combination tested the usual assumptions about which assets protect a portfolio.
Here is how a borrowing-cost problem in one corner of AI spread into a market-wide tech drawdown. You will also see what the rotation says about building a portfolio that does not depend on a handful of mega-caps.
Why did tech fall so hard while the average stock held up?
Start with the scoreboard. The headline indexes and the typical stock told two different stories.
| Asset | Weekly move | Note |
|---|---|---|
| Nasdaq Composite | About -4.5% | CNN, 16 October |
| S&P 500 | About -2.0% | Some reports put it at -1.9% |
| Dow Jones Industrial Average | +0.7% | MarketWatch/Yahoo Finance |
| Equal-weight S&P 500 | About +0.5% | Second straight weekly gain per Morningstar; exact figure not confirmed |
| US 10-year Treasury yield | Down about 15-16 bps | Ended near 5.07%-5.10% depending on source |
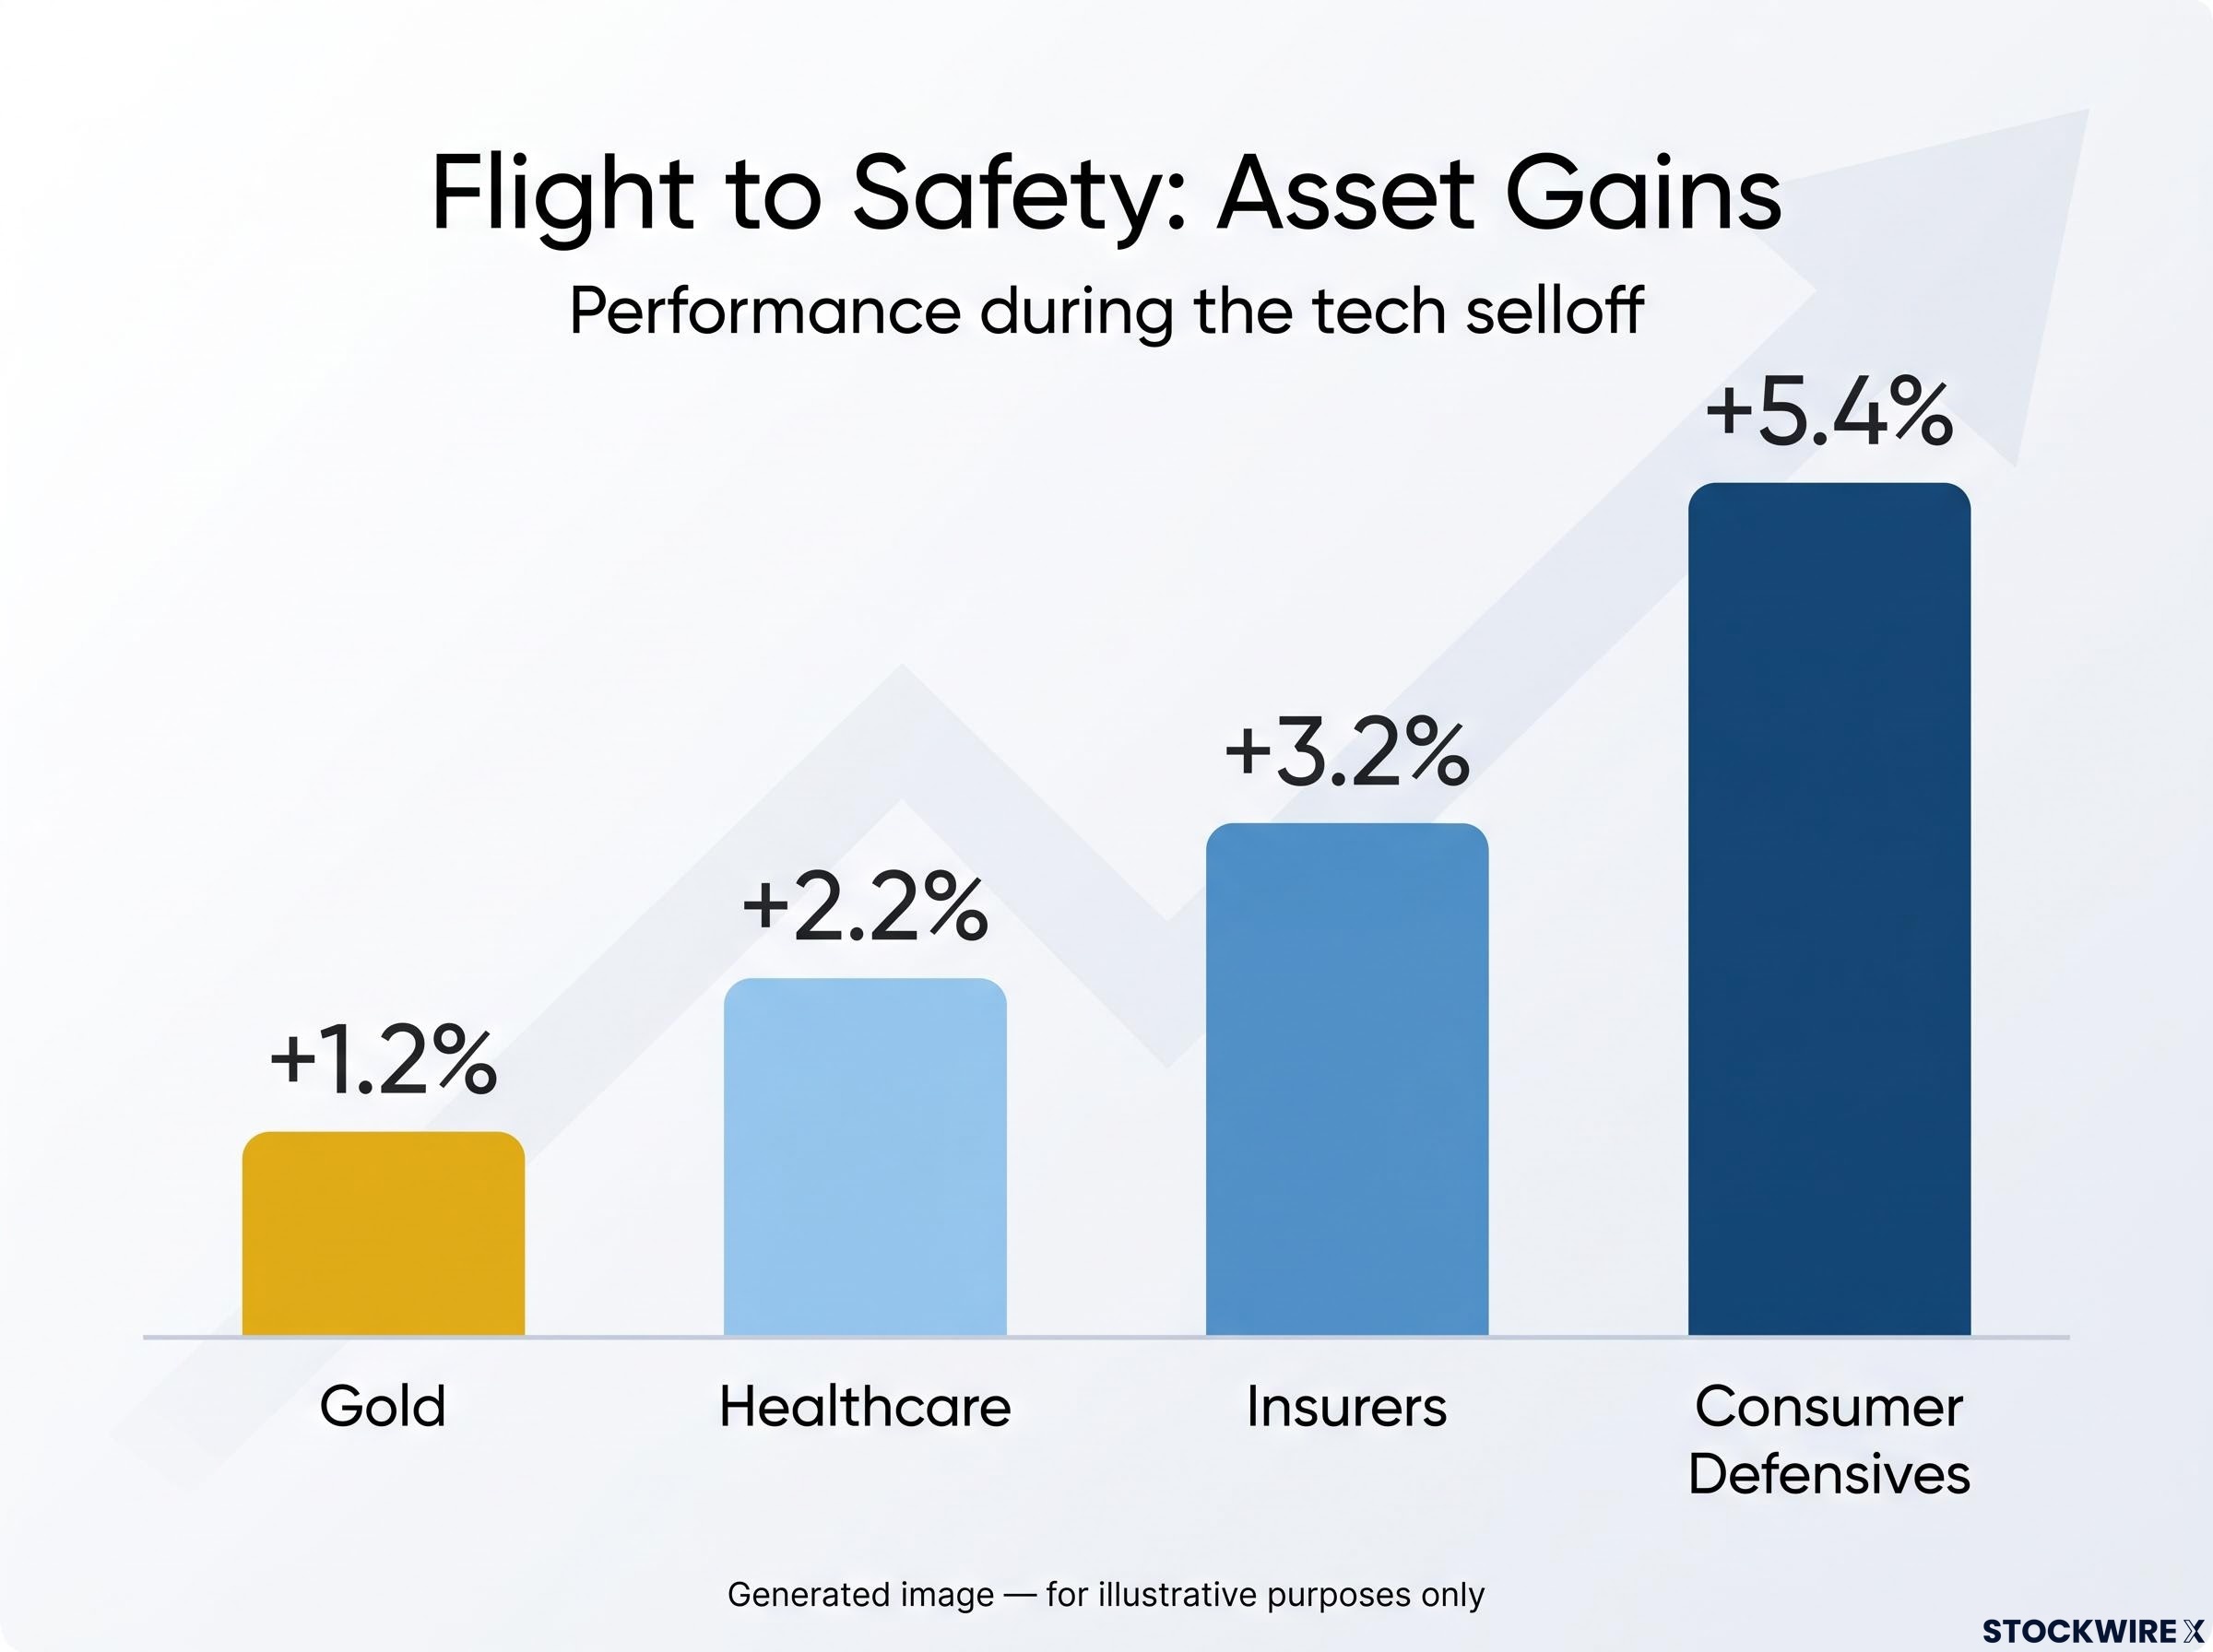
| Gold | Up about 1.2% | About $4,154 on 15 October (Yahoo Finance) |
An equal-weight index gives every company the same slice, so a giant like a chipmaker counts no more than a regional insurer. When that version rises while the Nasdaq drops 4.5%, the losses were concentrated rather than widespread. Reports also pointed to signs of forced position liquidation, meaning funds sold holdings because they had to, not because they chose to.
The gap tells you that your risk this week depended on what your fund owned most of, not on how many holdings it had.
Mega-cap concentration risk explains why a fund holding hundreds of names can still behave like a handful of bets, since five stocks controlled roughly 23% of the broad US index by mid-April 2026.
CoreWeave and the credit signal
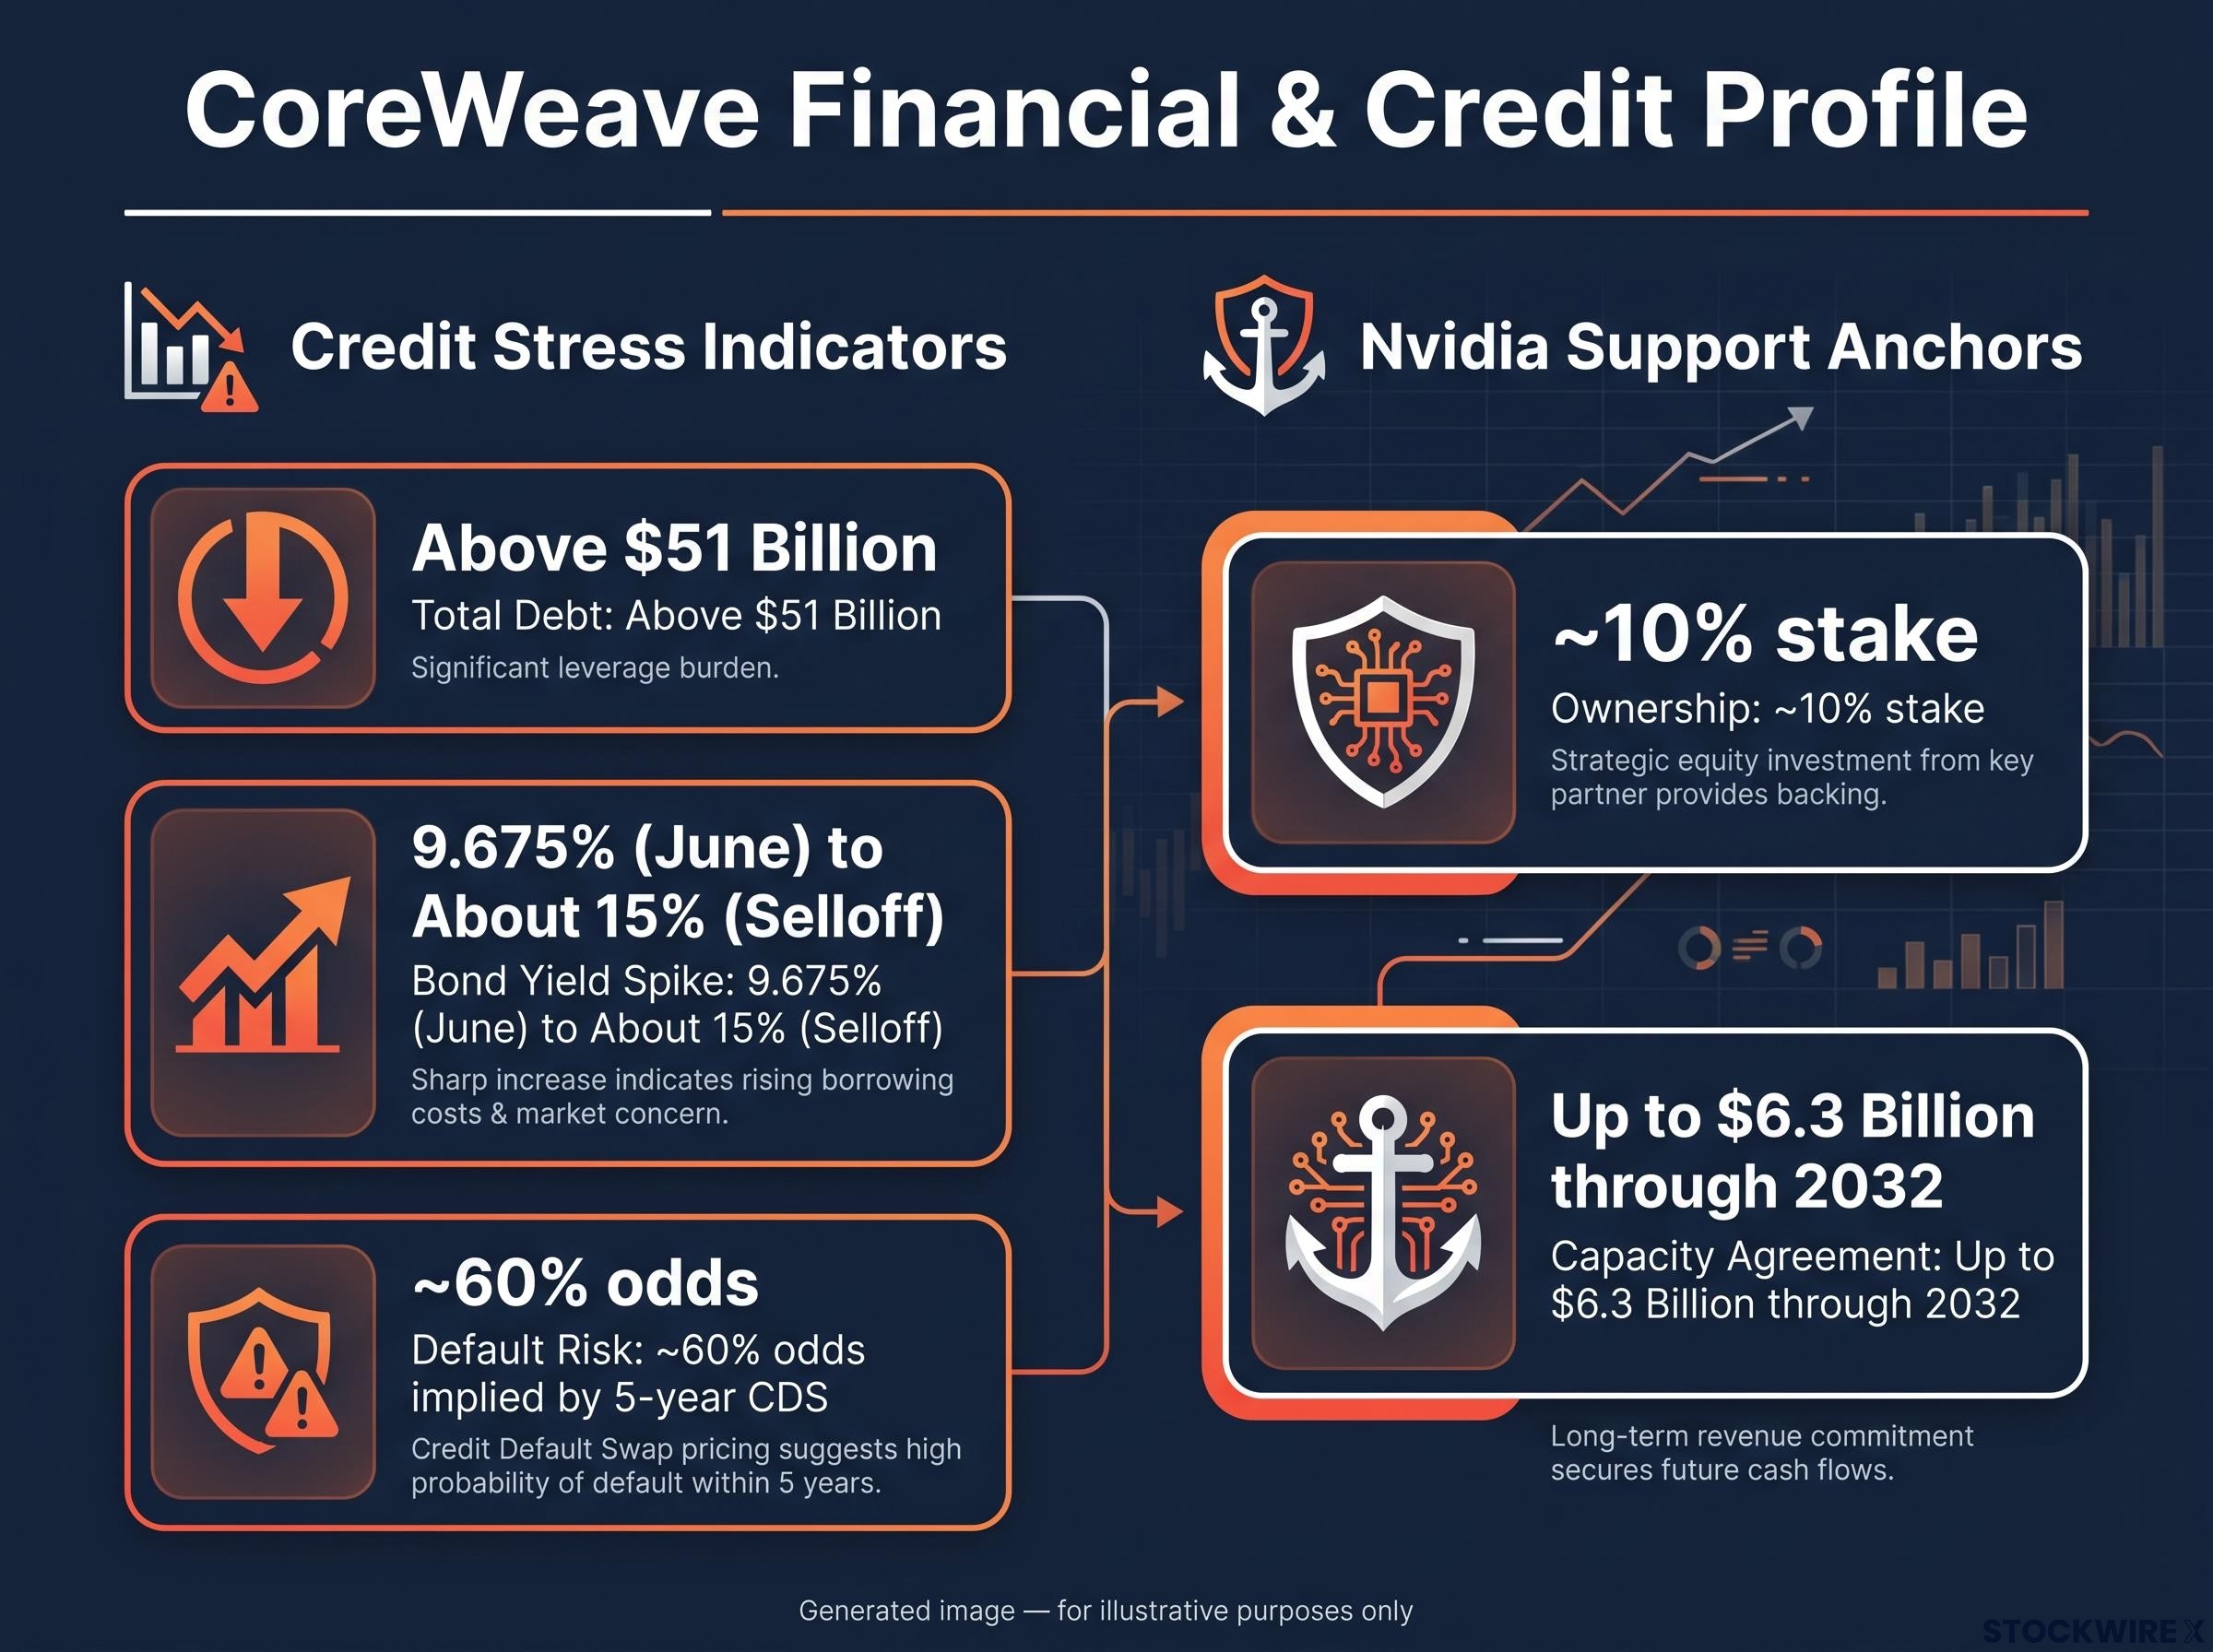
CoreWeave fell about 24-25% on the week, including a drop of more than 11% on Friday. The trigger sat in the bond market. Reuters reported that bonds issued in June at a 9.675% yield had sold off hard enough to push the yield to about 15%.
CNBC cited total debt above $51 billion. Bloomberg reporting, cited by Yahoo Finance, said five-year credit default swap pricing implied roughly 60% odds of default. A credit default swap is a contract that pays out if a borrower fails to repay, so its price works as a market bet on default.
Nvidia owns about 10% of CoreWeave. Any sign of support from Nvidia is now a variable worth watching.
SK Hynix and the memory shock
Memory stocks took the second blow. SK Hynix fell somewhere between 19% and 26% depending on the source and measurement window: 19.25% in the original report, 24.3% per the Korea Herald and about 26% per CNBC. Samsung dropped about 22% and Micron about 11%.
The catalyst was China’s CXMT, which plans denser 4F-squared server memory by the end of 2026. SK Hynix’s one-year forward price-to-earnings (P/E) ratio sat at about 4.59x. P/E compares a share price to expected profit, and a multiple that low suggests the market expects those profits to shrink in a downturn.
When big ASX news breaks, our subscribers know first
How do rising financing costs squeeze leveraged AI infrastructure?
CoreWeave’s revenue was not the problem this week. Its debt was. The step-by-step logic shows why a bond yield can sink a share price even while sales grow.
CoreWeave is a “neocloud”, a company that rents out GPU computing power for AI work. The model runs in five stages:
- Heavy upfront spending. Operators buy GPUs, networking gear and data centre capacity before customers have paid in full.
- Debt matched to contracts. Lenders lend against the equipment and against take-or-pay customer contracts, which oblige customers to pay whether or not they use the capacity.
- Repricing. If borrowing costs move from roughly 6-10% toward 15%, more revenue goes to interest and less is left for shareholders.
- Tenor mismatch. Luminix analysis dated 9 October 2026 found that a $2.6 billion facility, priced at the Secured Overnight Financing Rate (SOFR) plus 5.50%, runs about five years. That is longer than the average customer contract, so renewal risk sits inside the loan.
- Rental price risk. Debt is fixed or paid down slowly, but rental rates can fall quickly and squeeze the cushion available for repayments.
| Financing measure | Figure |
|---|---|
| June bond yield at issuance | 9.675% |
| Yield during the selloff | About 15%; one October 2031 bond briefly above 16% |
| 9% notes | About 80.75 cents on the dollar, roughly 15.3% yield |
| Delayed-draw facility | SOFR + 5.50% on $2.6 billion |
One caveat matters here. The 15% figure is the market yield on stressed bonds, not CoreWeave’s average borrowing cost. Even so, analysts cited in the original coverage suggested an 8% yield would challenge most neoclouds.
Pricing adds pressure. CoreWeave’s on-demand H100 rate is about $49.24 per eight-GPU node-hour (about $6.16 per GPU-hour), against a spot rate near $19.71 per node-hour. Across six providers, Value Add VC put the broader market at about $2.69-$6.16 per GPU-hour, leaving CoreWeave’s list price at the top of the range.
Nvidia has agreed to buy up to $6.3 billion of CoreWeave capacity through 2032. That reassures lenders about demand and collateral, but it does not put shareholders ahead of bondholders.
The question Reuters put to the market Do the returns on huge AI infrastructure spending still add up once inflation and borrowing costs move higher?
If you own AI infrastructure names, or index funds heavy in them, you are exposed to credit conditions as well as AI demand. A falling bond price can warn you before the share price does.
Where did the money go: defensives, Treasuries or gold?
The bond market produced the week’s oddest turn. After inflation data, the 10-year yield surged to about 5.33%. Then it reversed, closing the week down roughly 15-16 basis points.
The 10-year yield near 5.1% matters beyond this week, because concentration at 5% yields pairs two classic bubble preconditions: the top ten S&P 500 names hold roughly 40% of index value just as the bond market keeps repricing.
The yield reversal From a spike near 5.33% to roughly 5.07%-5.10% by week’s end, as money sought shelter during the tech selloff.
That reversal was one of three separate flows, each with its own motive:
- Defensive sectors: bought for their limited exposure to AI spending and long-dated growth valuations.
- Treasuries: bought for safety, as funds cut rate-sensitive tech and priced in slower growth.
- Gold: bought as an asset with no lender behind it and therefore no credit risk.
Defensive sectors
Moomoo heat map data in the original report showed healthcare up 2.2%, insurers up 3.2% and consumer defensives up 5.4%. None of these depends on GPU financing or on profits expected far in the future.
Treasuries and gold
Falling yields did not mean inflation fears disappeared. The drop reflected safe-haven demand, tech de-risking and expectations that tighter conditions could slow the economy. Gold rose about 1.2% to roughly $4,154 on 15 October, per Yahoo Finance, and the original source cited about $4,181 later in the week.
Bonds, gold and defensives rising together tells you the market was repricing risk broadly, not reacting to one headline. It also shows you which parts of a portfolio did their job this week.
Can diversification and equal-weight exposure really cushion a tech drawdown?
This week made diversification look easy. The record is less tidy, and it helps to build the idea in layers.
Cap-weight versus equal-weight
A cap-weighted index sizes each holding by market value. It owns more of the biggest earners and rebalances itself toward companies gaining importance. An equal-weight index cuts dependence on mega-caps and adds more industrials, financials and healthcare.
Concentration is the core concern. Research Affiliates found the seven largest stocks made up about 28% of the S&P 500 at the end of 2024. CNBC on 15 October suggested a middle path: holding both styles rather than abandoning either.
Institutional views lean the same way:
- JPMorgan: spread exposure across equities, fixed income, gold and alternatives, given concentration and higher stock-bond correlation.
- BlackRock (1 October 2026): consider liquid alternatives, dividends and quality equities to diversify around AI concentration.
- Morningstar (17 October 2026): equal-weight rose for a second straight week as leadership shifted away from tech.
When hedges fail
Each diversifier has a weak spot.
| Diversifier | What it offered this week | When it can fail | Evidence |
|---|---|---|---|
| Equal-weight | Small gain while Nasdaq fell | Long stretches of lagging; more small-cap and cyclical risk | Trailed cap-weight by about 6 percentage points over six months in one report |
| Treasuries | Yields fell, prices rose | Inflation shocks | BlackRock: bonds fell in 17 of 19 months of 2%+ equity drops since 2020 |
| Gold | Up about 1.2% | Forced selling, rising real yields | JPMorgan cites 2022 |
| Defensives | Gains of 2.2%-5.4% | Crowding and stretched valuations | Qualitative risk |
BlackRock’s count includes March 2026, a reminder that the bond cushion was not available this year either.
Safe haven assets do not respond uniformly across crises; gold fell about 14.6% in March 2026 during a supply shock, a reminder that each hedge protects against specific risks and can fail when the shock changes character.
What history adds
The 2000-02 dot-com bust showed that a winning sector can become an excessive concentration before its fundamentals visibly fail. Value, healthcare, international shares and quality bonds softened that drawdown for diversified holders.
In 2022, stocks and long-dated bonds fell together. Gold was roughly flat at about -0.3% while bonds lost about 13%.
The 2024 concentration surge pushed some investors from the S&P 500 toward equal-weight products, according to Morningstar. Read this week as evidence for spreading risk across sectors, company sizes and asset classes, not proof that any single hedge will work next time.
This is general information, not personalised advice. Past performance does not guarantee future results.
What this week changes, and what it does not
The selloff was concentrated, driven by financing stress, and cushioned unevenly. It strengthens the case for spreading exposure across sectors, company sizes, geographies and asset classes. It does not guarantee any single diversifier.
Three variables deserve your attention:
- CoreWeave’s bond yields, and any signal of further Nvidia support.
- The path of the 10-year yield as inflation data keeps arriving.
- Whether equal-weight leadership lasts beyond two weeks.
The decision point is personal. Check how much of your portfolio rides on a few mega-cap tech names, and ask whether your hedges would hold up if stocks, bonds and gold fell together.
This article is for informational purposes only and should not be considered financial advice. Investors should conduct their own research and consult with financial professionals before making investment decisions. Forward-looking statements are speculative and subject to change based on market developments and company performance.