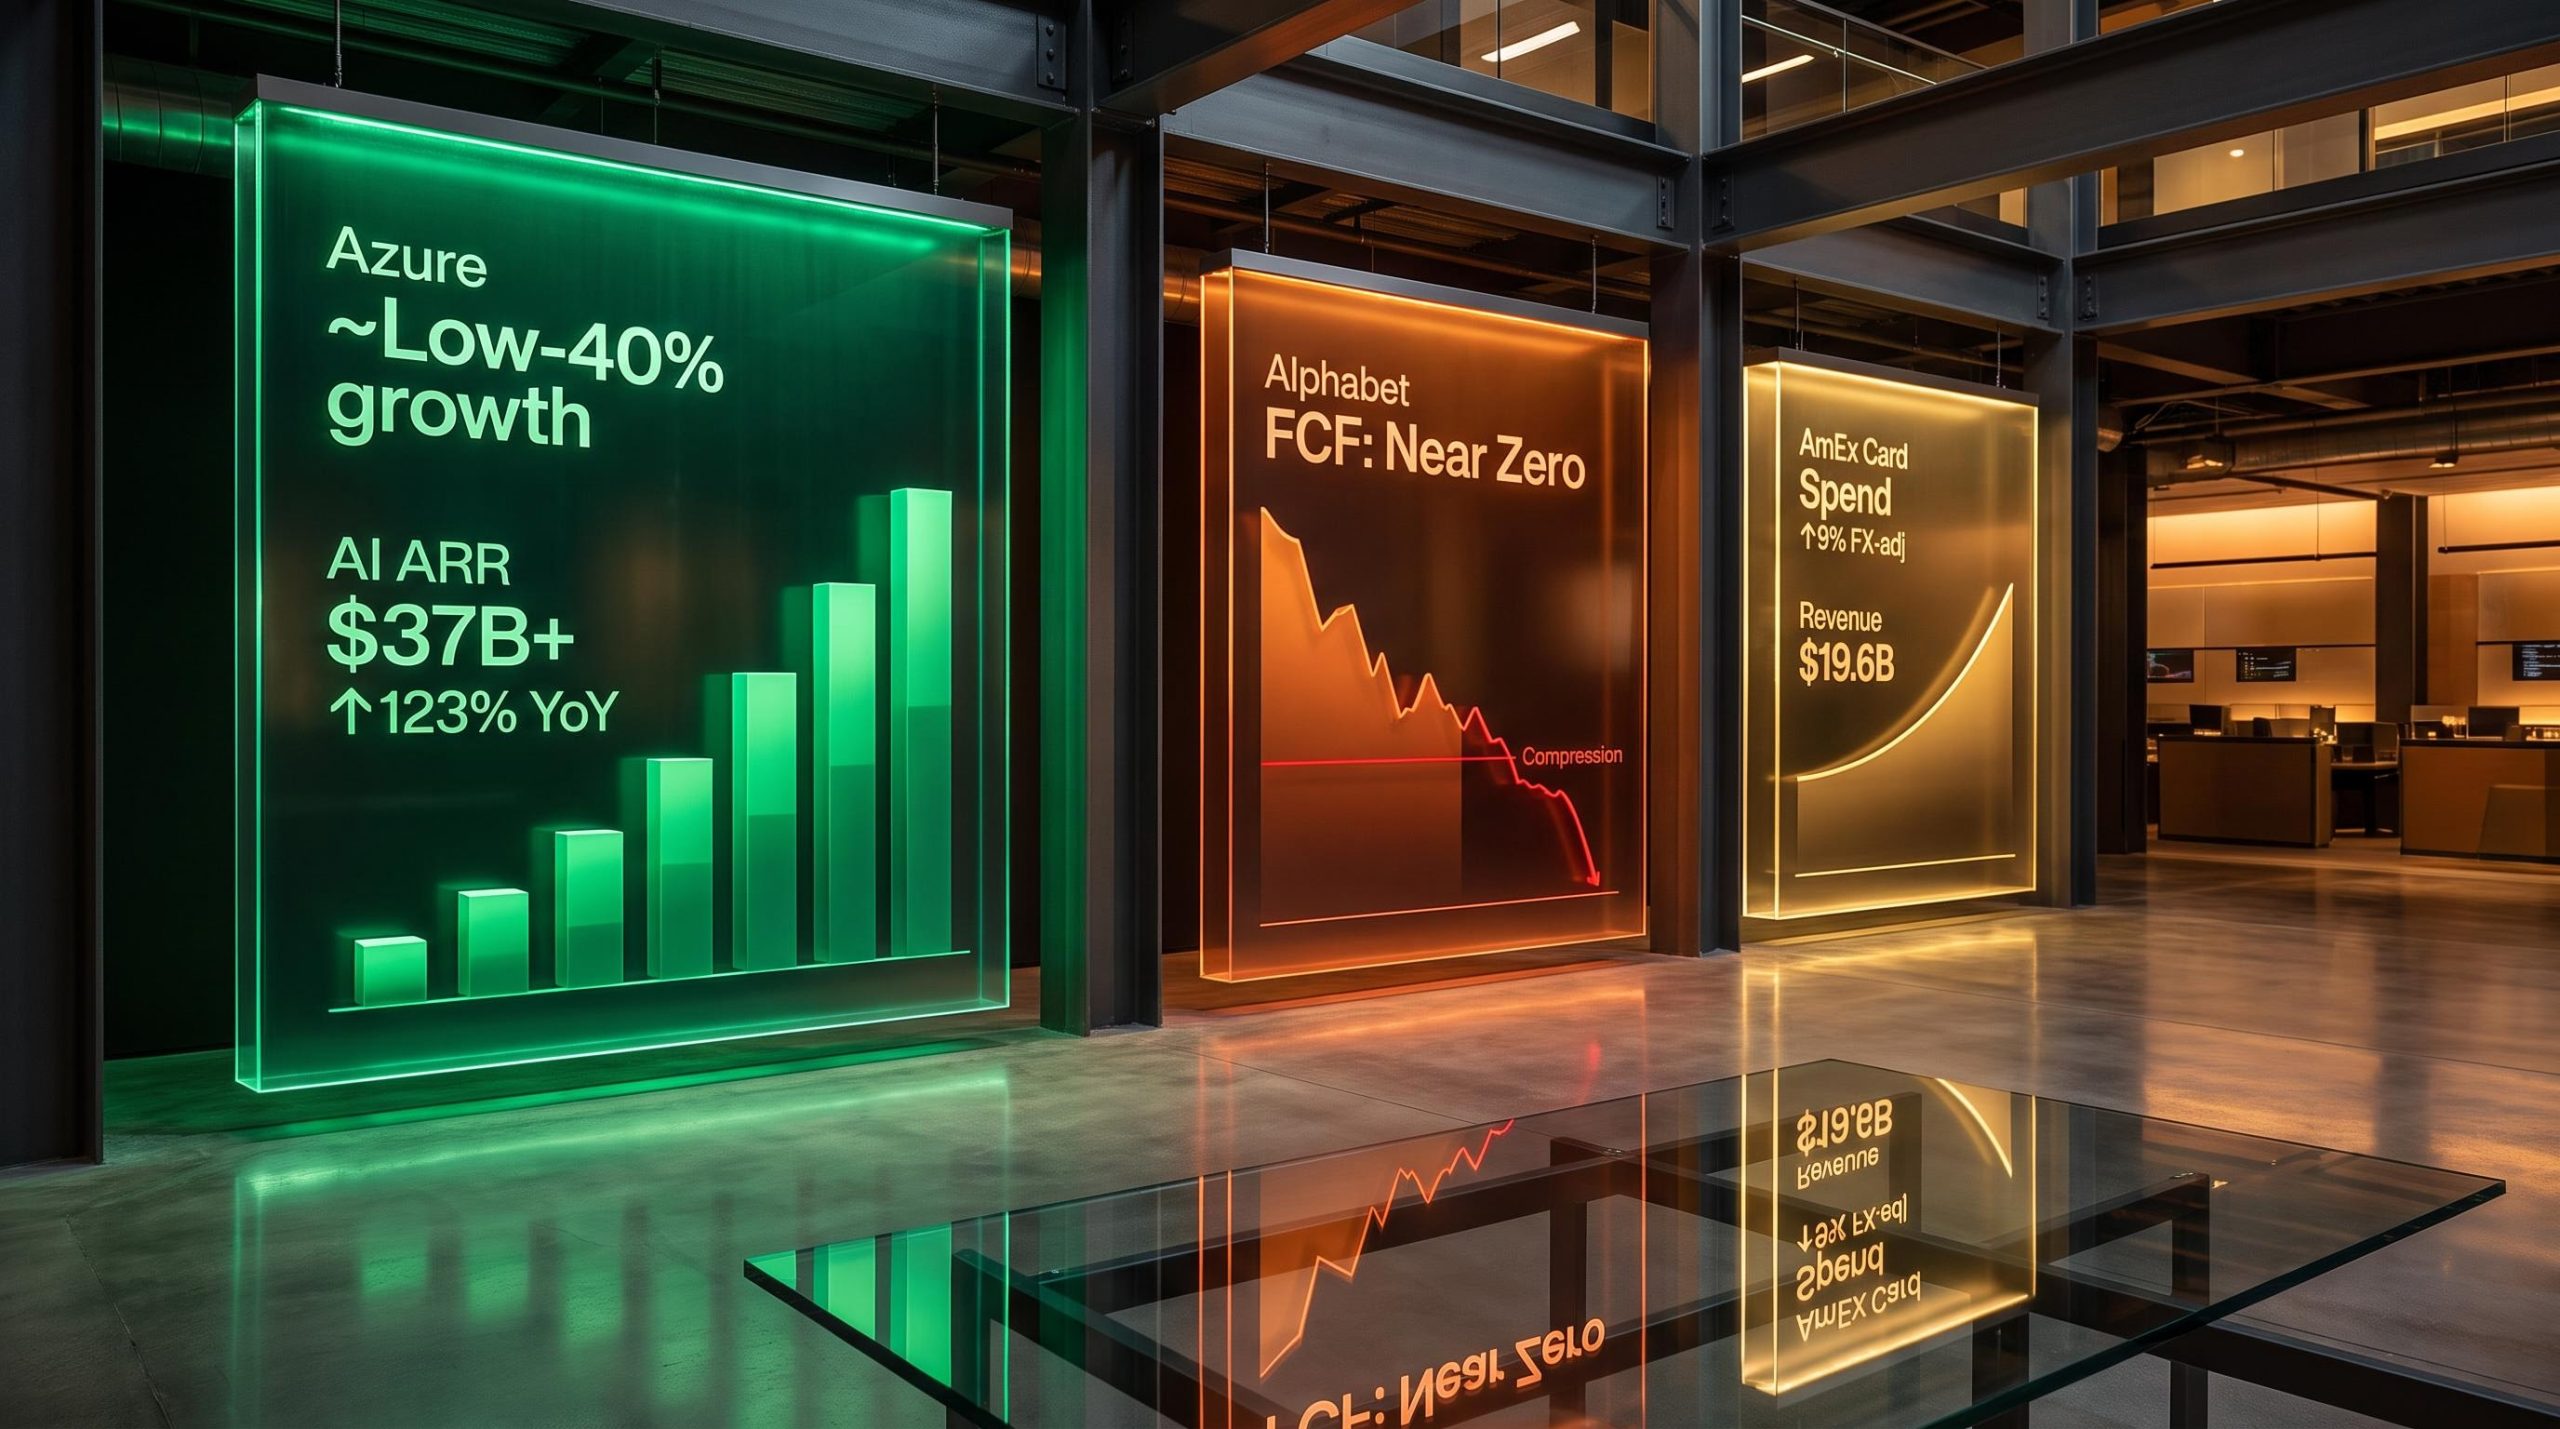
Three of the most-watched names in US equities reported on the same earnings calendar, and the combined picture they paint is more instructive than any single result. Microsoft is accelerating. Alphabet is investing its way into a cash flow deficit it has not experienced since going public. American Express is quietly posting the strongest card-member spending growth in three years. Together, they tell a story about where money is flowing in the US economy right now, and where it is not.
Earnings season is the moment when corporate strategy meets financial reality. For investors holding or evaluating exposure to technology or premium consumer names, the Q2 and fiscal Q4 2026 reporting cycle has delivered both confirmation and complication. The confirmation: AI-driven cloud demand is not slowing. The complication: funding that demand is extracting a measurable cost from balance sheets, and not every company is navigating that trade-off the same way.
Here is a clear framework for reading each set of results on its own terms, understanding what the numbers signal about the health of each underlying business, and assessing what the collective picture means for portfolio positioning across technology and premium consumer exposure.
What Microsoft’s quarter tells you about the AI cloud thesis
Microsoft reported fiscal Q4 2026 results that were strong across the board, but one number reframes the entire quarter from “solid” to “structural.”
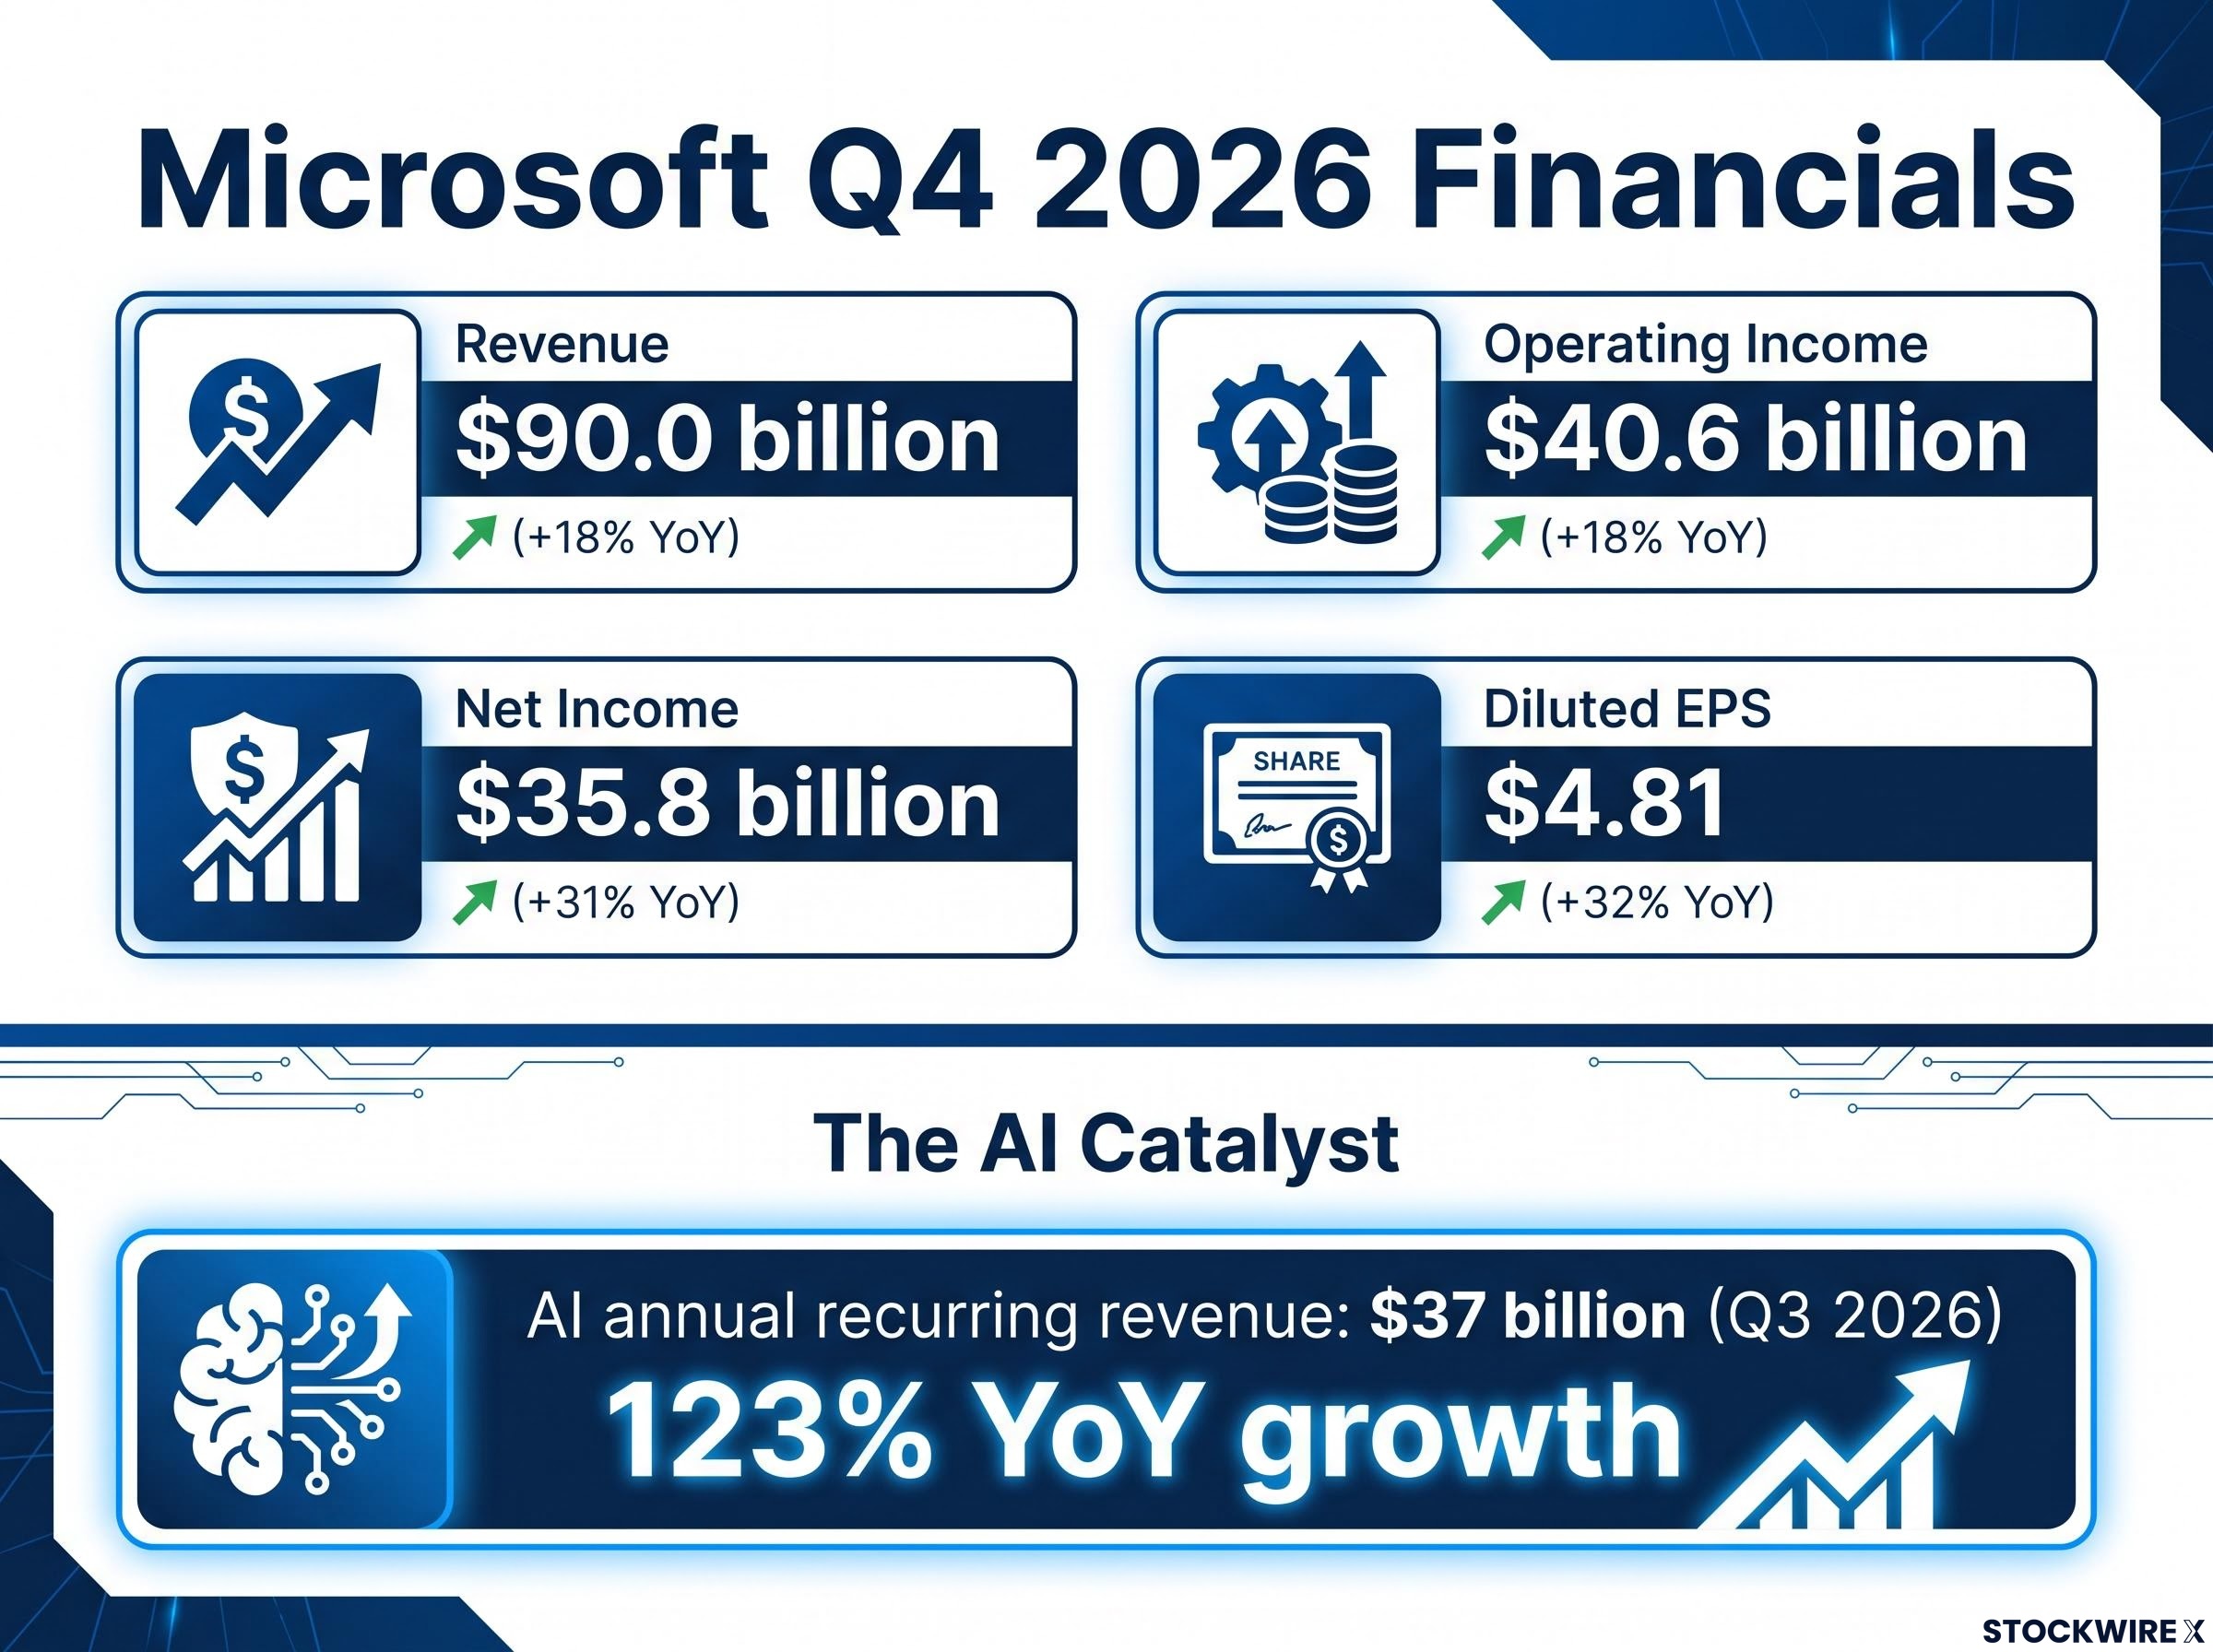
- Revenue: $90.0 billion, up 18% year-over-year
- Operating income: $40.6 billion, up 18% year-over-year
- Net income: $35.8 billion, up 31% year-over-year
- Diluted EPS: $4.81, up 32% year-over-year
Azure cloud growth came in at roughly the low-40% mark, a rate the platform has not achieved in around five years and the single most significant figure in the quarter. That acceleration is the central analytical signal. AI workloads are layering on top of existing cloud migration demand rather than replacing it, and that distinction changes the outlook for the entire category. Prior cloud growth cycles decelerated as enterprise migrations matured. This one is re-accelerating because AI is generating an entirely new layer of compute demand that sits on top of, not instead of, the base workload.
AI annual recurring revenue surpassed $37 billion in Q3 2026, growing 123% year-over-year. That growth rate, at that scale, is what separates the AI monetisation thesis from speculation.
LinkedIn revenue grew 10%, and search advertising also advanced during the period, evidence of broad-based momentum beyond the cloud headline. The one structurally weak segment remains Xbox gaming, which has underperformed for several years.
| Segment | Growth Rate | Analyst Signal |
|---|---|---|
| Azure | Low-40% | AI-driven re-acceleration; fastest pace in ~5 years |
| 10% | Steady contributor; broad-based momentum | |
| Xbox Gaming | Declining/flat | Structurally weak; multi-year underperformance |
What this means for anyone holding or evaluating Microsoft exposure: the Azure acceleration signals that AI spending is extending the cloud growth runway rather than cannibalising it. Consensus estimates of the cycle’s duration and magnitude were too conservative. Revenue and margin are expanding simultaneously, a rare combination at this scale that suggests earnings quality is rising, not just earnings quantity.
The Azure acceleration also moved markets well beyond Microsoft itself: the AI supply chain repriced sharply in the July 30 session, with Micron gaining approximately 18.4% as hyperscaler cloud consumption data translated directly into semiconductor demand signals across the infrastructure stack.
When big ASX news breaks, our subscribers know first
How to read an earnings report beyond the headline number
Three financial metrics separate an informed investment read from a headline scan, and they apply directly to the three companies in this article:
- Revenue growth rate. This is top-line momentum, the simplest measure of whether a business is gaining or losing share. Microsoft’s 18% is strong. AmEx’s 10% tells a different story about a different market.
- Net income growth versus revenue growth. The spread between these two numbers reveals margin direction. When net income grows faster than revenue, as with Microsoft’s 31% net income growth against 18% revenue growth, margins are expanding. When net income trails revenue, as with AmEx’s 8% versus 10%, the company is spending more to sustain each dollar of growth.
- Free cash flow. This is the actual cash a business generates after paying for its operations and investments. It is the number that tells you whether reported earnings translate into real money the company can return to shareholders, reinvest, or use to reduce debt.
The spread between EPS growth and free cash flow trajectory is often the most informative signal for mature large-cap technology companies. That gap reveals whether earnings quality is rising or eroding. Microsoft’s 32% EPS growth alongside expanding margins is a high-quality earnings profile. Alphabet’s situation provides the contrasting case.
What capex intensity adds to the picture
Capital expenditure intensity, the proportion of revenue a company spends on infrastructure, equipment, and facilities, adds a second analytical layer. High-capex investment cycles are normal for technology infrastructure businesses. The investor question is not whether the spending is happening but whether the timing and payback horizon justify the cash flow cost at current valuations.
Microsoft is investing heavily but still generating strong free cash flow. Alphabet is investing at a level that has pushed free cash flow into rare negative or near-zero territory. Both are building AI infrastructure. The difference in cash flow outcome tells you that the return profile is not the same, even if the strategic rationale sounds similar.
The cost of Alphabet’s AI ambition: free cash flow in focus
Alphabet reported Q2 2026 results that opened with the kind of revenue story investors want to hear. Total revenue growth was in the mid-20s range, directionally consistent with a company firing on multiple cylinders. YouTube advertising revenue grew 13% year-over-year. The top-line trajectory was strong.
Then the cash flow statement arrived.
Alphabet reported its first-ever negative free cash flow quarter as a public company in Q2 2026, with $44.9 billion in capex exceeding operating cash flow by approximately $5.9 billion; the CFO explicitly guided that this pressure will persist for multiple quarters, making it a structural baseline rather than a one-quarter anomaly.
Alphabet experienced negative or near-zero free cash flow during the quarter, driven by AI infrastructure capital expenditure at unprecedented scale. Across large-cap technology, this is the most unusual data point of the current earnings cycle.
The compression is driven by the sheer scale of what Alphabet is building: data centres, AI chips, and the compute layer required to run both Google Search AI features and Google Cloud Platform at competitive scale. The strategic rationale is coherent. The investor question is whether the payback arrives inside the period that current shareholders are willing to hold through.
What the capex cycle is funding
Alphabet’s infrastructure investment spans the full AI stack. The company is simultaneously defending its search business against AI-native competitors and investing in cloud infrastructure to compete with Microsoft Azure and Amazon Web Services. The spend is real, the ambition is clear, and the cash flow cost is measurable.
The market is pricing the uncertainty. Alphabet trades at approximately 16x earnings, inexpensive by its own historical standards. But that multiple only represents value if the capex cycle converts into durable incremental revenue rather than infrastructure that defends existing share without adding new monetisation.
| Thesis Element | Bull Case | Bear Case |
|---|---|---|
| Cash Flow Impact | Temporary compression; normalises as capex growth moderates | Structural shift; AI infrastructure demands ongoing reinvestment |
| Search Durability | AI integration defends and expands search economics | AI-native competitors erode core search revenue over time |
| Cloud Growth | Google Cloud gains share and reaches sustainable profitability | Cloud remains a cost centre relative to Azure’s monetisation pace |
Alphabet presents the most complex risk-reward calculation of the three companies covered here: cheap on historical earnings multiples, but carrying a cash flow profile that demands confidence in the payback timeline of a multi-year infrastructure bet.
American Express and what premium consumer resilience actually looks like in the data
The register shifts here, from capital-intensive AI infrastructure to something simpler but equally significant. Consumers at the top end of the income distribution are spending more, not less, and American Express has the cleanest data to prove it.
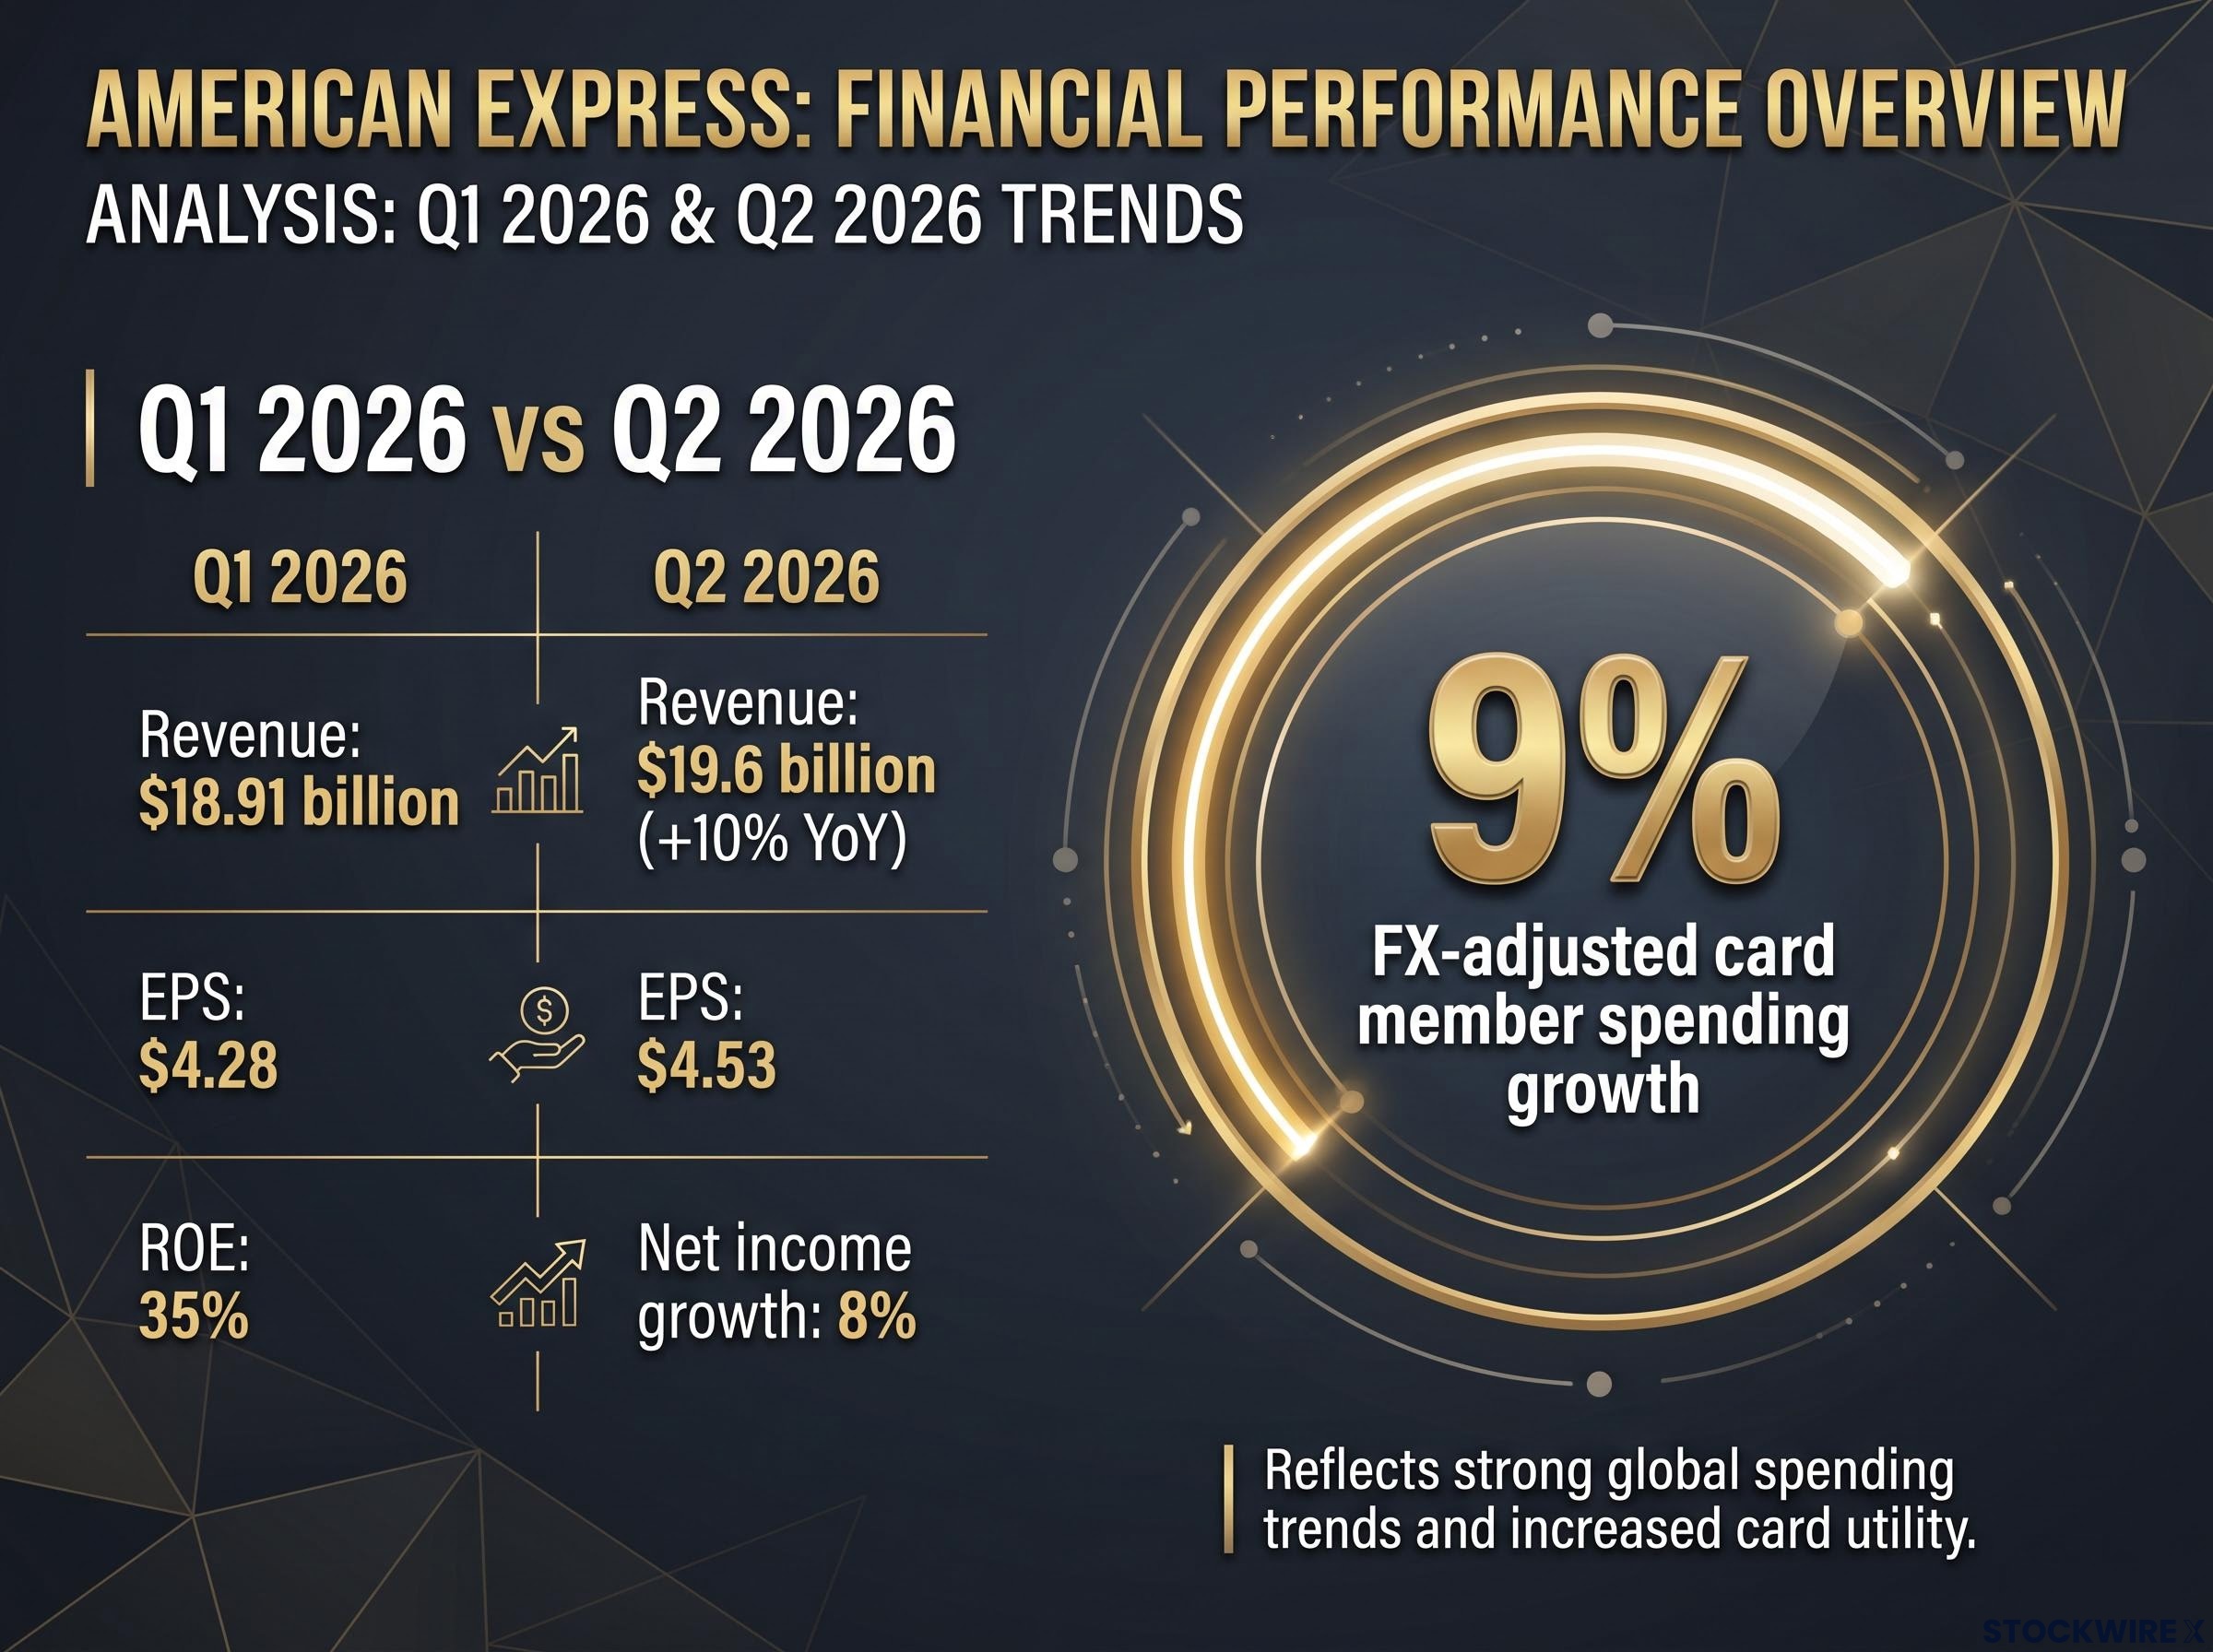
Q2 2026 results told the story clearly: revenue of $19.6 billion (up 10% year-over-year), earnings per share of $4.53, and card member spending growth of 9% on an FX-adjusted basis.
That 9% FX-adjusted card member spending growth is the highest rate American Express has reported in approximately three years. It is the single most market-relevant number in this section.
The spending is concentrated in three categories:
- Travel
- Entertainment
- Premium retail
CEO Steven Squeri described the quarter as excellent in public commentary. The numbers support the characterisation.
Net income grew 8% against that 10% revenue growth. The gap is not a warning sign. It reflects deliberate investment: marketing expenditure hit $1.6 billion for the quarter, up from $1.5 billion in the prior period, and loyalty costs are rising alongside richer benefits offerings. This is the cost of sustaining a premium brand network, and investors need to evaluate it as an investment in competitive positioning rather than margin erosion.
For context, Q1 2026 comparators show $18.91 billion in revenue, $4.28 EPS, and a 35% return on equity (ROE), the percentage of net income generated relative to shareholders’ equity, a measure of how efficiently a company turns invested capital into profit.
The consumer bifurcation thesis is explicit here. Higher-income consumers are spending robustly while lower-income cohorts show signs of constraint. AmEx’s structural skew toward affluent and corporate cardholders is a competitive positioning advantage in precisely this environment.
Premium consumer spending sits inside a broader data picture that is counterintuitive: Bank of America card transactions posted their strongest year-over-year growth in more than four years in June 2026 even as consumer sentiment surveys fell below both COVID-19 peak lows and post-September 11 levels, a divergence that makes sentiment an unreliable real-time guide to actual demand conditions.
What these three results signal collectively about AI monetisation and the consumer
Individually, each result tells a company-specific story. Read together, the pattern that emerges carries more investment weight than any single quarter.
The AI monetisation thesis has a confirmation case and a cost case, and they belong to different companies. Microsoft’s results confirm that the revenue is arriving: $37 billion-plus in AI annual recurring revenue growing at 123% year-over-year, accreting to existing enterprise relationships through Copilot and Azure. Alphabet’s results confirm that the infrastructure cost is real and front-loaded, with free cash flow compressed to a degree the company has rarely experienced.
The divergence between the two illustrates that AI monetisation is not uniform across platforms. It depends on go-to-market architecture and the speed of enterprise adoption cycles. Microsoft’s position, layering AI into existing enterprise subscriptions, produces faster revenue recognition than Alphabet’s position, which involves defending a search and cloud business that is structurally more exposed to disruption.
| Company | Key Result Signal | Primary Risk | Investor Positioning |
|---|---|---|---|
| Microsoft | AI monetisation visible in revenue and margin | Capex sustaining growth may compress FCF later | Confirmation play; clearest AI revenue evidence |
| Alphabet | Strong revenue; unprecedented FCF compression | Capex payback timeline uncertain; search moat under pressure | Patient capital play; cheap if capex converts |
| American Express | Highest card spending growth in ~3 years | Premium consumer slowdown if macro deteriorates sharply | Structural positioning play; premium consumer exposure |
The consumer bifurcation reading across financial services
AmEx’s 9% card member spending growth sits inside a broader pattern. Across financial services earnings in this cycle, lower-income delinquencies are rising, mass-market discretionary spending is slowing, and premium category spending is holding or accelerating. This is not a cyclical blip. Given income inequality trends and AmEx’s deliberate upmarket positioning, this bifurcation is structural, and it favours the premium consumer segment that AmEx has built its network around.
Where the investment case stands as the capex cycle matures
These three results clarify each company’s investment thesis without resolving it. The distinction matters.
Microsoft is the confirmation play. AI monetisation is visible, margins are expanding, and forward price-to-earnings ratios are declining while earnings quality improves. Consensus estimates are likely to revise upward. Alphabet is the patient capital play, trading at approximately 16x earnings, cheap by historical standards, but requiring conviction that the capex cycle converts to revenue at acceptable returns. American Express is the structural positioning play, with a 35% ROE and premium consumer skew that insulates from the macro risks weighing most heavily on mass-market lenders.
Microsoft’s concentration risk deserves scrutiny alongside the growth headline: approximately 45% of Azure’s reported backlog is attributed to a single counterparty, OpenAI, which has since confirmed compute partnerships with both AWS and Google Cloud, eroding the exclusivity assumption that underpinned the Azure competitive advantage narrative.
Three forward variables will determine whether these theses hold:
- The pace of Azure customer expansion as AI workloads mature beyond early adopters
- The trajectory of Alphabet’s free cash flow as capex growth moderates in coming quarters
- The durability of premium consumer spending if the macroeconomic environment deteriorates more sharply than current consensus expects
The earnings cycle clarifies the thesis for each name rather than resolves it. The decision framework is not which company reported the best quarter, but which investment thesis you have the most conviction in over the next two to three years.
The next quarterly cycle will either reinforce or complicate each of these readings. The framework above gives you a structured way to evaluate your existing exposure or assess new positions, grounded in what the most recent earnings data actually reveals.
This article is for informational purposes only and should not be considered financial advice. Investors should conduct their own research and consult with financial professionals before making investment decisions. Past performance does not guarantee future results. Financial projections are subject to market conditions and various risk factors.
—