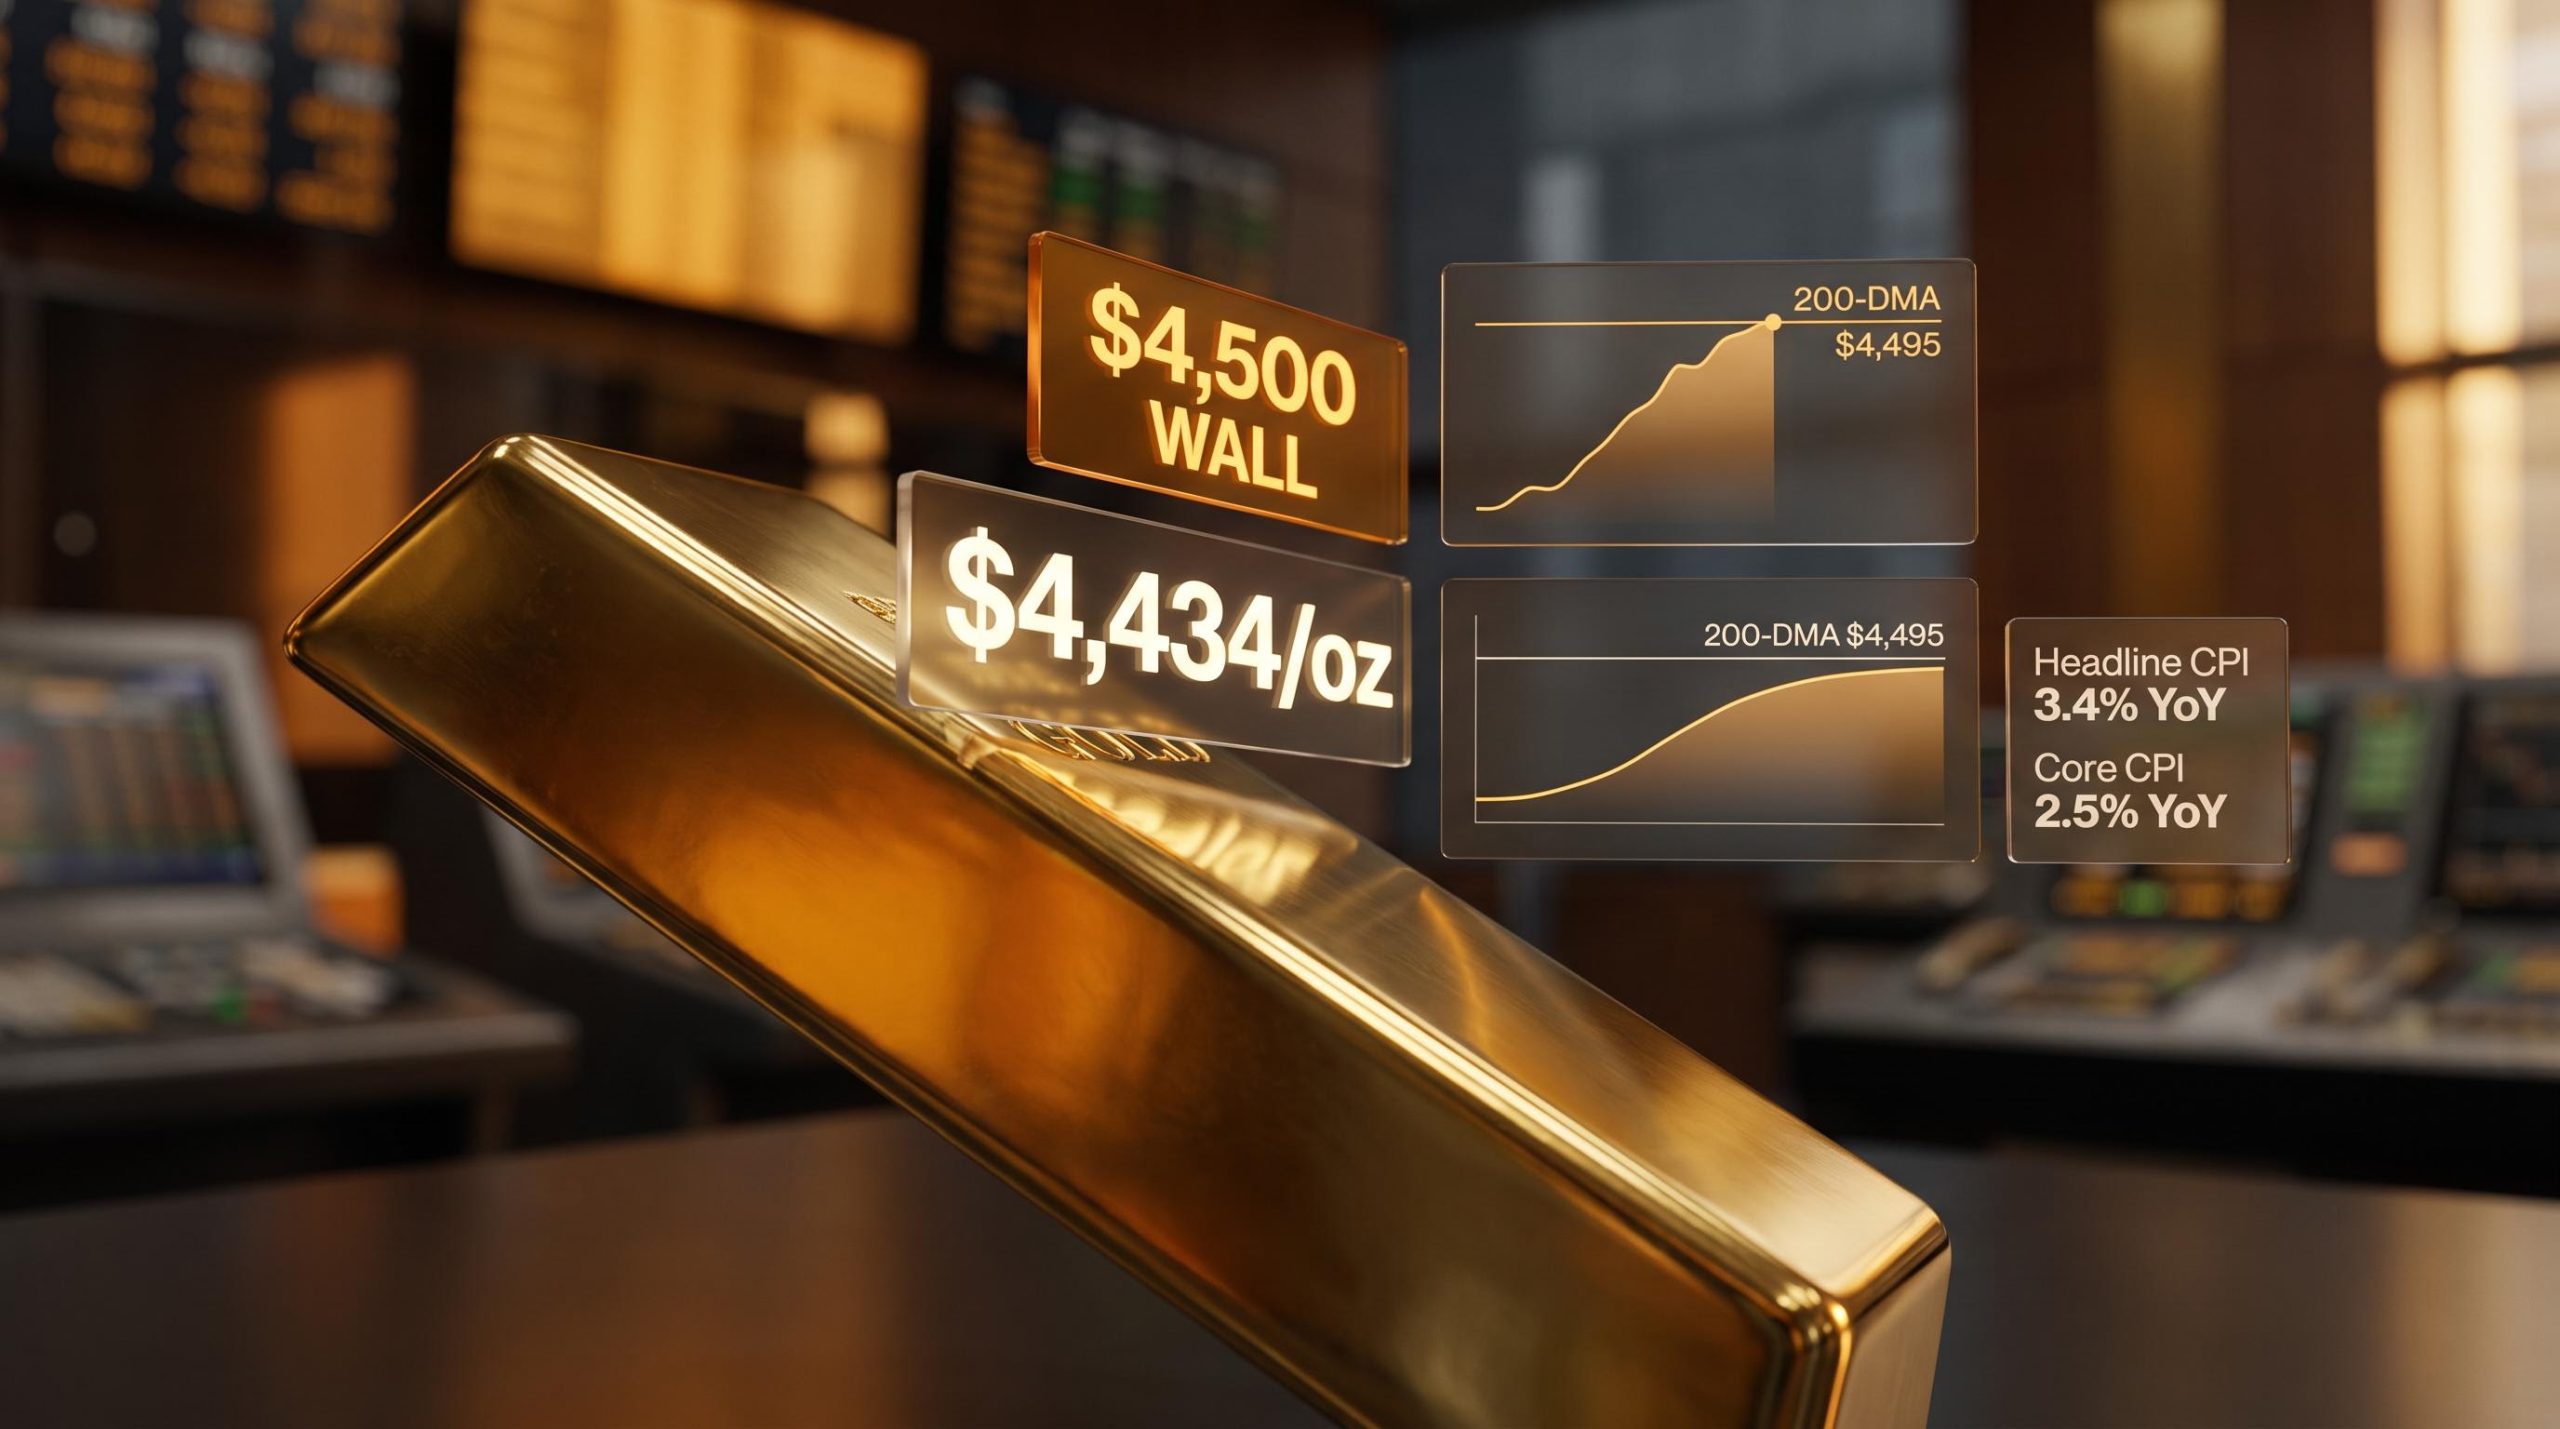
Gold just posted its strongest session since early June, rallying roughly 1% to approximately $4,434-$4,438/oz after the July CPI print landed exactly where forecasters expected it. And the move stalled. Not because the data was bad, but because it was not good enough to resolve the one question that actually matters for the next leg higher.
That question is the gap between “no new reason to hike” and “confirmed end of hikes.” The July inflation numbers delivered the first reading. Gold is priced for it. What gold is not priced for is the second, and until the Federal Reserve closes that gap explicitly, the ceiling holds. Understanding this distinction is what separates a reactive read on gold from a useful one.
Here is the framework for assessing what would need to change, and what signals to watch, before gold has a realistic path toward $4,500 and beyond. This is not a price prediction. It is a decision-support read built around the specific conditions and triggers that will determine the next move.
What the July CPI actually did (and did not) do for gold
The post-CPI rally pushed spot gold to approximately $4,434-$4,438/oz, its highest level since early June. That gain of roughly 1% was meaningful in context: it confirmed that the market is willing to bid gold toward the upper end of its trading range when inflation data removes near-term tightening risk.
The pre-CPI technical setup identified $4,417 as the critical Fibonacci close to watch, with a confirmed hold above that level required to signal directional continuation rather than a ceiling retest at $4,400.
The specific numbers explain why the move stopped there:
- Headline CPI: 3.4% year-over-year, down from 3.5% in June, in line with consensus
- Core CPI: 2.5% year-over-year, down from 2.6% in June, matching forecasts
- No upside surprise on any reported measure
An in-line print reduces the probability of a rate hike at the next meeting. It does not eliminate it. That distinction is doing all the work right now. Markets read this as supportive, not decisive, and gold responded accordingly.
Bart Melek at TD Securities expects gold to remain near the top of its elevated trading range rather than decisively breaking out, absent clearer confirmation that the Fed is finished tightening.
A tame-but-expected CPI print moves gold toward its ceiling but cannot punch through it. What this tells you is that the next move will be decided by the inflation data that surprises, not the data that confirms.
When big ASX news breaks, our subscribers know first
The $4,500 wall: what the technical structure is actually telling traders
The $4,500 level is not an arbitrary round number. It is a zone where several independent technical and institutional signals converge, creating a structural barrier that separates a grinding rally from a genuine breakout.
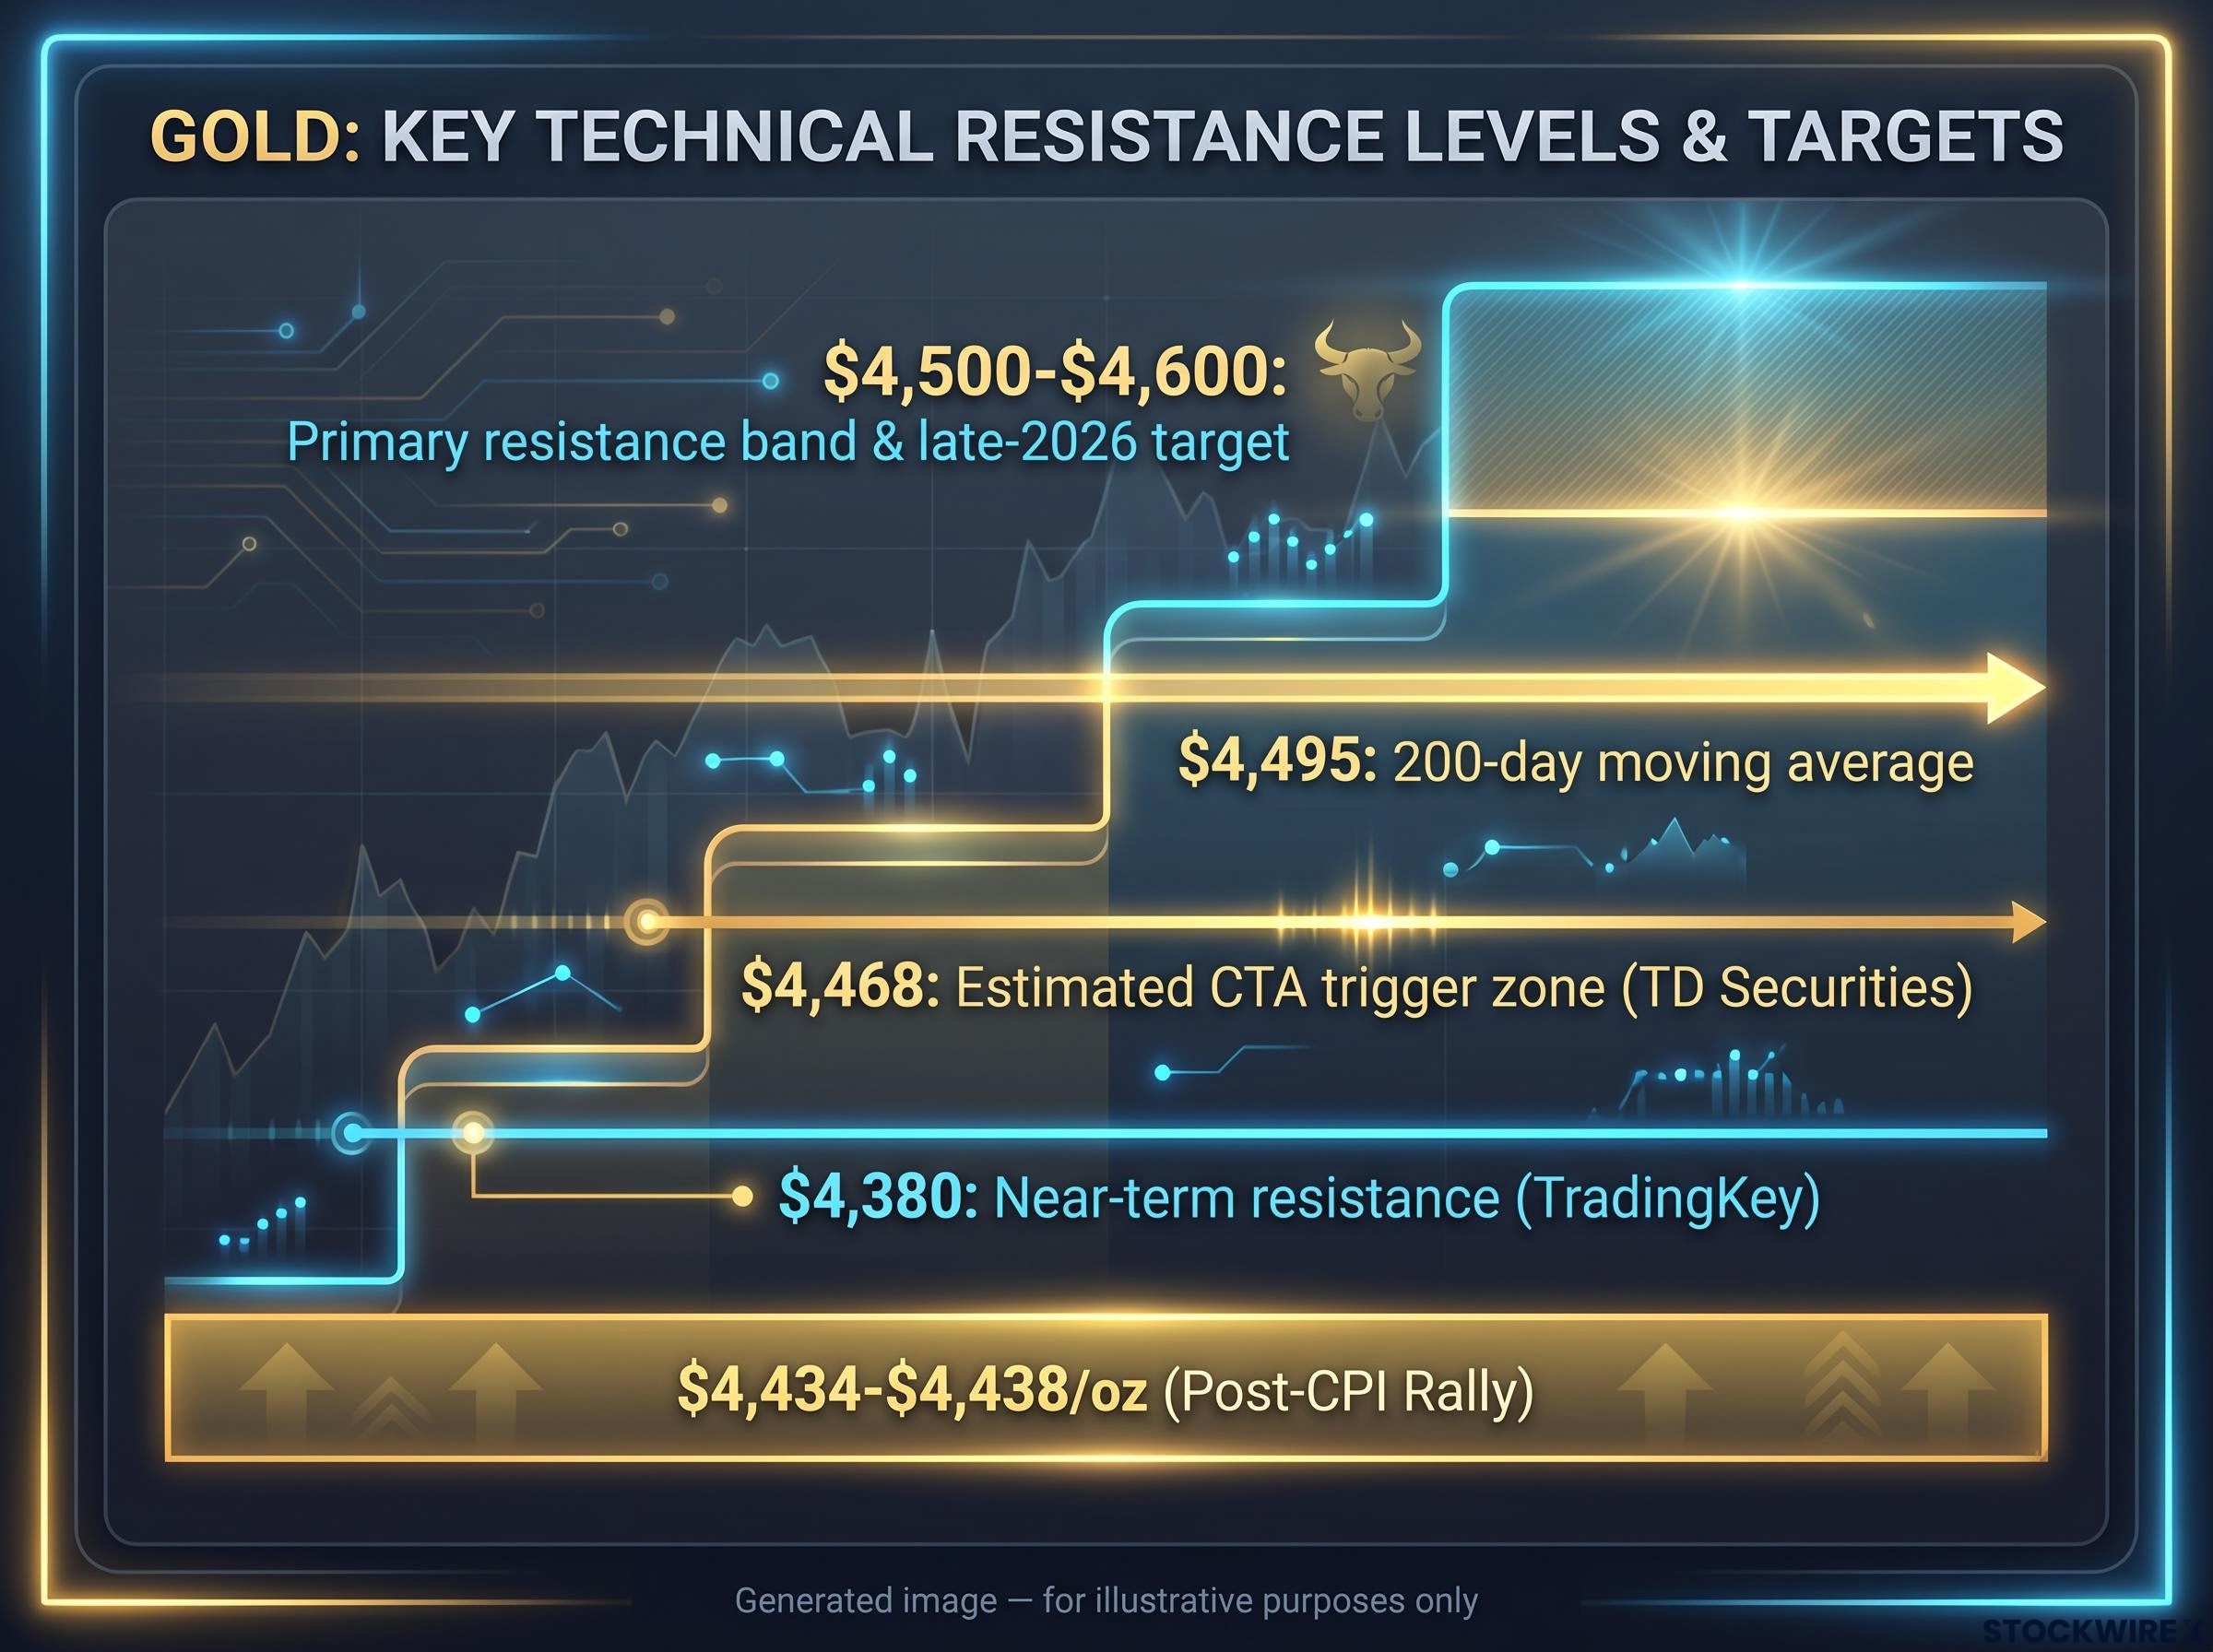
| Level | Type | Significance |
|---|---|---|
| $4,380 | Near-term resistance | TradingKey identifies this as the level whose break opens room toward $4,500 and then $4,600 |
| $4,468 | Estimated CTA trigger zone | TD Securities analytical framework; model-specific, not a publicly disclosed figure |
| $4,495 | 200-day moving average | Reinforces the $4,500 region as a structural barrier, not just a psychological one |
| $4,500-$4,600 | Primary resistance band | Cited across multiple bank and analyst forecasts as the late-2026 target and resistance zone |
The 200-day moving average sitting near $4,495 is what gives the $4,500 zone its structural weight. When a major moving average aligns with a round-number resistance level and clusters of institutional price targets, the zone becomes self-reinforcing. Repeated failures to clear it would signal the current range has more staying power than bulls expect.
Why a breakout above $4,500 would not be a slow grind
Commodity Trading Advisors (CTAs), systematic funds that use algorithmic rules to enter and exit positions, cluster their buy triggers just above key resistance levels. TD Securities’ analytical framework estimates these triggers sit near $4,468 in the current setup.
Once a confirmed close above the zone activates those triggers, mechanical buying stacks on top of discretionary buying. The move accelerates. A slow grind through resistance becomes a sharp, momentum-driven advance. This is why a confirmed breakout above $4,500, specifically a strong daily close on high volume, would look very different from the price action leading up to it.
The dynamic cuts both ways. Failed breakouts with heavy CTA involvement can produce equally sharp reversals when systematic longs are stopped out.
How the Federal Reserve is capping gold’s ceiling right now
The transmission chain from an inflation print to a gold price response runs through real yields, and tracing it step by step explains why the Fed’s stance, not the economy’s health, is the binding constraint right now.
- A tame CPI print lands, reducing the market-implied probability of a rate hike
- Lower hike odds compress real yields (the return on government bonds after adjusting for inflation)
- Softer real yields reduce the opportunity cost of holding gold, which pays no interest
- Gold advances toward resistance
The mechanism works in reverse with equal force. Any re-emergence of rate hike probability pushes real yields higher and puts a ceiling on how far gold can advance before institutional positioning turns defensive. Gold is not being capped by pessimism about the economy. It is being capped by residual probability, even a tail risk, of one more rate hike.
That distinction matters because it tells you the catalyst is a policy signal, not an economic turning point.
Peter Cardillo at Spartan Capital expects gold to surpass $4,500 and potentially achieve new all-time highs by year-end, but that view is explicitly contingent on inflation remaining benign enough to keep the Fed on hold.
Bart Melek at TD Securities frames $5,000/oz as realistic but premature, contingent on no new inflationary pressures. Gold will hover near the range top, in his view, until clearer confirmation arrives that the tightening cycle is finished.
The communications to track are Fed minutes, Chair Warsh speeches, dot-plot changes, and OIS/futures pricing for the next two meetings. These are the leading indicators. CPI is the confirming data.
The FOMC meeting minutes from the October 2025 policy session document how Committee members framed the balance between residual inflation risk and the case for holding rates, the same deliberative tension that currently determines where real yields settle and, by extension, where gold finds its ceiling.
Why oil prices are the variable most likely to break the current equilibrium
The gold-Fed narrative has an external circuit-breaker, and it runs through energy prices. Oil is not background noise in this setup. It is the variable most capable of flipping the inflation story and, with it, the Fed’s posture.
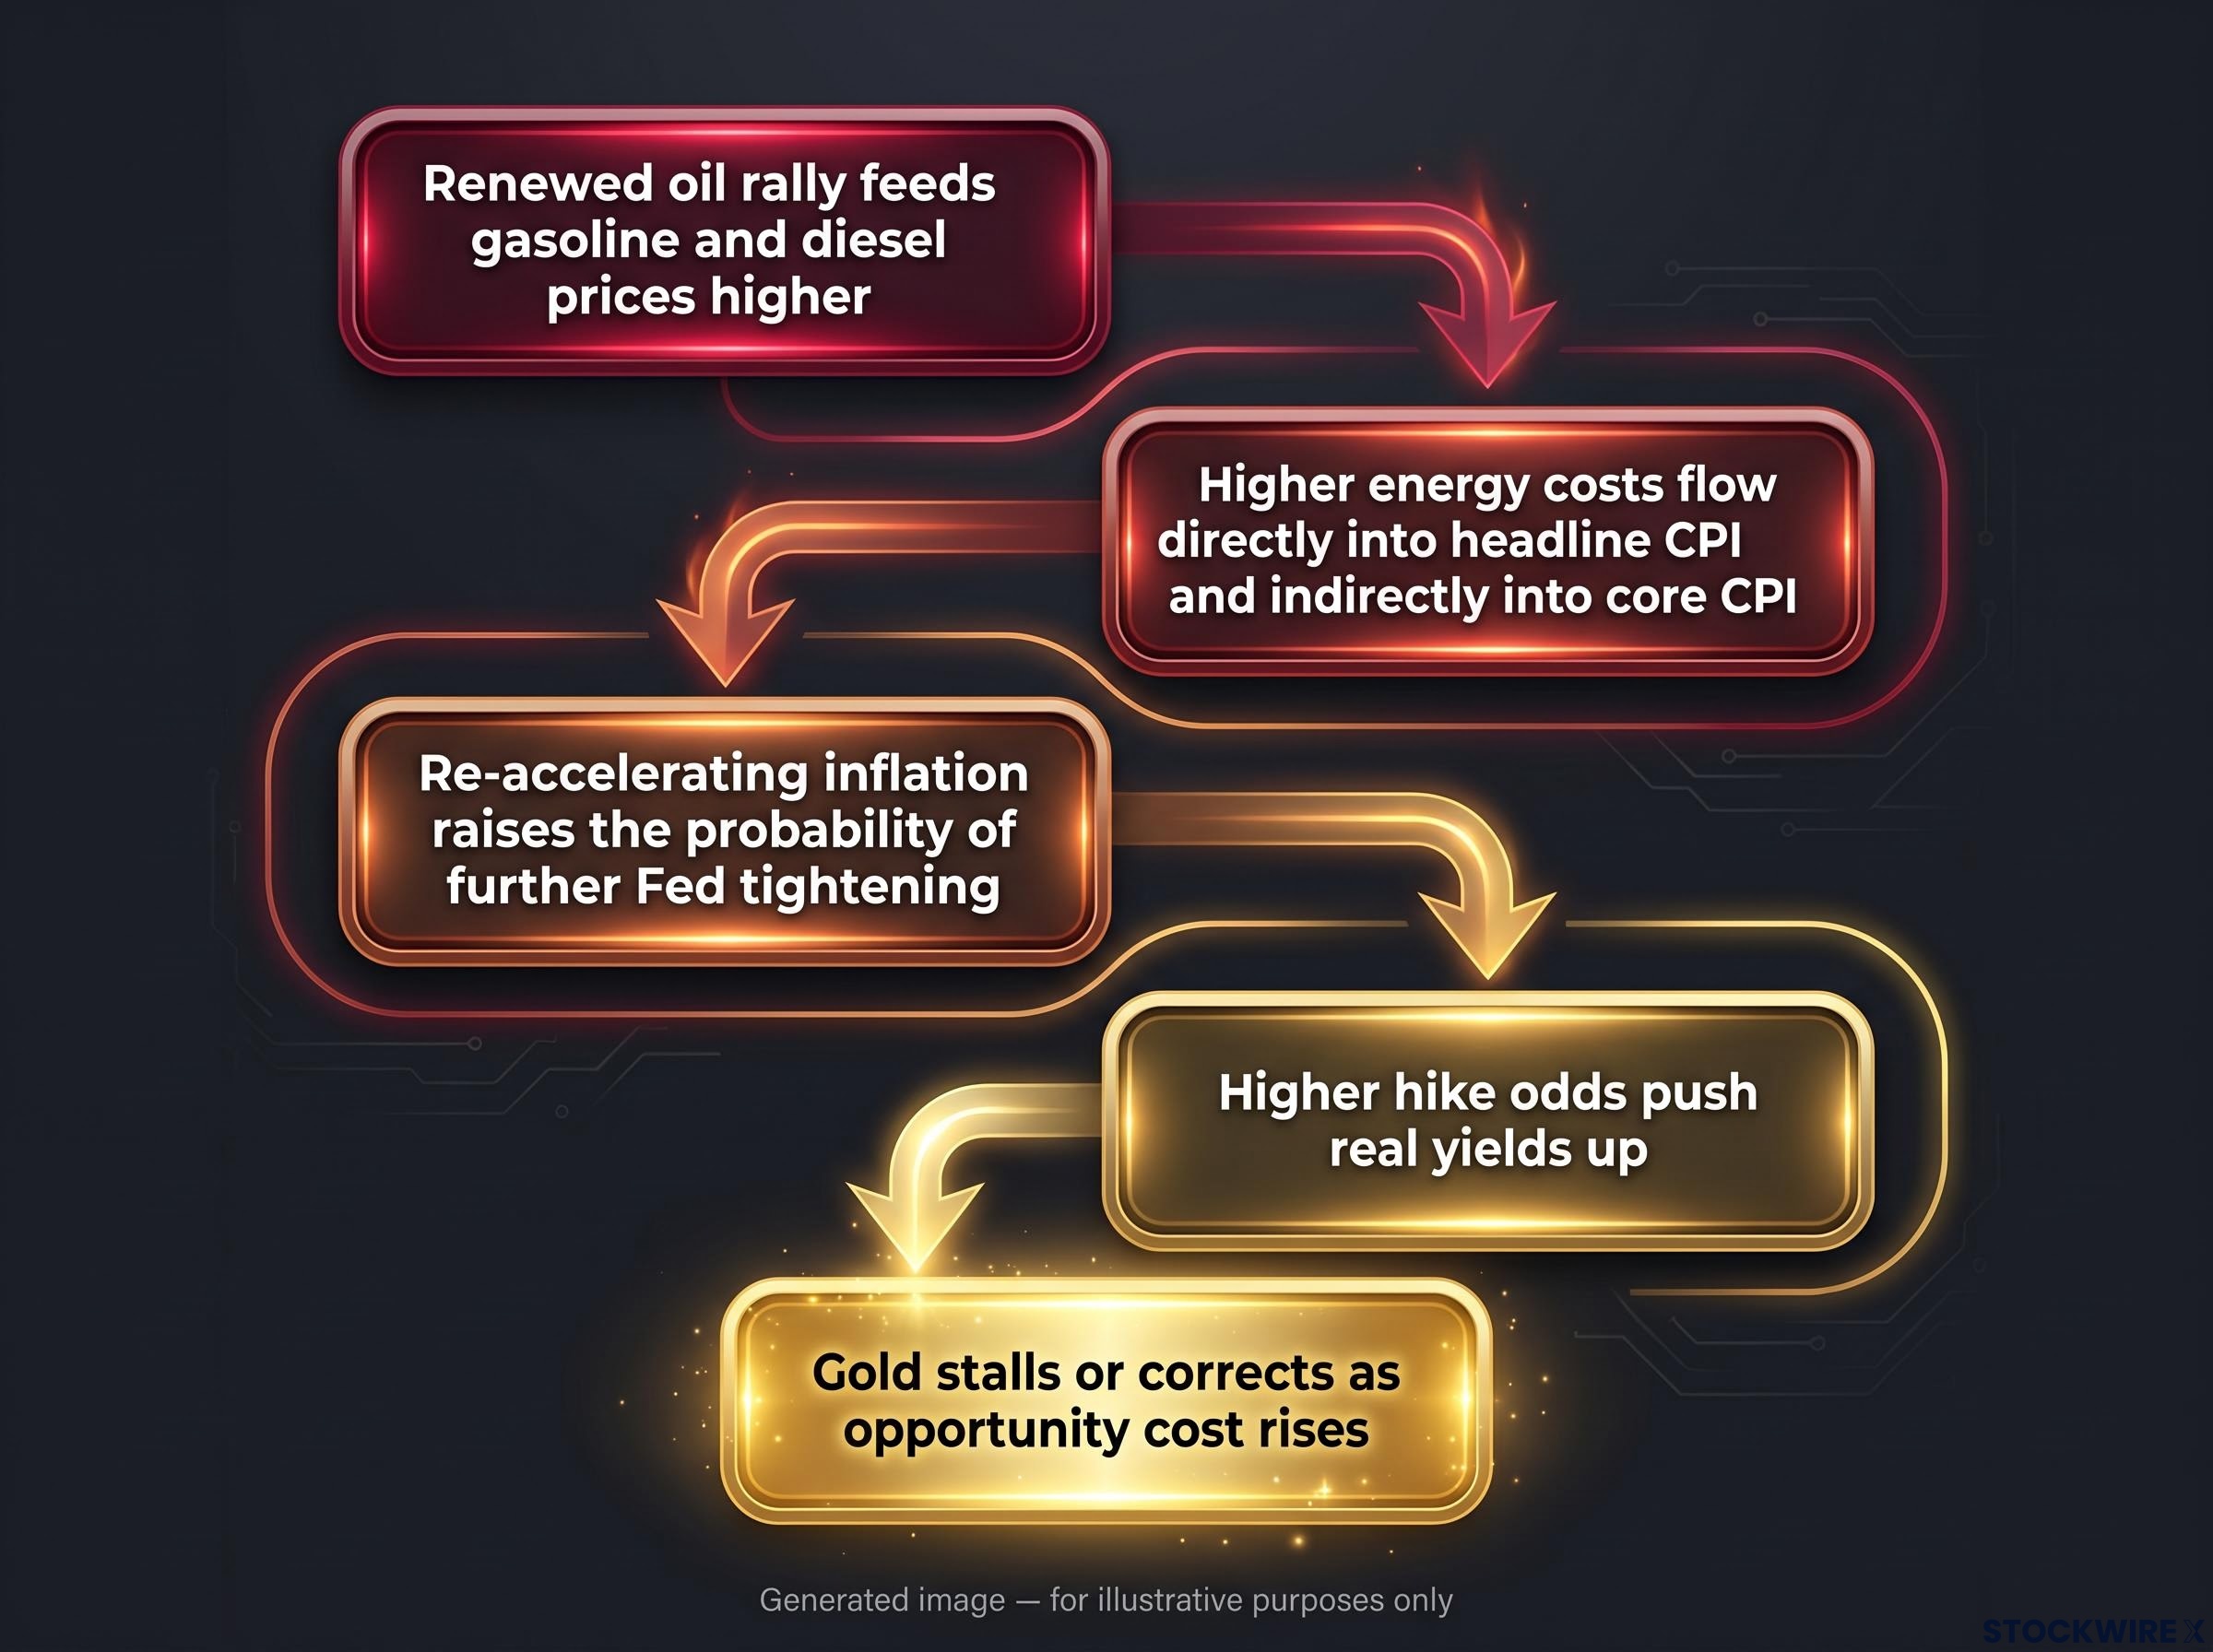
The causal chain is direct:
- A renewed oil rally feeds gasoline and diesel prices higher
- Higher energy costs flow directly into headline CPI and indirectly into core CPI via transportation and input costs
- Re-accelerating inflation raises the probability of further Fed tightening
- Higher hike odds push real yields up
- Gold stalls or corrects as the opportunity cost of holding it rises
The indirect transmission channel, where elevated energy costs flow through logistics, agriculture, and manufacturing over a 6-12 month lag, means the full inflationary impact of any sustained oil move has not yet appeared in CPI by the time gold markets are already repricing Fed risk.
The geopolitical triggers that could ignite this chain are specific: Middle East tensions and OPEC supply decisions. These are the primary ignition sources for sharp oil moves.
Even when an energy-driven inflation resurgence is only a tail risk, institutional investors must price it. That constraint limits how aggressively funds will build large unhedged long positions just below $4,500.
An oil shock does not need to be large to matter for gold. It only needs to be large enough to shift the market’s probability estimate for the next Fed meeting. Tracking energy prices gives you an early warning signal for gold’s policy backdrop, ahead of the CPI print that would confirm it.
What would actually need to happen for gold to reach $5,000
The $5,000 question is worth answering rigorously, because the answer is not a forecast but a set of conditions the reader can track against incoming data.
Public bank forecasts for 2026 cluster mostly in the $4,000-$4,900 range, with meaningful disagreement on where within that band gold settles:
| Institution | 2026 Target | Key Assumption |
|---|---|---|
| HSBC | $4,560/oz (year-end ~$4,750) | Cautious stance; lowered from prior forecasts |
| StoneX | ~$4,000/oz | Conservative; reflects risk of tighter policy persisting |
| TD Securities (Melek) | $5,000 scenario | Realistic but premature; requires no new inflationary pressures |
| Spartan Capital (Cardillo) | New all-time highs by year-end | Contingent on inflation remaining benign and Fed staying on hold |
The spread between StoneX near $4,000 and the more bullish projections above $5,000 tells you that $5,000 is a plausible destination under a specific macro path, not a target to position for blindly. The checklist of conditions is what lets you assess where that path currently stands.
The central bank demand floor, with a record 45% of reserve managers planning to increase official gold holdings over the next 12 months, provides structural support that separates the current trading range from the cyclical corrections of prior tightening cycles.
The four conditions that would make $5,000 a realistic target
- Inflation contained but not collapsing: Multiple consecutive CPI prints with falling core and stable headline, soft enough to rule out new hikes without triggering deflation concerns.
- Clear consensus that the tightening cycle is over: Fed communications consistently signalling “mission accomplished” on inflation, with futures and OIS curves pricing essentially zero probability of further hikes.
- Declining real yields with a softer dollar: The macro regime historically associated with sustained gold rallies; forecasts above $4,500 implicitly assume this backdrop.
- Confirmed technical breakout: A decisive close above $4,500, above the 200-day moving average near $4,495, on high volume, triggering CTA and momentum buying.
These conditions are interdependent. The technical breakout only becomes durable if the macro conditions underpin it, and the macro conditions only produce sustained price gains if the technical structure confirms institutional accumulation.
What to watch before making a call on gold’s next move
The analytical work above converts into a three-track monitoring framework. Rather than reacting to gold’s price after the move, these are the inputs that tell you the move is forming.
Inflation prints
Each CPI release is now a high-impact binary event for gold. The pattern is consistent: soft-to-tame prints compress hike odds and push gold toward the $4,300-$4,400 resistance zone. Hotter-than-expected prints raise hike odds and pull gold back toward $4,000 or below. Watch the direction and the surprise element, not the absolute level.
Fed communications
Fed minutes and Chair Warsh speeches are the most information-dense signals. Any re-emergence of hawkish language can reset expectations quickly. Track OIS and futures pricing for the next two meetings as the most real-time gauge of where the market stands on hike probability.
Energy and geopolitics
Oil shocks driven by Middle East tensions or OPEC supply decisions are the primary external variable not captured by CPI data alone. They function as an early warning system for the inflation narrative. A sharp move in oil changes the gold story before the next CPI print can confirm it.
Having a pre-defined set of signals to watch means you can interpret events in real time rather than reacting to price moves after the thesis has already played out.
The breakout that changes the picture, and what stands between gold and it now
Gold’s ceiling is a policy ceiling, not an economic one. The catalyst for removing it is a credible signal from the Fed that the tightening cycle is definitively finished, not simply another in-line CPI print that leaves the question unresolved.
The technical and macro conditions are constructive but incomplete. Gold is grinding toward resistance on declining inflation, softening real yields, and steady institutional interest. The next data point to arrive, whether it is a CPI print, a set of Fed minutes, or an oil supply disruption, could tighten or loosen the range.
The question worth tracking is not “will gold hit $5,000” but “what would have to be true for it to, and how far along is that path.” The conditions outlined here give you a framework for answering that in real time.
For investors wanting to stress-test the conditions framework above against gold’s actual track record across prior rate cycles, our full explainer on gold price prediction failures examines three documented cycles where macro signals pointed clearly in one direction and gold moved the other way.
This article is for informational purposes only and should not be considered financial advice. Investors should conduct their own research and consult with financial professionals before making investment decisions. All projections referenced are forward-looking and subject to market conditions and various risk factors. Past performance does not guarantee future results.