A hedge relationship that once carried a 31% R-squared against the broader market now explains almost nothing about Apple. For QQQ specifically, that explanatory power has collapsed to roughly 2-3%, according to the original analysis behind these figures.
A precision instrument has turned into noise.
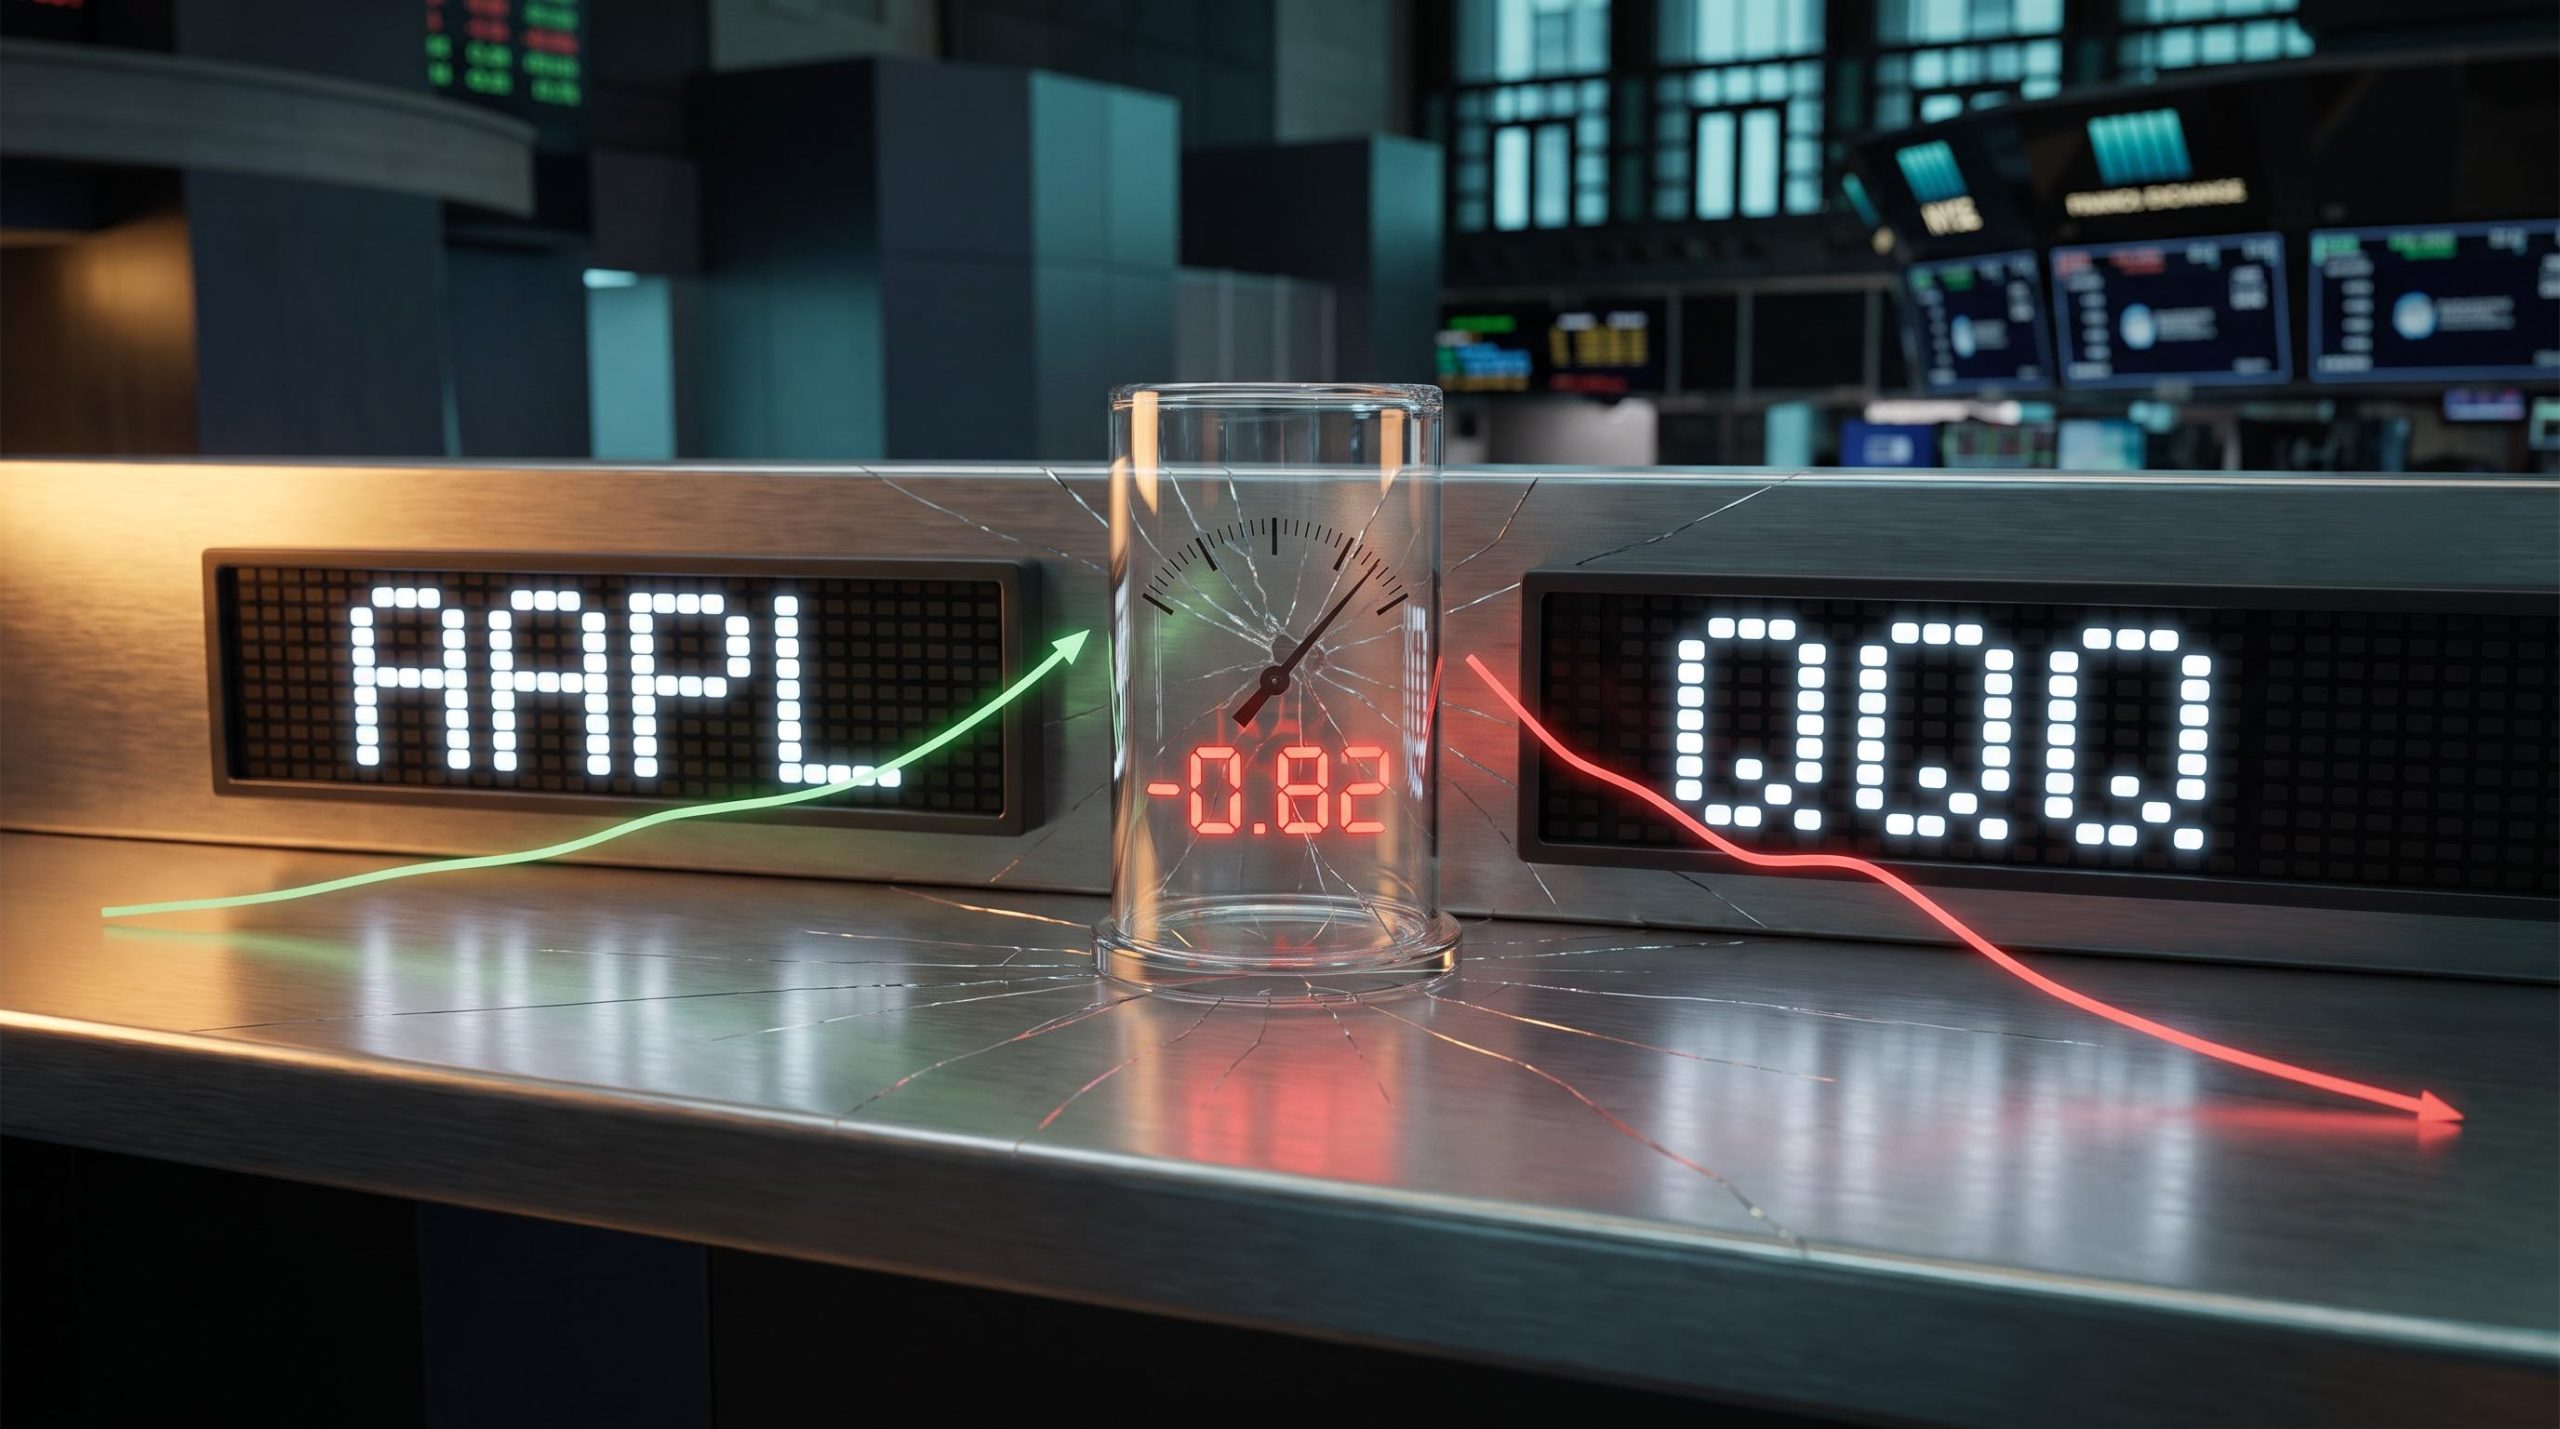
This matters right now because, as of early September 2026, Apple’s 30-day correlation to the Nasdaq-100 has swung to -0.82, the most inversely correlated the stock has been to its tech peers in roughly two decades. If you built your hedging discipline over years of a stable, high-beta relationship between Apple and the Nasdaq-100, you are working from a map that no longer matches the ground beneath it.
Here is what the data actually tells you about where hedging Apple with QQQ breaks down mechanically. You will see exactly where the relationship fails, what the over-hedging threshold means for your specific position sizing, and which instruments now offer cleaner, Apple-specific protection. Treat this as a recalibration of assumptions, not an abstract tour of concepts.
How the AAPL-QQQ relationship worked when it worked
For most of the last two decades, using QQQ to hedge Apple was a defensible call, and the numbers behind it were genuinely solid. This is the baseline you probably trusted without examining too closely.
Three figures anchored that trust:
- Long-term beta versus QQQ of 1.08, measured across roughly 22 years from 2004
- An average correlation of 0.56, as reported by DataTrek Research on 7 October 2019
- An R-squared against index products in the 30-50% range before the breakdown
Each of these numbers did real work. Beta of 1.08 meant Apple moved slightly more than the Nasdaq-100 but broadly in step with it, so shorting QQQ against a long Apple position offset a predictable share of the risk.
The R-squared figure is where the instrument earned its keep. An R-squared of 31% against the broader market, per DataTrek’s 2019 data, meant roughly a third of Apple’s daily moves could be systematically explained, and therefore offset, by an opposing index position. That is genuine noise-reduction, not wishful thinking.
Out of that stable relationship came a practical output: the historically derived optimal hedge ratio.
The historical hedge ratio Approximately 38 shares of QQQ per 100 shares of Apple was the calibrated optimum, a mathematically derived figure produced by the beta near 1.08 and the correlation levels that prevailed for years.
The point to hold onto is that the 38-share ratio was never arbitrary. It was the output of a relationship that actually existed. That is exactly why its breakdown, which the next section walks through, is a structural loss rather than a minor data update.
When big ASX news breaks, our subscribers know first
Reading the collapse: what rolling beta and R-squared data actually show
Watch what happens to the numbers as the measurement window shortens, because the pattern tells its own story before anyone has to draw a conclusion for you.
Start with rolling beta. Against QQQ, it has decayed step by step from the historical average of 1.08, moving through roughly 1.0, then 0.86, 0.71, 0.32, and toward 0.19 in the original analysis. Quant site Convextrade, dating its work to 22 July 2026, puts the regression-based beta higher at 0.42.
Do not read the gap between 0.19 and 0.42 as a contradiction. It reflects different measurement windows and dates. Both point in the same direction: a severe fall from the 1.08 baseline that made the old hedge ratio work.
Now the correlations, which compress dramatically as the window tightens.
| Measurement window | Correlation vs index | Implied R-squared | Source / date |
|---|---|---|---|
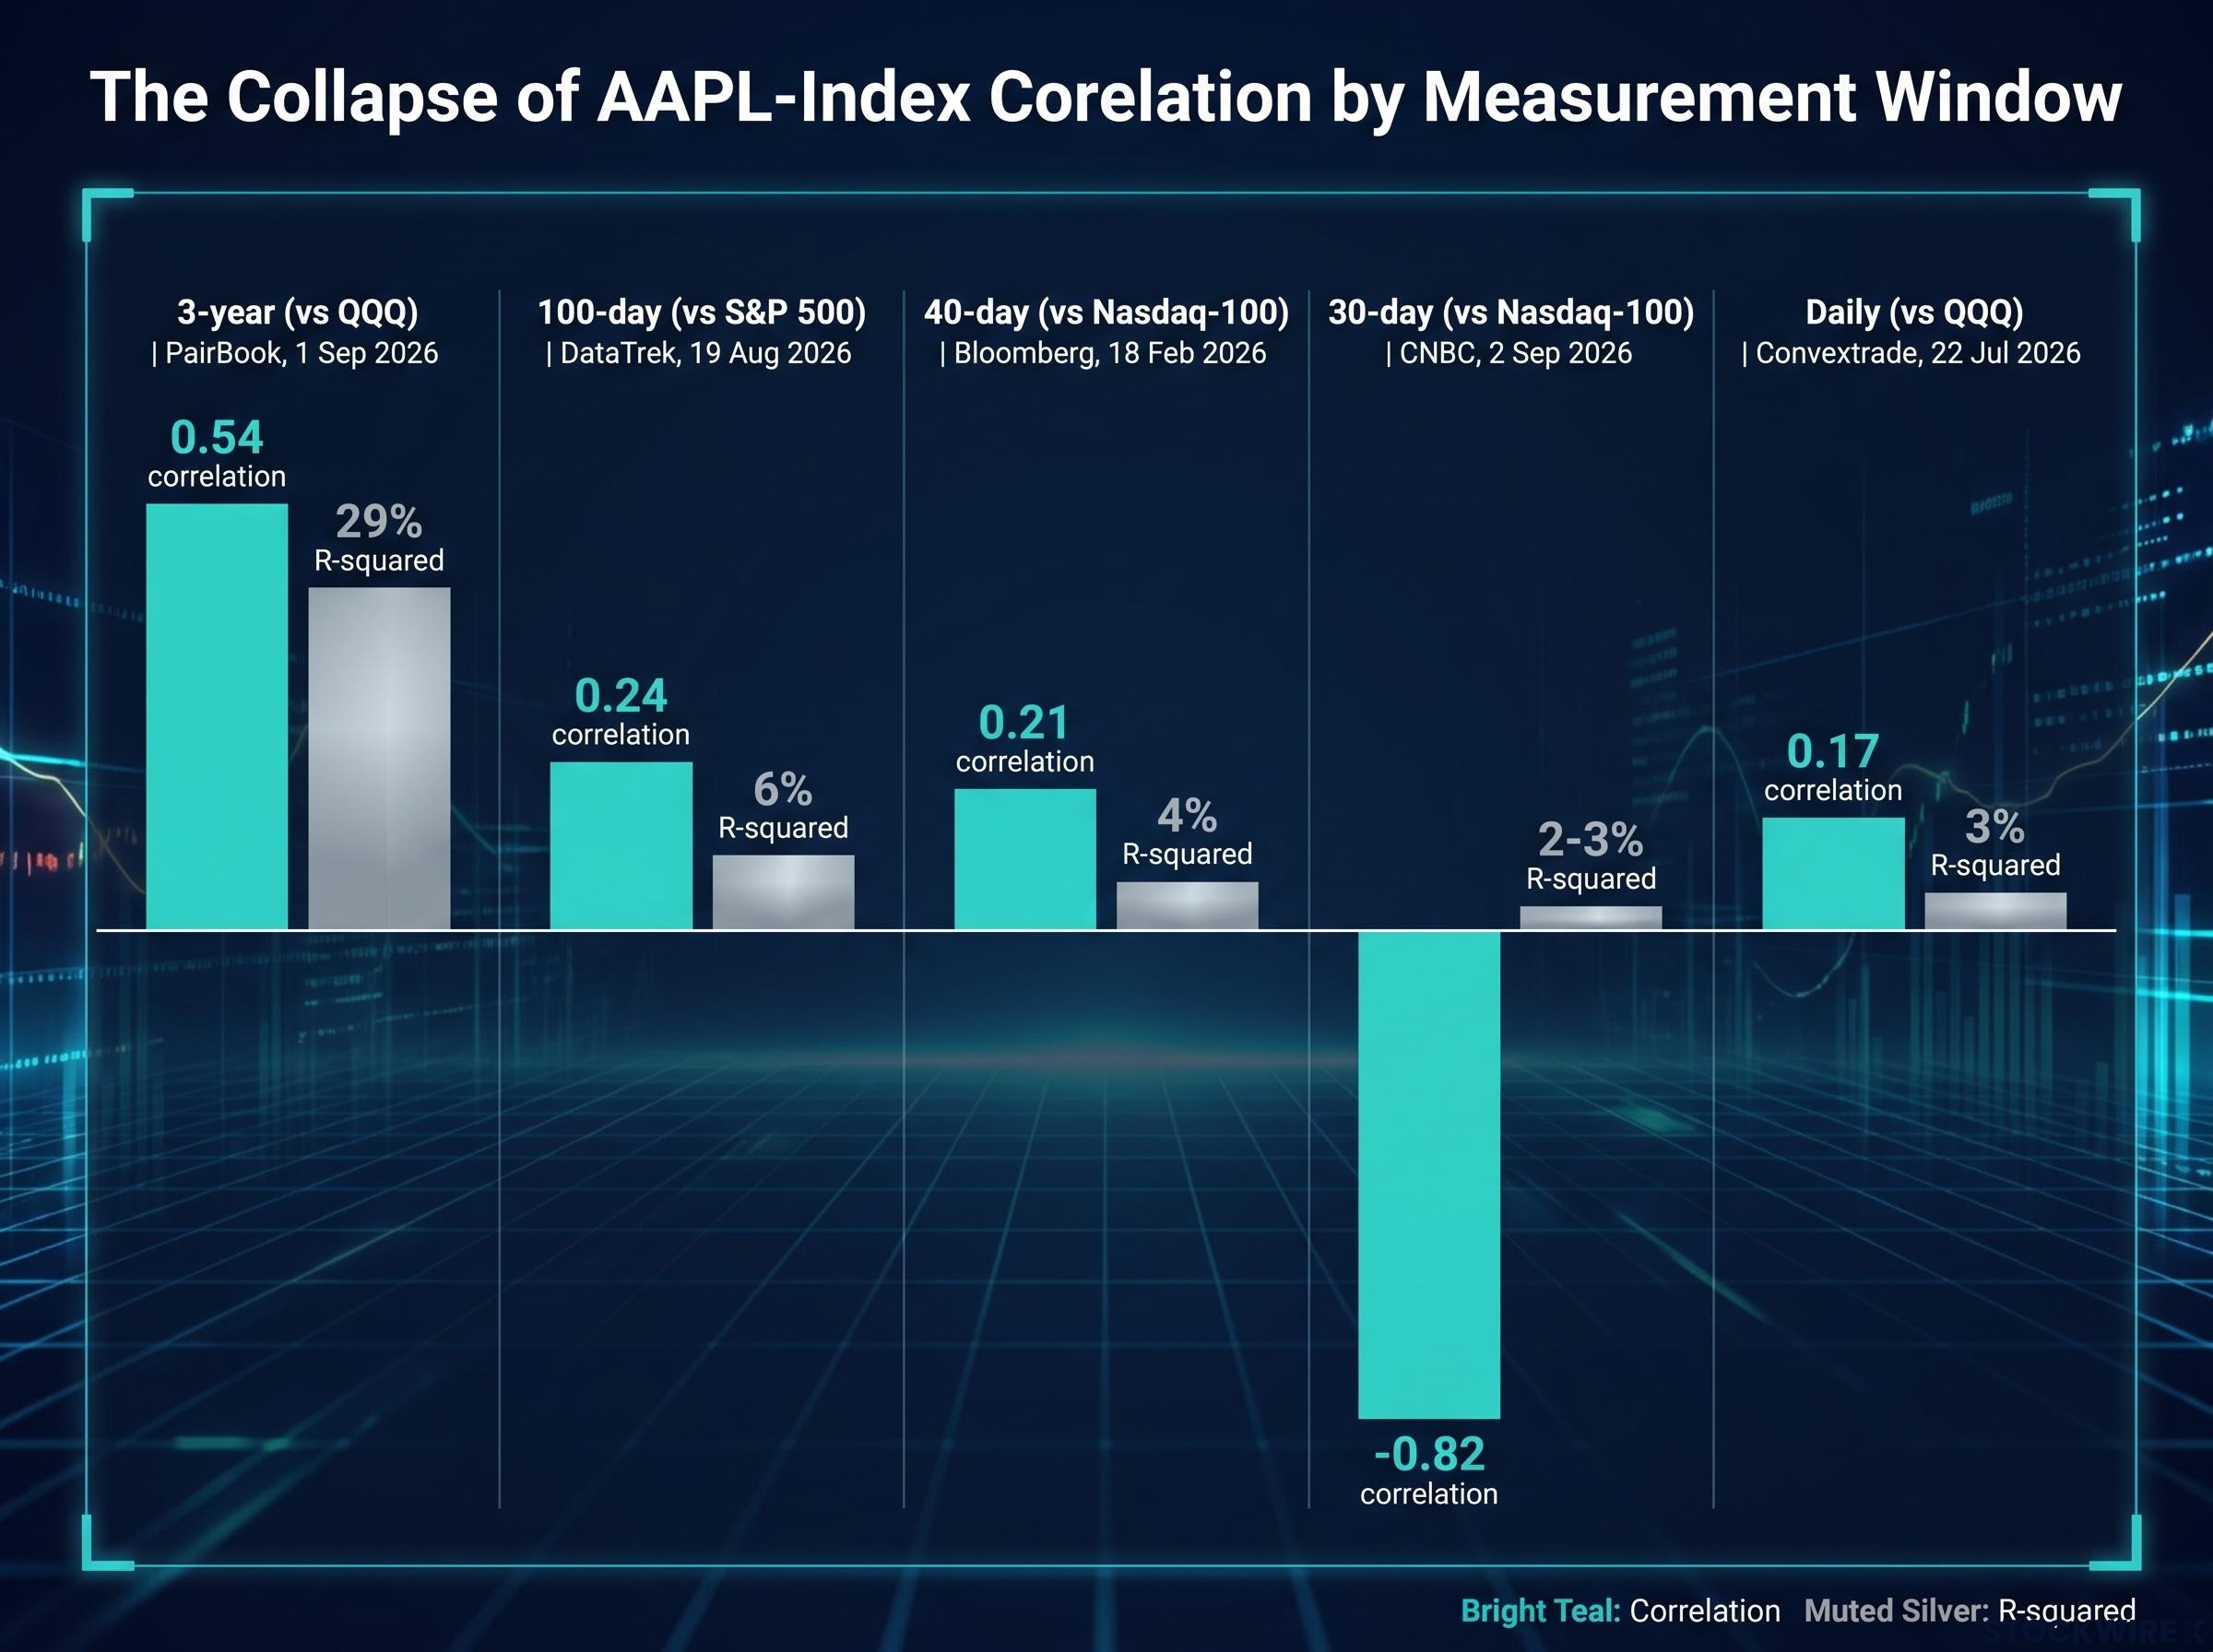
| 3-year (vs QQQ) | 0.54 | ~29% | PairBook, 1 Sep 2026 |
| 100-day (vs S&P 500) | 0.24 | ~6% | DataTrek, 19 Aug 2026 |
| 40-day (vs Nasdaq-100) | 0.21 | ~4% | Bloomberg, 18 Feb 2026 |
| 30-day (vs Nasdaq-100) | -0.82 | ~2-3% (QQQ) | CNBC, 2 Sep 2026 |
| Daily frequency (vs QQQ) | 0.17 | ~3% | Convextrade, 22 Jul 2026 |
The sequence is the whole point. On a 3-year window the relationship looks recoverable at 0.54. Shorten to 100 days and it falls to 0.24. Shorten again to 30 days and it flips negative.
The single sharpest illustration Bloomberg reported on 18 February 2026 that Apple’s 40-day correlation to the Nasdaq-100 had fallen to 0.21, the lowest since 2006 and down from 0.92 in May 2025. That is a collapse from near-perfect co-movement to almost none in roughly nine months.
Convert those short-window figures into explanatory power and the picture sharpens further. The 0.24 correlation from DataTrek implies an R-squared of about 6%, meaning broad market moves explain only around 6% of Apple’s returns. For QQQ specifically, the original analysis puts R-squared at just 2-3%.
Here is what that means for you directly. A hedge you recalibrate on 3-year data still looks plausible, but one calibrated on the 30-day window is not simply weaker. At -0.82, QQQ has become a source of active basis risk, capable of moving against your Apple position in the same direction rather than offsetting it.
Why Apple and the Nasdaq-100 stopped moving together
None of this is random noise. The decoupling has coherent, identifiable drivers, and they interlock into something closer to a regime shift than a measurement quirk.
Three forces are doing the work:
- AI capex bifurcation: Apple largely sat out the AI infrastructure arms race while the Nasdaq-100 became concentrated in high-beta AI and semiconductor names
- Quality-factor rotation: Investors are treating Apple as a defensive quality holding, rotating into it out of high-multiple growth names
- Idiosyncratic factor dominance: Company-specific factors now drive the overwhelming share of Apple’s returns
Take the capex split first. Bloomberg attributes much of the decoupling to Apple’s choice to stay out of the AI spending race, positioning it as an outlier against peers like Nvidia, Microsoft, and Alphabet that are pouring capital into AI infrastructure.
Nvidia sits as the largest or near-largest weight in QQQ and is heavily levered to AI infrastructure cycles. When index performance is increasingly set by one or two extreme high-beta leaders, Apple’s steadier earnings profile makes its stock moves less representative of the index, mechanically weakening the correlation even though Apple remains a large absolute weight.
When Apple rallies as the Nasdaq-100 falls
The rotation shows up plainly in price action. Documented sessions show Apple gaining 4-4.5% while the Nasdaq-100 dropped more than 1.5%, as investors pulled out of high-multiple growth stocks and into mega-cap quality names like Apple.
Semafor, on 18 February 2026, described Apple as “dodging the AI-fueled anxiety roiling the industry.” That defensive positioning is structurally opposed to the index rather than aligned with it.
Every one of those sessions registers as a negative correlation contribution, dragging the rolling figure toward zero and then below. That mechanical accumulation is how a 40-day reading falls from 0.92 to 0.21 and a 30-day reading reaches -0.82.
The third force compounds the first two. DataTrek’s data implies that roughly 94% of Apple’s recent returns are idiosyncratic, driven by company-specific factors rather than broad market moves, derived from the 6% R-squared reading.
Here is the consequence for you. If 94% of Apple’s returns are company-specific, your Apple position is now almost entirely a stock-picking bet, not a market-exposure bet. That changes what kind of hedge makes any sense, because you cannot hedge a stock-specific risk with a broad index that no longer tracks the stock.
The over-hedging threshold and why the 38-share ratio now works against you
There is a specific line in the sand here, and if you are still running a QQQ hedge on old assumptions, you have very likely already crossed it.
The over-hedging threshold, per the original analysis, is approximately 27.4 shares of QQQ per 100 shares of Apple. This is the residual realised volatility boundary: above this share count, the hedge increases your overall position volatility rather than reducing it.
Realised volatility is simply how much the position actually moved, measured after the fact. Above the threshold, the hedge stops smoothing that movement and starts adding to it.
Follow the arithmetic:
- The historical optimal ratio was calibrated on beta near 1.08, producing roughly 38 shares of QQQ per 100 Apple shares
- The over-hedging threshold sits lower, at approximately 27.4 shares
- Current rolling beta has collapsed into the 0.19-0.42 range
- A hedge still sized near 38 shares, or even one recalibrated six months ago, sits well above 27.4
- The gap between historical sizing and the threshold is your over-hedging exposure
The threshold that flips protection into harm Approximately 27.4 shares of QQQ per 100 shares of Apple is the point at which the hedge stops protecting you and starts adding volatility. Anything above it is working against the position it was meant to defend.
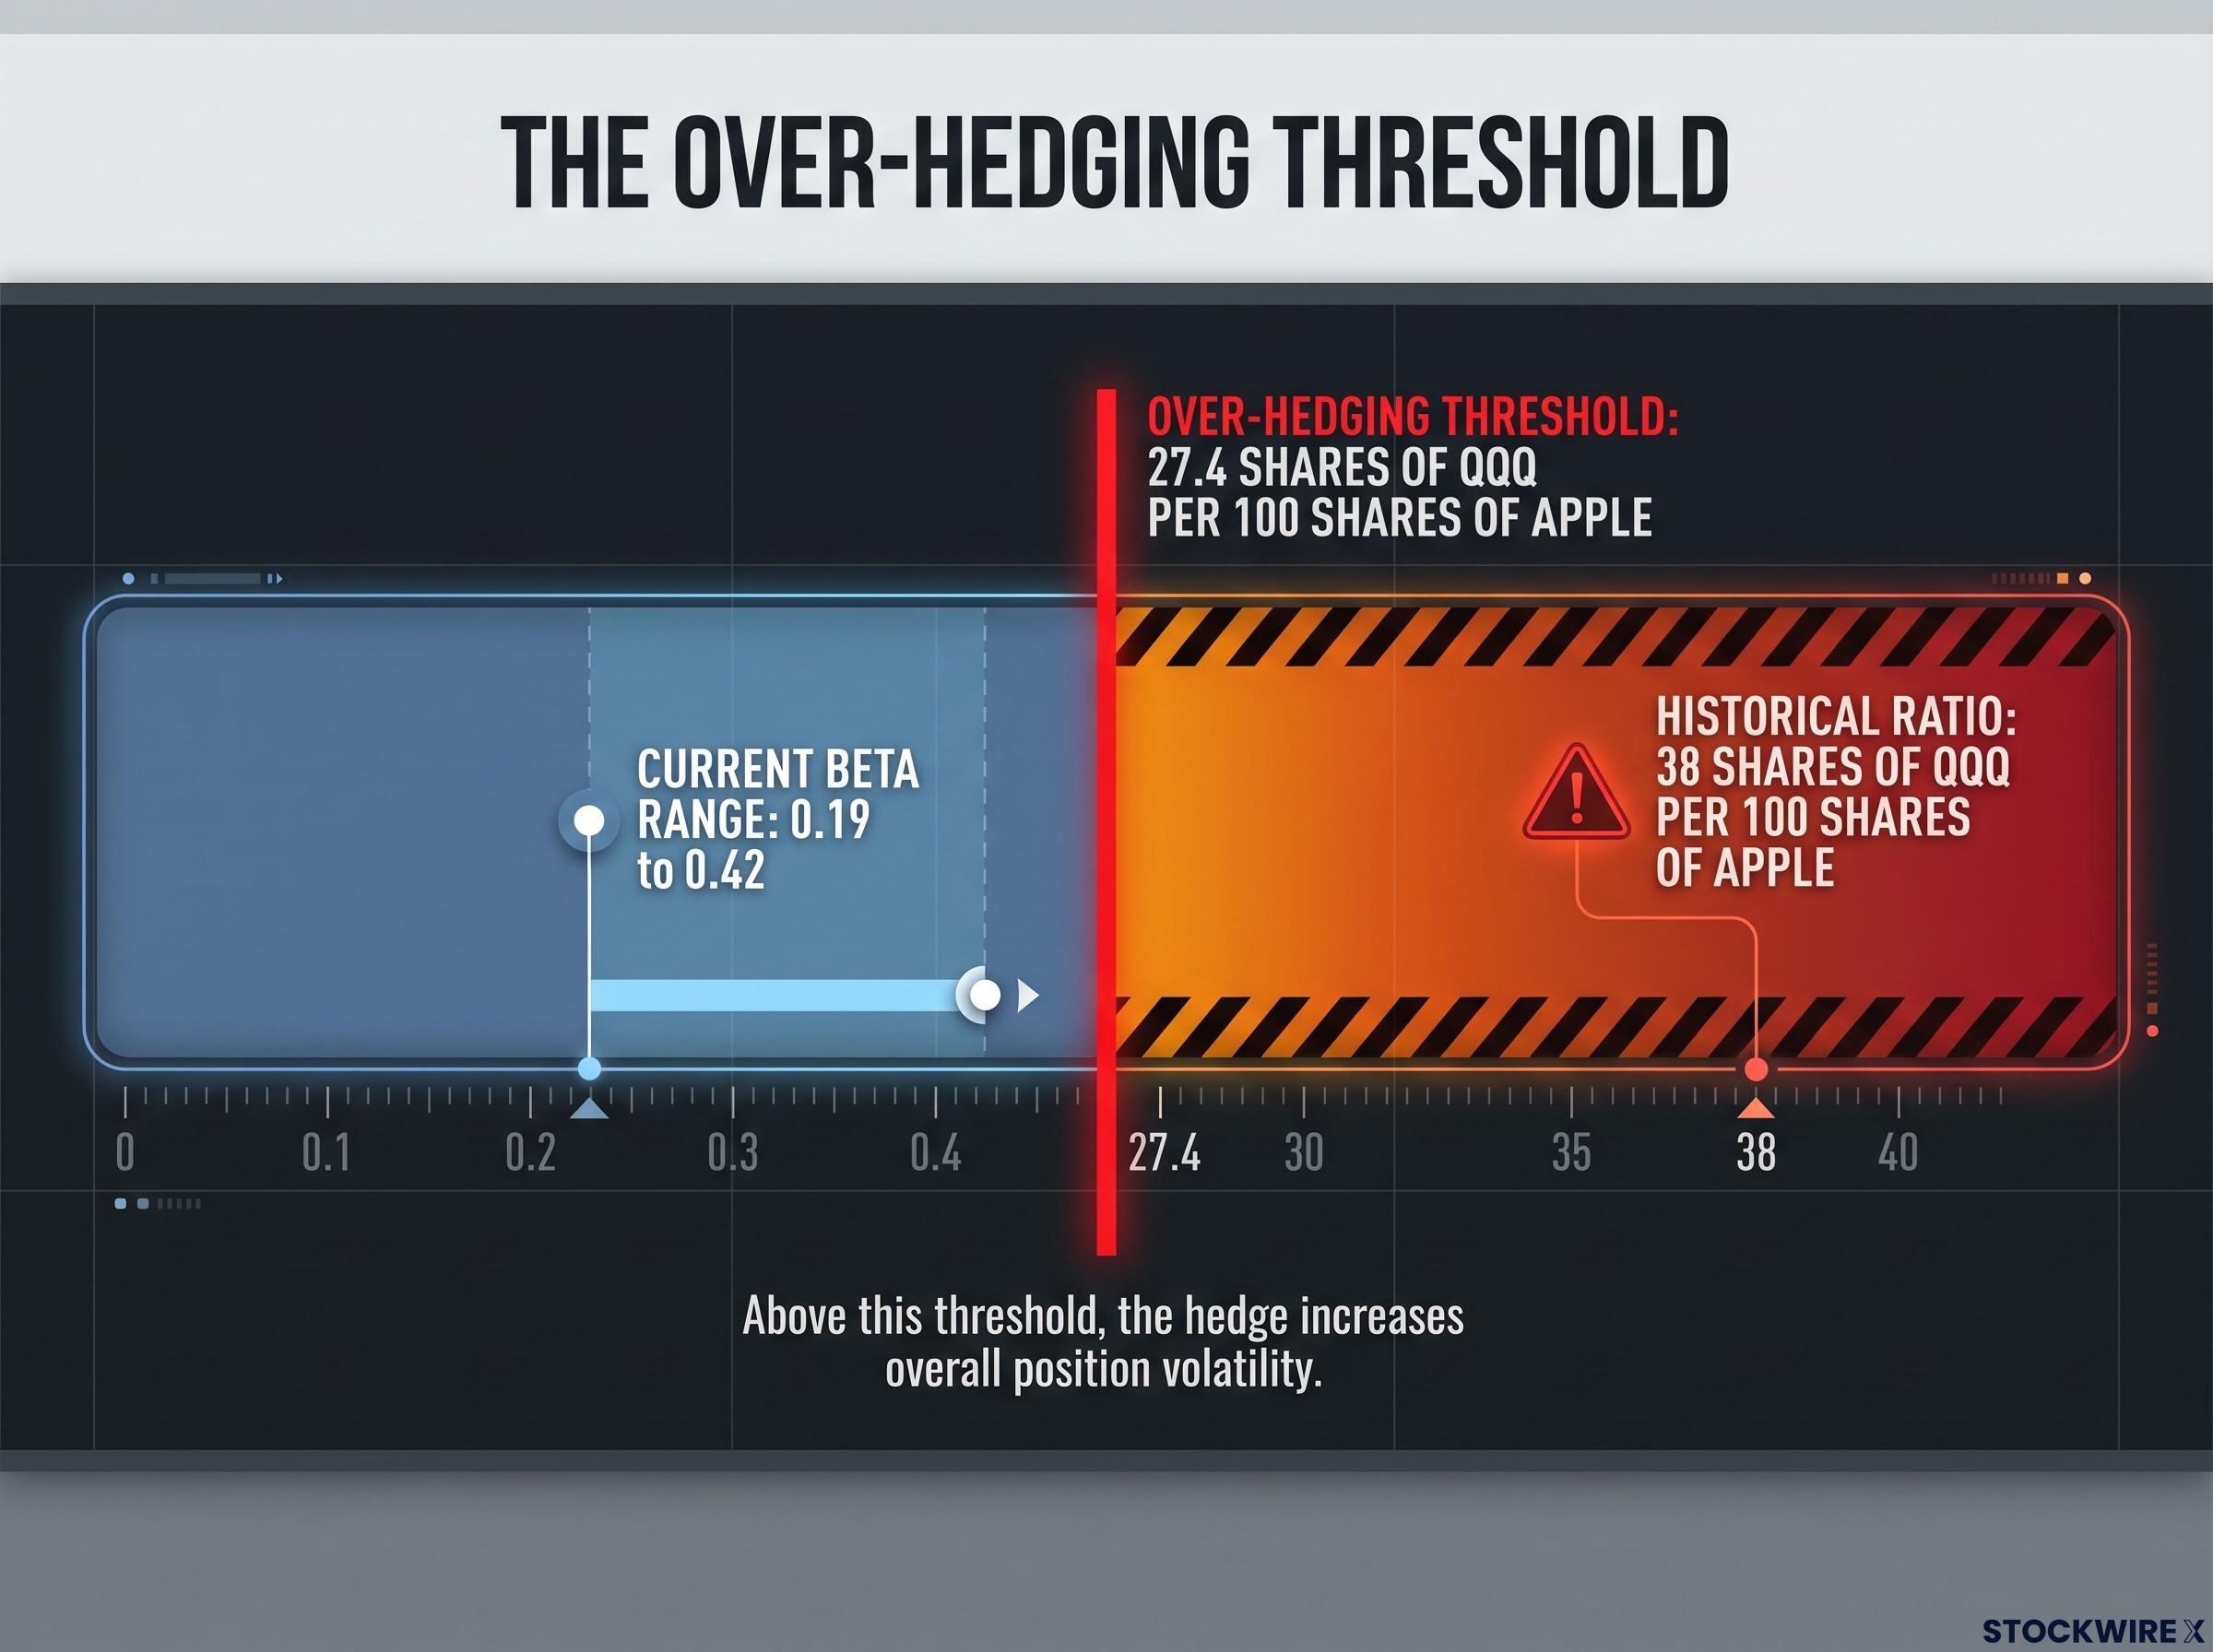
Mechanically, the damage plays out like this. With beta near 0.42, shorting QQQ as though beta were near 1 means your hedge notional far exceeds Apple’s actual systematic exposure.
So when the Nasdaq-100 sells off on its AI and high-beta components, the oversized QQQ short loses money even if Apple holds steady. The hedge becomes an independent source of drawdown rather than an offset.
The read for you is direct. If your QQQ-based Apple hedge is calibrated on beta assumptions from 2024 or earlier, the current data suggest you are almost certainly in over-hedging territory, adding volatility to a position you believe you are protecting.
What actually hedges Apple now, and how to think about the options surface
If the index proxy has failed, the cleaner replacement references Apple directly rather than a broken cross-asset relationship. Single-stock options on Apple are the primary candidate.
Protective puts and collars give you delta exposure to Apple’s own volatility surface. A protective put sets a floor under your holding while keeping the upside; a collar pairs that put with a sold call to lower the net premium in exchange for a capped upside. Both reference Apple’s actual implied volatility, not QQQ’s now-disconnected moves.
The current options environment makes the timing favourable. As of 11 September 2026, three analytics platforms put Apple’s 30-day at-the-money implied volatility in a consistent band:
- 24.2% with an IV rank of about 24 on a 0-100 scale (OptiView)
- 23.5% with a 1-year IV percentile near 60% (ApexVol)
- 24.04% (OptionCharts)
For wider context, the VIX averaged 15-16 near the analysis date, below its long-term median.
The gap between the IV rank of 24 and the 1-year percentile near 60% is worth reading carefully. An IV rank of 24 tells you Apple options are not expensive by historical standards, which matters for the decision to buy puts. The moment index hedges become unreliable is not necessarily the moment single-stock protection turns costly.
Structural tools for longer-term concentration risk
If your concentration horizon is measured in years rather than trades, and especially if you hold large embedded gains, a different toolkit applies:
- Exchange funds: Pool your concentrated Apple position with others into a diversified fund without triggering an immediate capital-gains event
- Gradual diversification: Sell Apple in tranches and reinvest across a broader portfolio over time
- Equity swaps and structured notes: Tailor a payoff profile that keeps Apple exposure while adding defined downside protection or income
- Charitable remainder trusts: Transfer Apple stock into a trust to generate income and defer or reduce capital-gains tax while diversifying
- Margin loans or securities-backed credit lines: Raise liquidity against Apple shares without selling them, complementing an options hedge
These structural approaches complement options rather than replace them. They address the concentration risk that a broken index hedge can no longer offset, and they are most relevant if you are tax-sensitive with a multi-year horizon.
What to do when your hedge model is built on a relationship that has stopped working
Pull the core diagnostic together and the signal is unambiguous. The 30-day correlation of -0.82, the R-squared collapse to 2-3% for QQQ, and the over-hedging threshold at 27.4 shares together mean QQQ-based Apple hedging has moved from imprecise to counter-productive under current conditions.
The synthesis in one line With QQQ’s R-squared against Apple at 2-3%, the instrument explains almost nothing about Apple’s daily moves right now. A hedge that explains almost nothing is not a hedge.
This is not a call to abandon hedging. It is a call to recalibrate, treating your correlation and beta figures as live inputs rather than fixed parameters. Work through the protocol:
- Measure your current QQQ hedge ratio against the 27.4-share threshold
- Pull the rolling 30-day and 40-day correlation figures, currently -0.82 and 0.21
- Derive current beta and recalculate your notional hedge size accordingly
- Check whether R-squared has fallen below 10%
- If it has, evaluate AAPL single-stock options as your primary hedge instrument
The cyclical-versus-structural debate does not need false resolution. The 3-year correlation of 0.54 versus QQQ shows the long-run relationship has not vanished and could revert. Until short-window correlation and beta recover, though, QQQ hedges carry basis risk and over-hedging risk that single-stock options do not.
Your first move is not choosing a replacement. It is checking your current ratio against the 27.4-share threshold to find out whether you are already over-hedged.
This article is for informational purposes only and should not be considered financial advice. Investors should conduct their own research and consult with financial professionals before making investment decisions. Past performance does not guarantee future results. Financial projections are subject to market conditions and various risk factors.