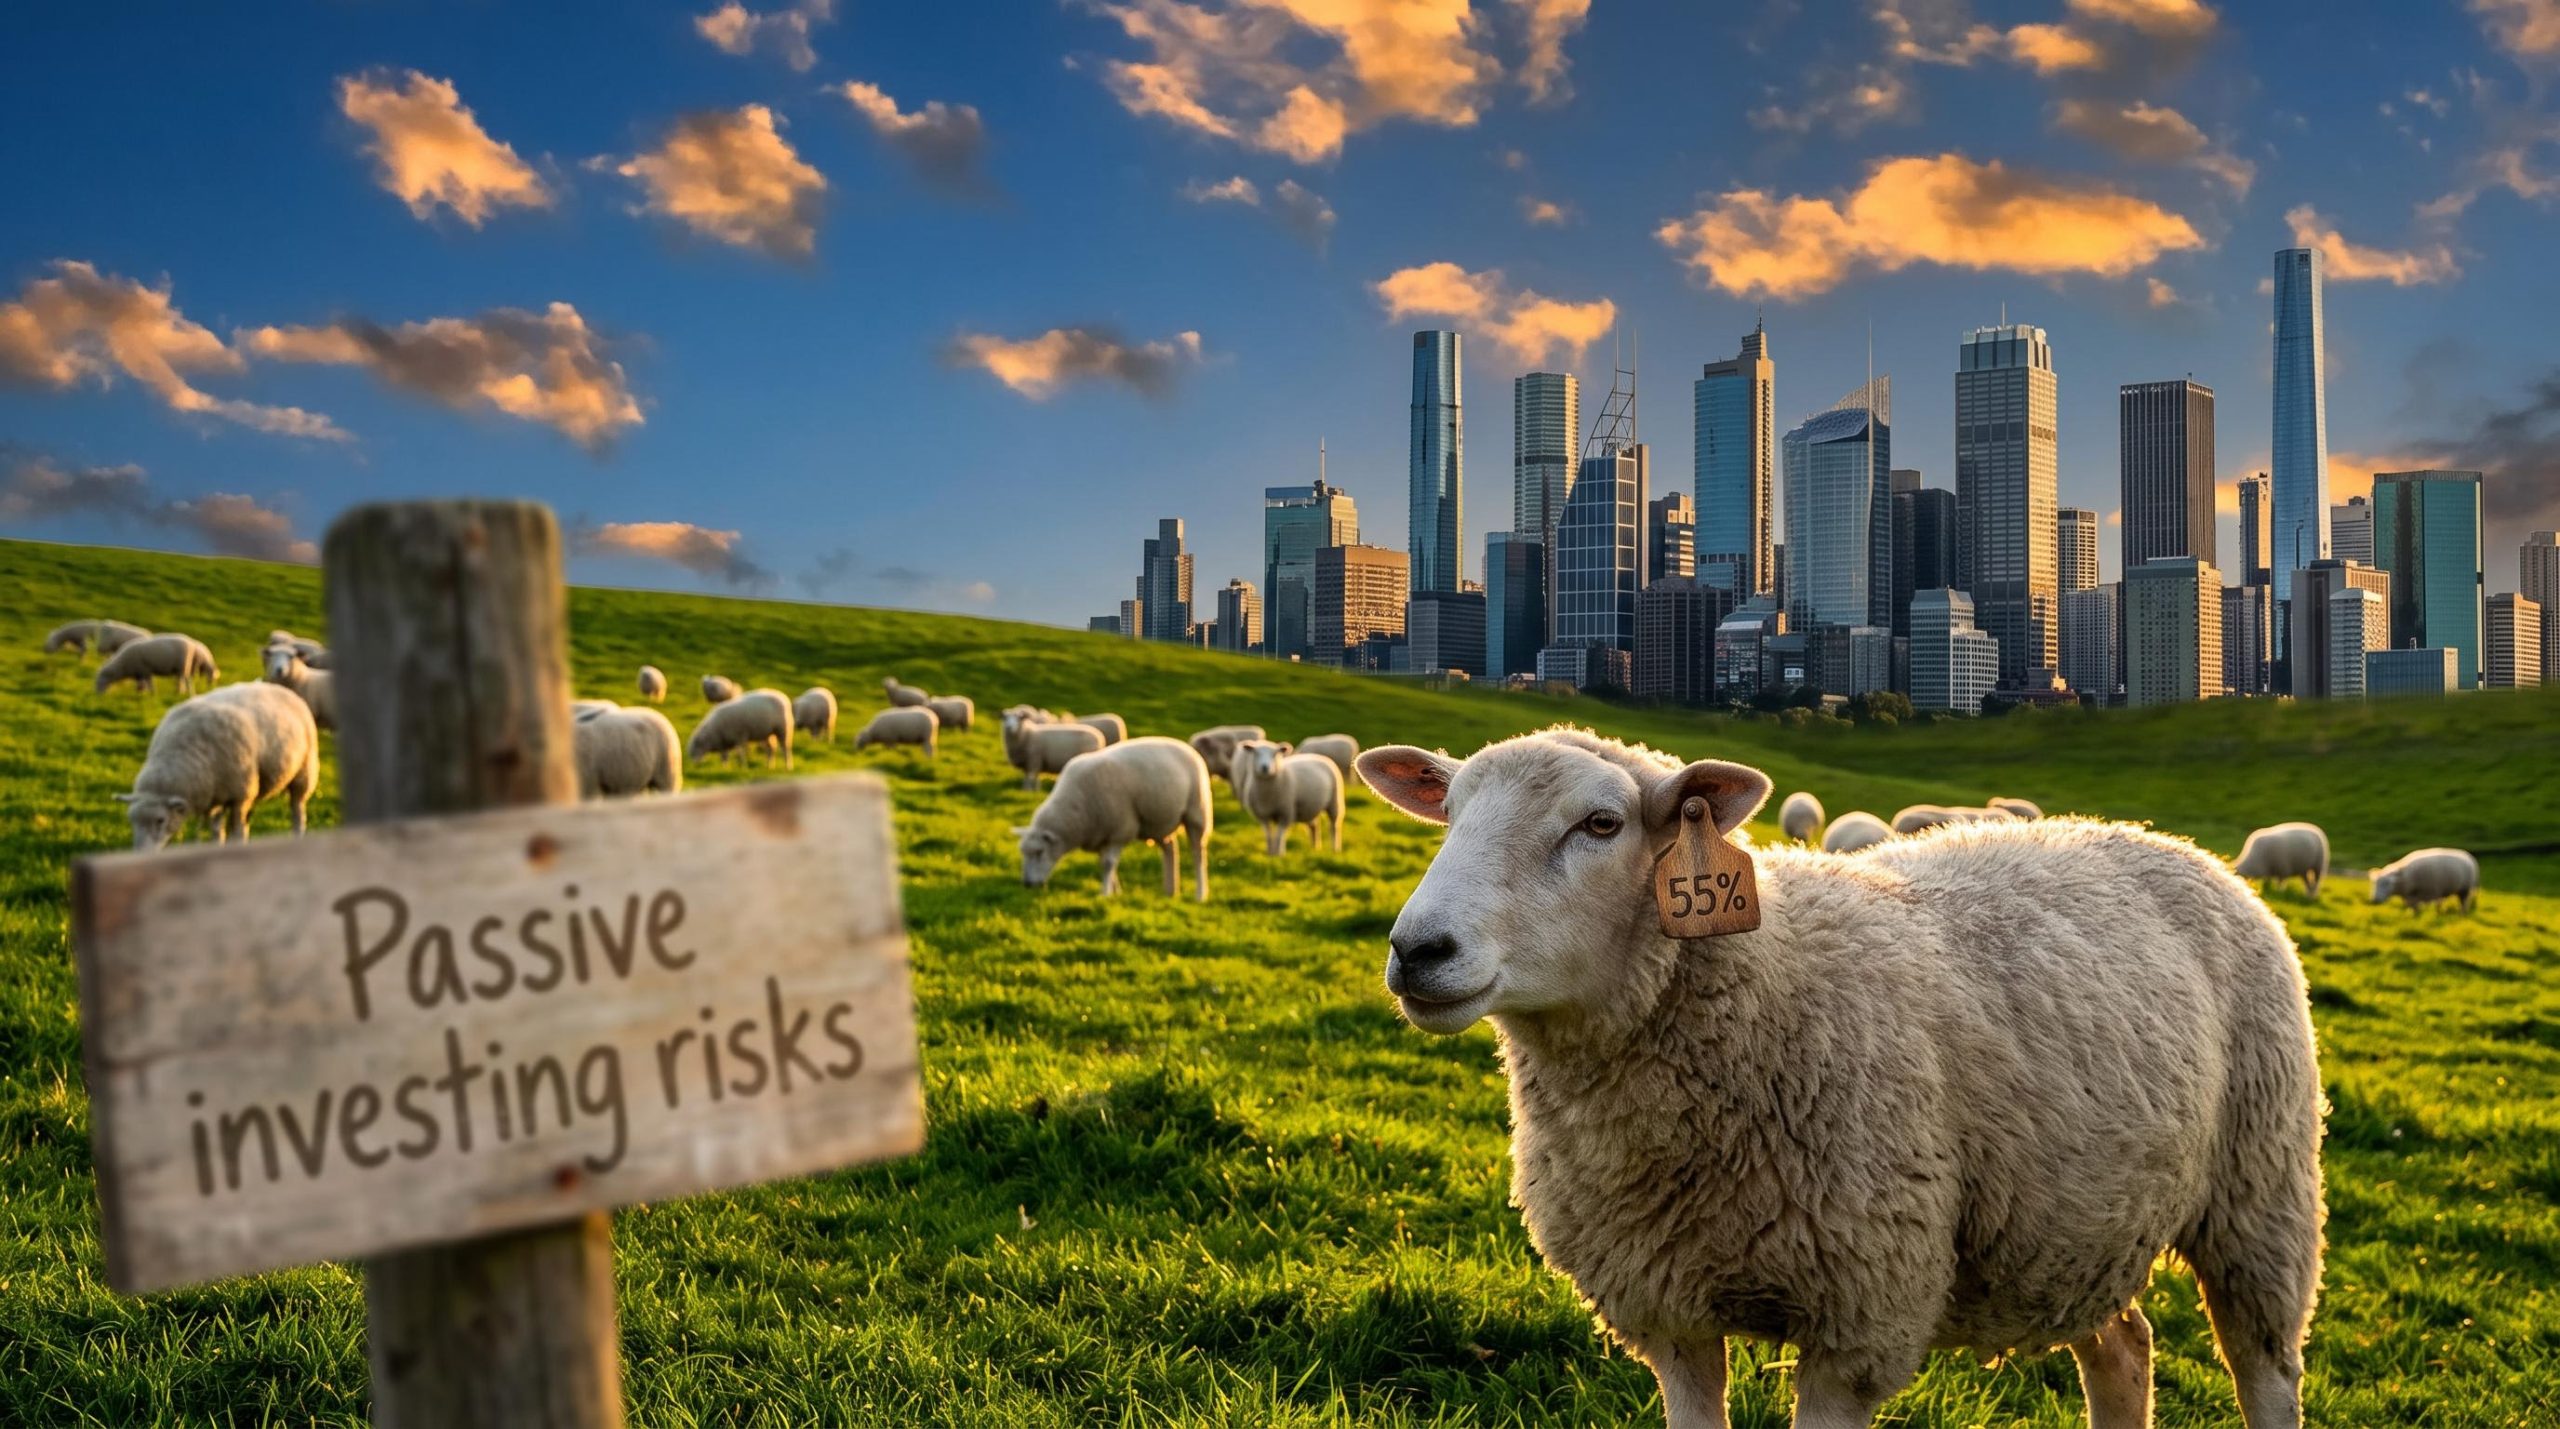
Every new dollar that flows into an index fund can look like another sheep on a shared pasture. Each investor gains a cheap, diversified portfolio, but the worry is that the crowd slowly eats away at the thing that keeps markets honest: someone checking whether prices make sense. Among passive investing risks, this fear is the one that resurfaces most often, and it deserves a fair test rather than a quick dismissal.
The numbers explain why it keeps returning. Passive funds held about 55% of US fund assets at the end of 2025, according to Morningstar. In Australia, roughly 26% of the market is passive, a Maple Brown Abbott estimate reproduced by Morningstar Australia.
If you are deciding how much of your portfolio to put in index funds, those figures can feel like a warning.
Here is what the evidence supports, which parts of the fear survive scrutiny, and where crowd-driven risk actually sits.
Is passive investing really a shared pasture?
Ecologist Garrett Hardin popularised the “tragedy of the commons” with a simple picture. A shepherd who adds a sheep to a shared field keeps the full gain from that animal but bears only part of the damage from overgrazing. Every extra animal looks sensible until the field fails.
The idea sticks because it fits overfishing and traffic congestion so well. At an Australian Shareholders Association presentation in 2025, one attendee applied it to index funds, according to Morningstar’s Shani Jayamanne. Passive investing was fine in moderation, the attendee argued, but continued inflows could leave the market barren.
Serious critics share versions of that view. Michael Burry has warned that indiscriminate index buying can lift large companies above fundamental value and create a one-way market, where buyers ignore price on the way in and sell together on the way out.
The sharpest critique Inigo Fraser-Jenkins, formerly of Sanford C. Bernstein, argued passive investing is “worse than Marxism” because market-cap indexes send more money to companies that are already large, reinforcing incumbents rather than directing capital to its best future use.
The scale behind these arguments is real, provided each figure is read against the right base.
| Jurisdiction | Measure | Figure | Source and date |
|---|---|---|---|
| United States | Passive share of all fund assets | 55% (US$19.4 trillion) | Morningstar, year-end 2025 |
| United States | Active share of equity funds | 37% (implying about 63% passive) | Morningstar, 26 January 2026 |
| Australia | Passive share of market | 26% | Maple Brown Abbott via Morningstar Australia, 9 November 2026 |
What this tells you is that high passive ownership is a fact. But a share of fund assets is not a share of trading, so the headline number alone cannot prove the pasture is being stripped.
When big ASX news breaks, our subscribers know first
How price discovery survives when more money tracks the index
Price discovery is the process by which buying and selling pushes a share price towards what the business is worth. Index funds do not take part in that judgement. They buy at prices set by active managers, arbitrageurs and market makers, and in effect free-ride on the information those traders produce.
That sounds like a weakness until you follow the incentives:
- Flows push a price too far. Heavy index buying lifts a stock above its value, or selling drags it below.
- Active capital steps in. Short sellers and fundamental managers sell the expensive stock or buy the cheap one.
- Information enters the price. Their trading closes the gap and earns them a return.
- The return must cover the cost. Research, trading, financing and the risk the mispricing persists all have to be paid for.
The bigger the mispricing, the bigger the reward for correcting it. Economists Sanford Grossman and Joseph Stiglitz formalised this: prices can never be perfectly informative, or nobody would pay to gather information. The likely equilibrium is fewer active investors, not none.
What the evidence does show
Research by Jeffrey Coles, Davidson Heath and Matthew Ringgenberg found greater index ownership cut some information gathering: Google searches fell 3.8%, SEC EDGAR filing views 14.1% and analyst reports 10.8%. Yet measured price informativeness did not fall.
The Australian picture adds a local wrinkle, because ASX price discovery is increasingly shaped by leveraged pod shops and quant funds trading around index flows, a different channel from the one the academic studies measure.
Where critics have a point
Thinner analyst coverage, more index-linked correlation and price jumps on index inclusion are real, measurable costs. Arbitrage also has limits, from short-selling costs and career risk to forced redemptions. These are second-order effects, not proof of failure.
The stronger concern may be ownership. Harvard’s John Coates, cited by Morningstar, has highlighted that Vanguard, BlackRock and State Street hold about 17% of large US companies on average. For you, the read is that passive ownership dents information production at the margin, while concentrated voting power is the more legitimate worry.
Concentration and valuation: the risk hiding inside a broad index
Prices still work, then. The sharper question is what a broad index actually holds.
Market-cap weighting gives more weight to whatever has risen most. By December 2025, the ten largest S&P 500 companies made up about 40% of the index’s value, so an apparently diversified fund carried a heavy bet on a handful of names.
Beneath the top ten, S&P 500 concentration extends further, with roughly 30 names carrying more than half the index weight while a large share of members have lagged this year.
That does not make every giant expensive. Morningstar put the S&P 500 forward price-to-earnings (P/E) ratio, which compares share price to expected earnings per share, at 20.3 at mid-2026, down from 22.5 at the end of 2025. A separate Morningstar reading from August 2026 placed the 2026 level just below the five-year average of 20.23 and above the ten-year average of 19.48. The two sources are dated differently but broadly agree: about 20 times.
Underneath the aggregate, the largest holdings vary widely.
| Holding | Forward P/E (October 2026) | Versus S&P 500 aggregate (about 20) |
|---|---|---|
| Nvidia | 14.35 | Below |
| Alphabet | 22.52 | Slightly above |
| Amazon | 24.27 | Above |
| Microsoft | 27.32 | Above |
| Apple | 35.46 | Well above |
The concentration concern holds up; the claim that all mega-caps are overvalued does not. If you own a broad US index, you own a meaningful bet on a few US giants, and that exposure is worth checking even when overall valuation sits near its averages.
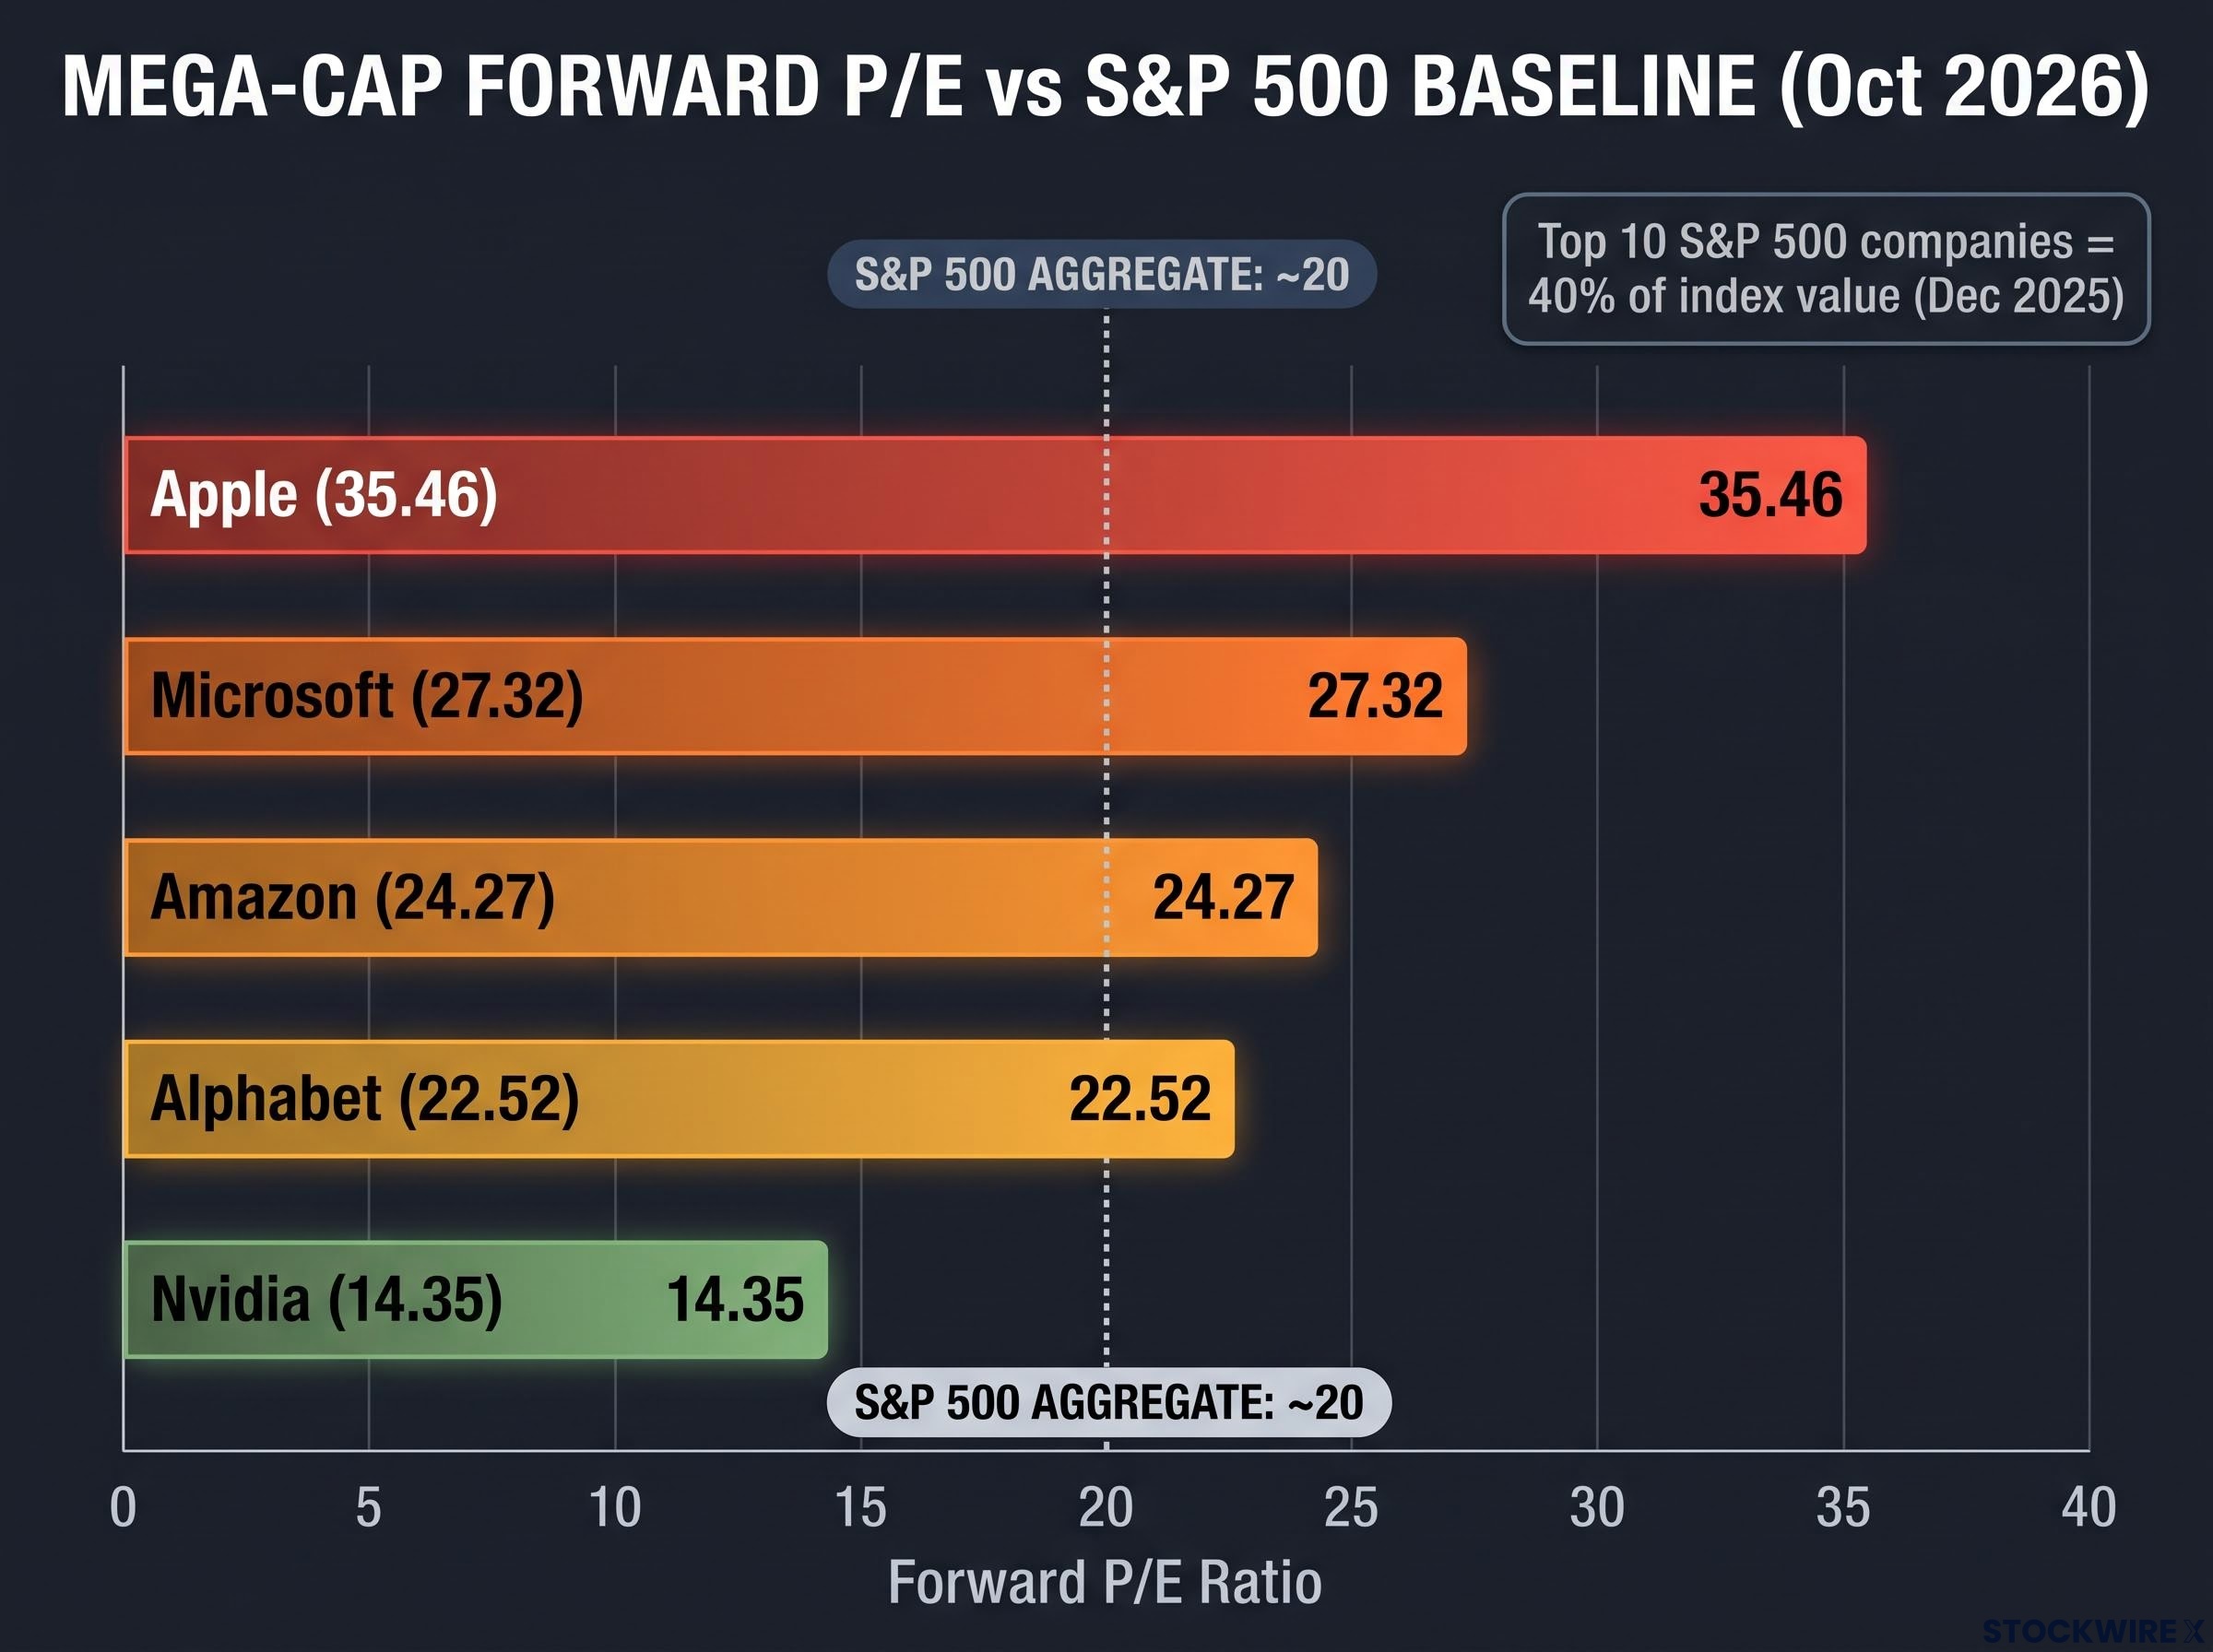
Top 10 S&P 500 companies hold 40% of the index value, but forward P/Es vary wildly around the ~20 baseline, from Nvidia at 14.35 to Apple at 35.46.
Where crowd risk really lives: herding, leverage and daily resets
If index funds are not the herd that wrecks the field, which crowd is? Recent history points somewhere else.
Familiar crowd episodes
GameStop in 2021 was retail herding, options activity and short squeezes overwhelming valuation. Volmageddon in February 2018 saw short-volatility products forced to rebalance into a falling market. The August 2024 yen carry-trade unwind, as the BIS described it, involved leveraged positions forced to unwind as the yen rose. None was an index-fund failure.
The common thread is shared leverage. When many investors borrow against the same assets, a price fall triggers margin calls, which force selling, which deepens the fall. FINRA warns most leveraged and inverse ETFs reset daily, so compounding can make results over longer periods differ sharply from the stated multiple.
Case study: South Korea’s leveraged single-stock ETFs
South Korea supplied a fresh example this year.
- Launch: 16 leveraged and inverse ETFs tied to Samsung Electronics and SK hynix listed on 27 May 2026, targeting about 2x daily exposure.
- Fees: Brokerages and the Korea Exchange collected about ₩117.3 billion in commissions and fees between 27 May and 31 July.
- Rules: The basic cash deposit requirement rose from ₩10 million to ₩30 million.
- Wider context: A ₩55 trillion Citi estimate covers South Korean retail losses on leveraged ETFs generally, not just these products.
The cost to retail investors Retail clients of 10 major brokerages lost ₩6.31 trillion from launch to 14 August 2026: ₩2.32 trillion realised and ₩3.99 trillion (63.2%) unrealised.
Daily resets, volatility drag and retail investors chasing two heavyweight stocks formed a feedback loop. At a parliamentary audit reported on 22 October 2026, FSC Chairman Lee Eog-weon and the FSS Governor apologised, and the two regulators disputed how hastily the products were introduced.
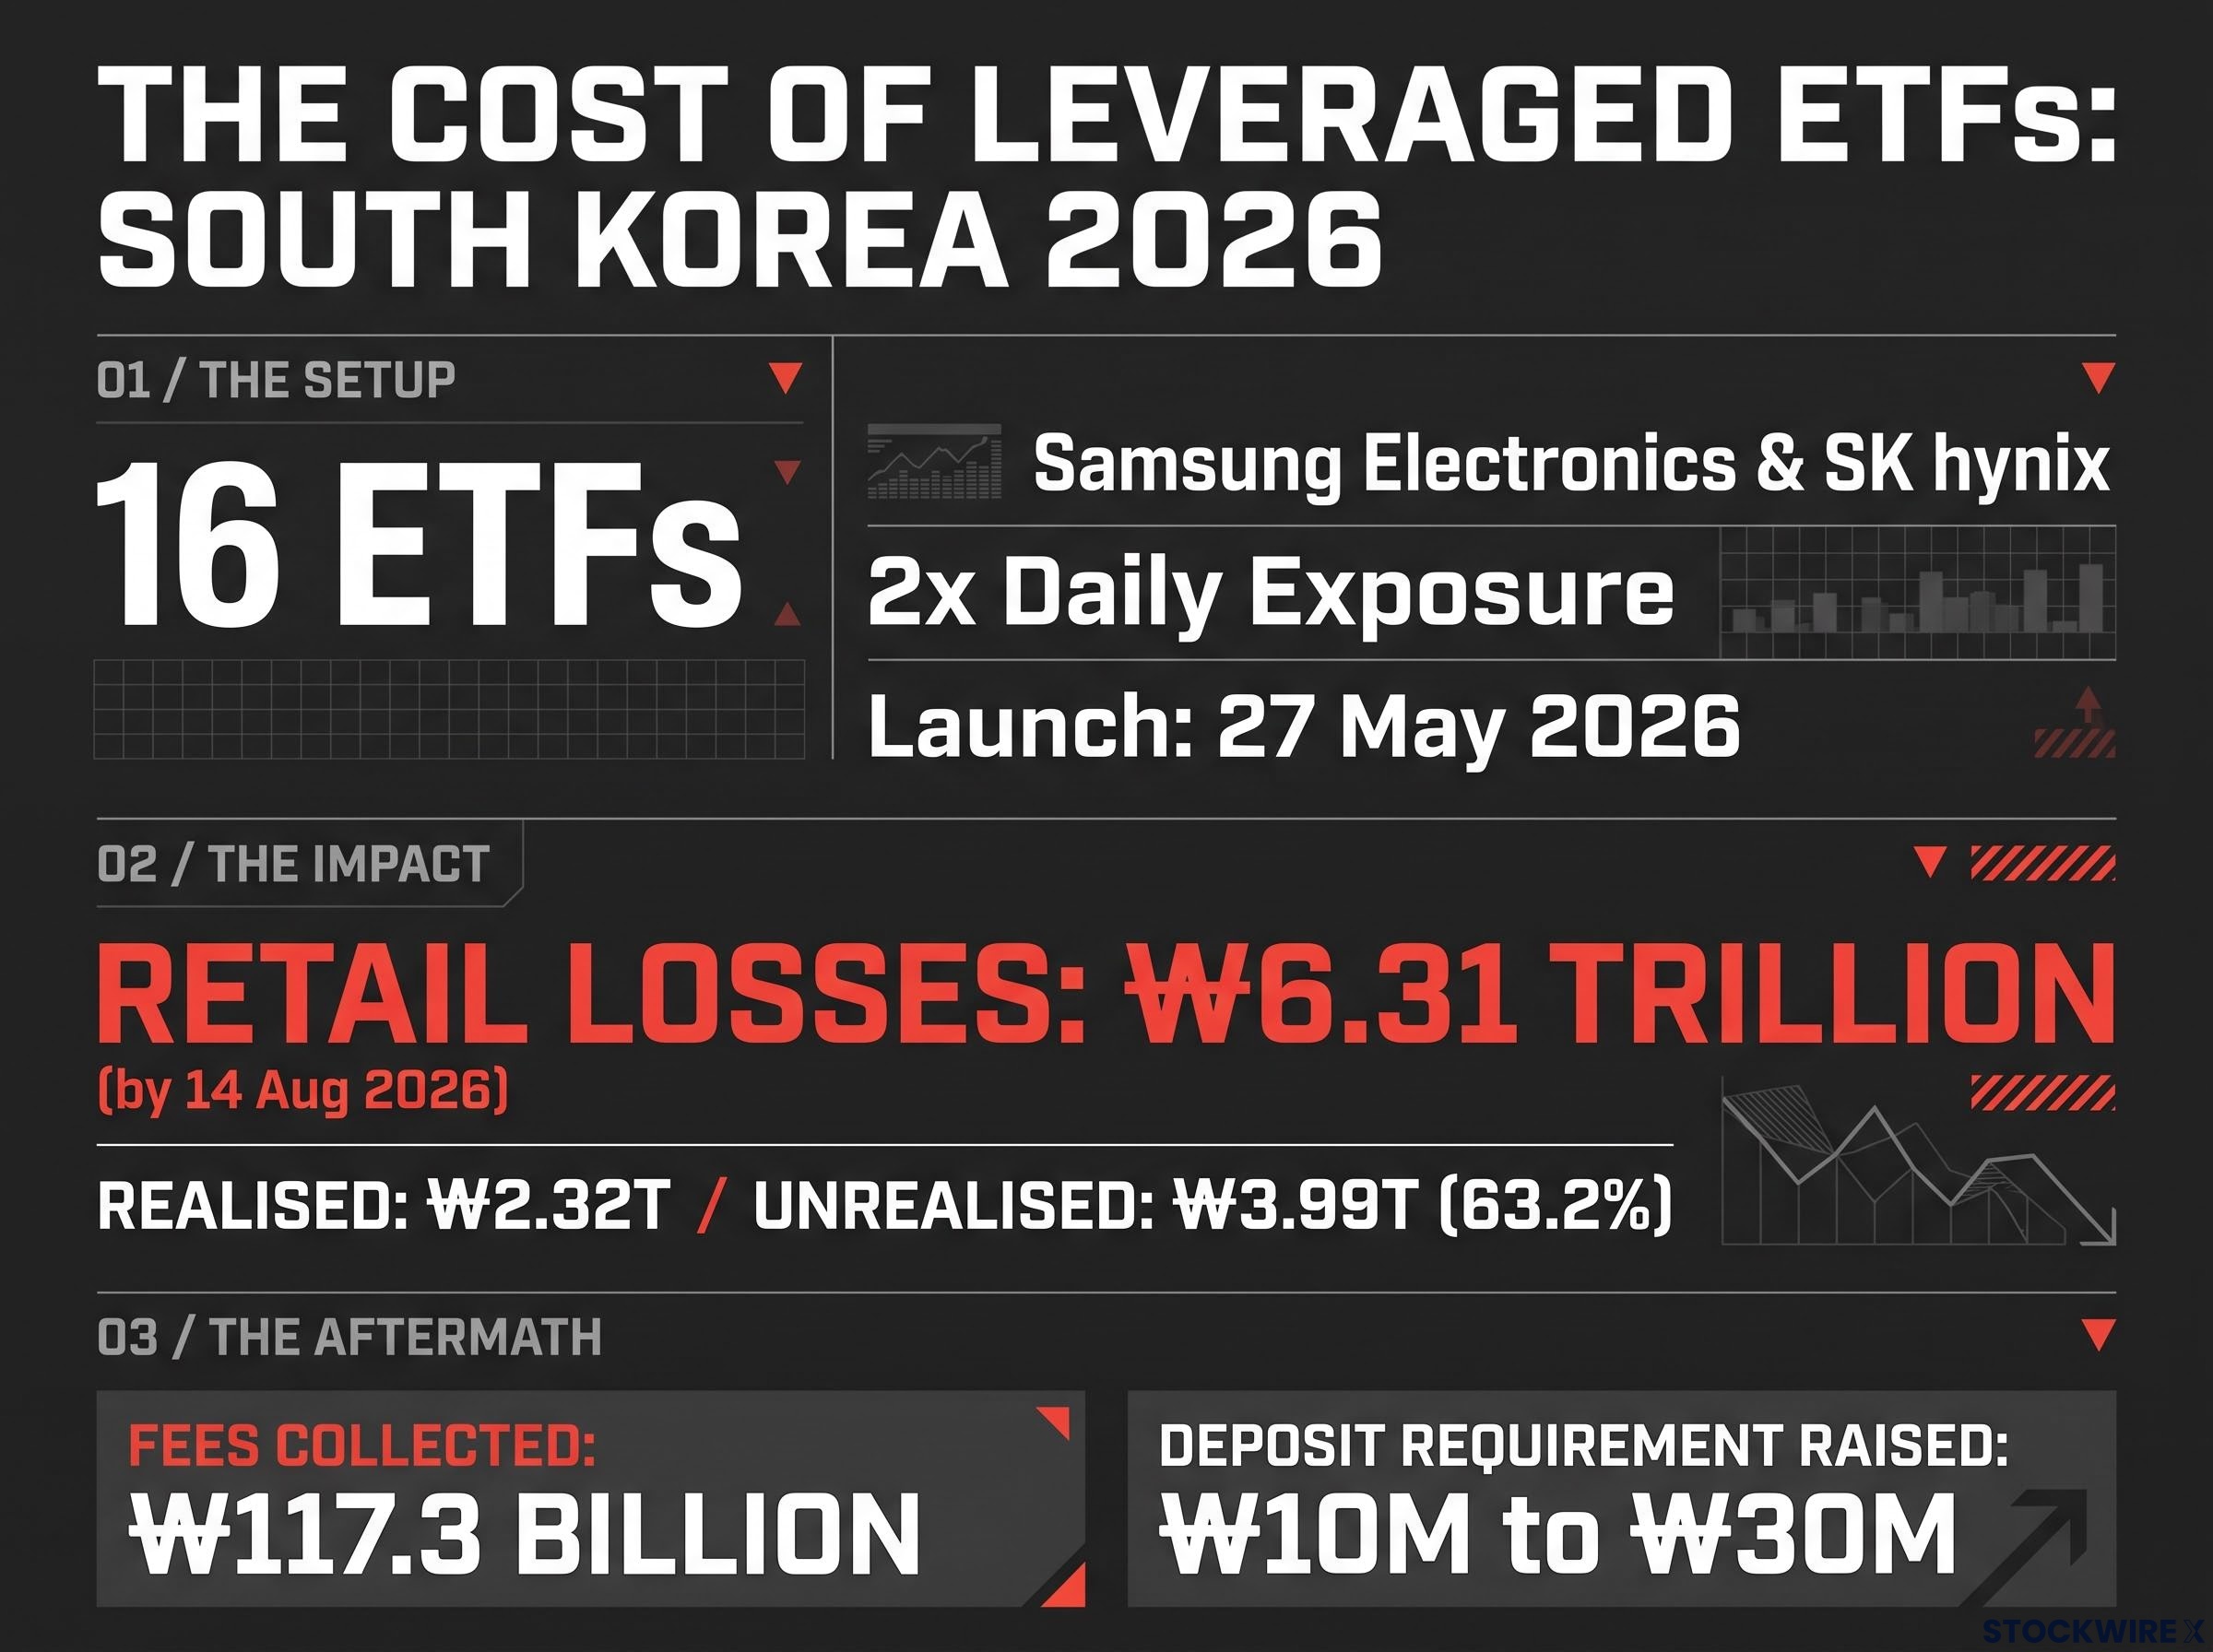
Between their 27 May 2026 launch and 14 August 2026, 16 2x leveraged ETFs tied to Samsung Electronics & SK hynix lost ₩6.31 trillion in retail capital.
The lesson for you is that the dangerous crowd shares leverage, momentum and daily resets in the same concentrated stocks. Product structure matters far more than the passive label.
Turning the evidence into portfolio decisions
You can keep a low-cost index core without guilt. The discipline lies elsewhere.
Vanguard Australia describes a core-satellite structure. The core is a cheap, diversified index holding meant to capture market returns; satellites are smaller positions where you express a view or preference. Vanguard also outlines two ways to rebalance, meaning to sell back to your target weights: on a fixed schedule, or when a holding drifts past a set threshold.
The case for a low-cost core rests on the long-run record of index funds versus active management, where cost drag and persistent underperformance rates explain why most investors are better served by a cheap, diversified default.
| Guidance | Why it helps | Trade-off |
|---|---|---|
| Low-cost core plus selective satellites | Keeps most money cheap and diversified | Satellites add tracking error, fees and underperformance risk |
| Rebalance on a schedule or threshold | Stops winners quietly taking over | Thresholds react faster but raise turnover, tax and trading costs |
| Avoid leveraged or inverse ETFs as long-term holdings | FINRA says most reset daily and typically suit one-session holding only | Gives up a tactical hedging tool |
| Manage total exposure, not fund labels | Reveals the same bet held several ways | Diversifying can dilute high-conviction positions |
The move you could make this week is the last one. List your US index fund, growth ETF, thematic products and any employer shares, then add up how much of each sits in the same few mega-caps. That total, not the word “passive” on a fund, is the number that tells you how crowded your position is.
Why the real test is crowded exposure, not index funds
Passive investing is not itself a tragedy of the commons. Free-riding and thinner information production are real but bounded, and active investors still have every incentive to correct prices when gaps open.
The risks worth watching sit in concentration, leverage and daily-reset products as markets evolve, where crowds sharing the same financing and momentum have caused genuine losses this year.
Avoiding what everyone else buys is not the lesson. Knowing what you own, how much of the same bet you hold, and how it is financed is.
This article is for informational purposes only and should not be considered financial advice. Investors should conduct their own research and consult with financial professionals before making investment decisions.