
Someone appears to have sold about $2.1 million of September 2027 $55 puts on a stock that has lost more than half its value since May. Once you subtract the premium collected, the effective entry lands near $38, almost exactly HSBC’s $39 price target. That CoreWeave options flow is now being read as a possible floor, and it deserves scrutiny before anyone treats it as one.
CoreWeave (CRWV) shares fell about 15% on 14 October as yields on its bonds climbed toward 15-16% and credit default swap pricing surged. Since then, traders have been scanning the options tape (the live record of options trades) as a sentiment gauge.
Mistaking one trade for a price floor carries a real cost. The specific trades cited here come from options-tape commentary and could not be independently corroborated in exchange records or named publications.
Here is how to read these prints, run the breakeven maths yourself, and weigh the result against the financing evidence that is more likely to decide where the stock goes.
What did the CoreWeave options tape actually show after the selloff?
Two headline prints dominated the commentary. They point in the same general direction but carry very different levels of conviction.
| Trade | Contracts | Premium | Execution | Days to expiry |
|---|---|---|---|---|
| Sept 2027 $55 puts | 1,259 | ~$2.1M | ~99% on the bid; OI up ~1,253 | ~326 |
| June 2028 $85 calls | 2,000 | ~$3.28M | Crossed at $16.40 in a $16-16.50 market | ~599 |
The put selling is the more informative signal, and the two trades should not be assumed to be linked. They also arrived against mixed flow. The prior week saw about $19.66 million of unusual call buying near 52-week lows, followed later by roughly $6.66 million of puts sold as the stock kept sliding.
On 14 October, options volume ran above seven times its 30-day average, with just under 200,000 puts against about 106,000 calls. Roughly 26,000 December 18 $37.50 puts opened near the ask at about $0.74.
“Bubble puts” Scott Bauer of Prosper Trading Academy gave those December puts that label, noting they need roughly another 42% decline over two months to pay off.
The mix kept moving: puts made up 44.27% of volume on 26 October and 35.48% on 27 October. Bullish and bearish capital are both active at once, so no single headline print can stand in for “the market’s” view.
A separate reported $19.6 million call bet on April 2027 $90 calls drew similar attention, and it carried the same verification caveat, since the block’s execution price and trade side could not be confirmed.
When big ASX news breaks, our subscribers know first
How do you read bid-side execution, open interest and crossings?
On a screen, a print shows a price, a size and where it traded relative to the bid (the highest price buyers offer) and the ask (the lowest price sellers accept). Every inference you draw from those details comes with a built-in limitation.
| Feature | Usual reading | Limitation |
|---|---|---|
| Put at or near bid | Likely sold; bullish or income-seeking if opening | May be a hedge, spread or closing trade |
| Put at or near ask | Likely bought; bearish | May be a hedge or spread |
| Call at or near ask | Likely bought | May be closing, a hedge or a spread leg |
| Call at or near bid | Likely sold or overwritten | May be closing |
| Open interest rise in line with volume | Stronger evidence of new positions | Cannot identify who opened them |
| Large crossing | Matched size at a negotiated price | Reveals no directional intent |
Open interest is the number of contracts still outstanding. When it rises by roughly the volume traded, the trades were probably new positions rather than exits.
A crossing is a pre-arranged trade between two parties. Cboe matches crossable interest at an opening price, so a crossing tells you size and price, not who wanted what. Every rule here is probabilistic, because hedges, spreads, rolls and closing trades can all produce the same print.
Why the put print is stronger evidence than the call crossing
The put activity carries two confirmations: about 99% traded on the bid, and open interest rose about 1,253 against 1,259 contracts. That combination fits traders opening new short put positions.
The call crossing has no such check. Whether it was a fresh purchase or a roll from an older position remains unconfirmed. Elevated volume in the 50-strike puts on Monday added another data point, though its direction was still unknown. Treat flow as a probability-weighted clue, never a confirmed statement of what any trader believes.
What do effective entry prices and breakevens really tell you?
The arithmetic is simple, and running it yourself changes how both trades look.
The payoff arithmetic behind both prints rests on how call and put options work: buyers risk only the premium paid, while sellers collect that premium and accept obligations that can be far larger.
- Short put: take the $55 strike and subtract the roughly $16.72 average premium. The effective entry is about $38.28.
- If CRWV finishes at or above $55 at expiry, the seller keeps the full premium. Below $55, the seller is assigned shares at a net cost near $38.
- Long call: add the $16.40 premium to the $85 strike. The breakeven at expiry is about $101.40.
- Compare both with the $54.24 Friday close (24 October).
| Position | Strike | Premium | Breakeven / effective entry | Move from $54.24 |
|---|---|---|---|---|
| Short put | $55 | ~$16.72 | ~$38.28 | Loses below this, ~29% lower |
| Long call | $85 | $16.40 | ~$101.40 | Needs ~87% rally |
The stock traded at $59.57 during the 27 October session, nudging the put further from assignment. For comparison, Saxo illustrated selling a November 20, 2026 $50 put for about $2.29 with CRWV at $62.13, an effective entry of about $47.71, presented as illustrative only and not a recommendation.
A breakeven is a payoff calculation, not a support level.
The put seller’s cushion is real but finite. The call buyer, by contrast, has made a far more aggressive and convex bet that pays off only if the stock nearly doubles, which tells you the two prints reflect very different appetites for risk.
Does the financing debate undercut any “price floor” story?
The floor narrative is tempting. A seller collects premium, the effective entry lines up with the most bearish analyst target on the Street, and the tape seems to say the worst is priced in.
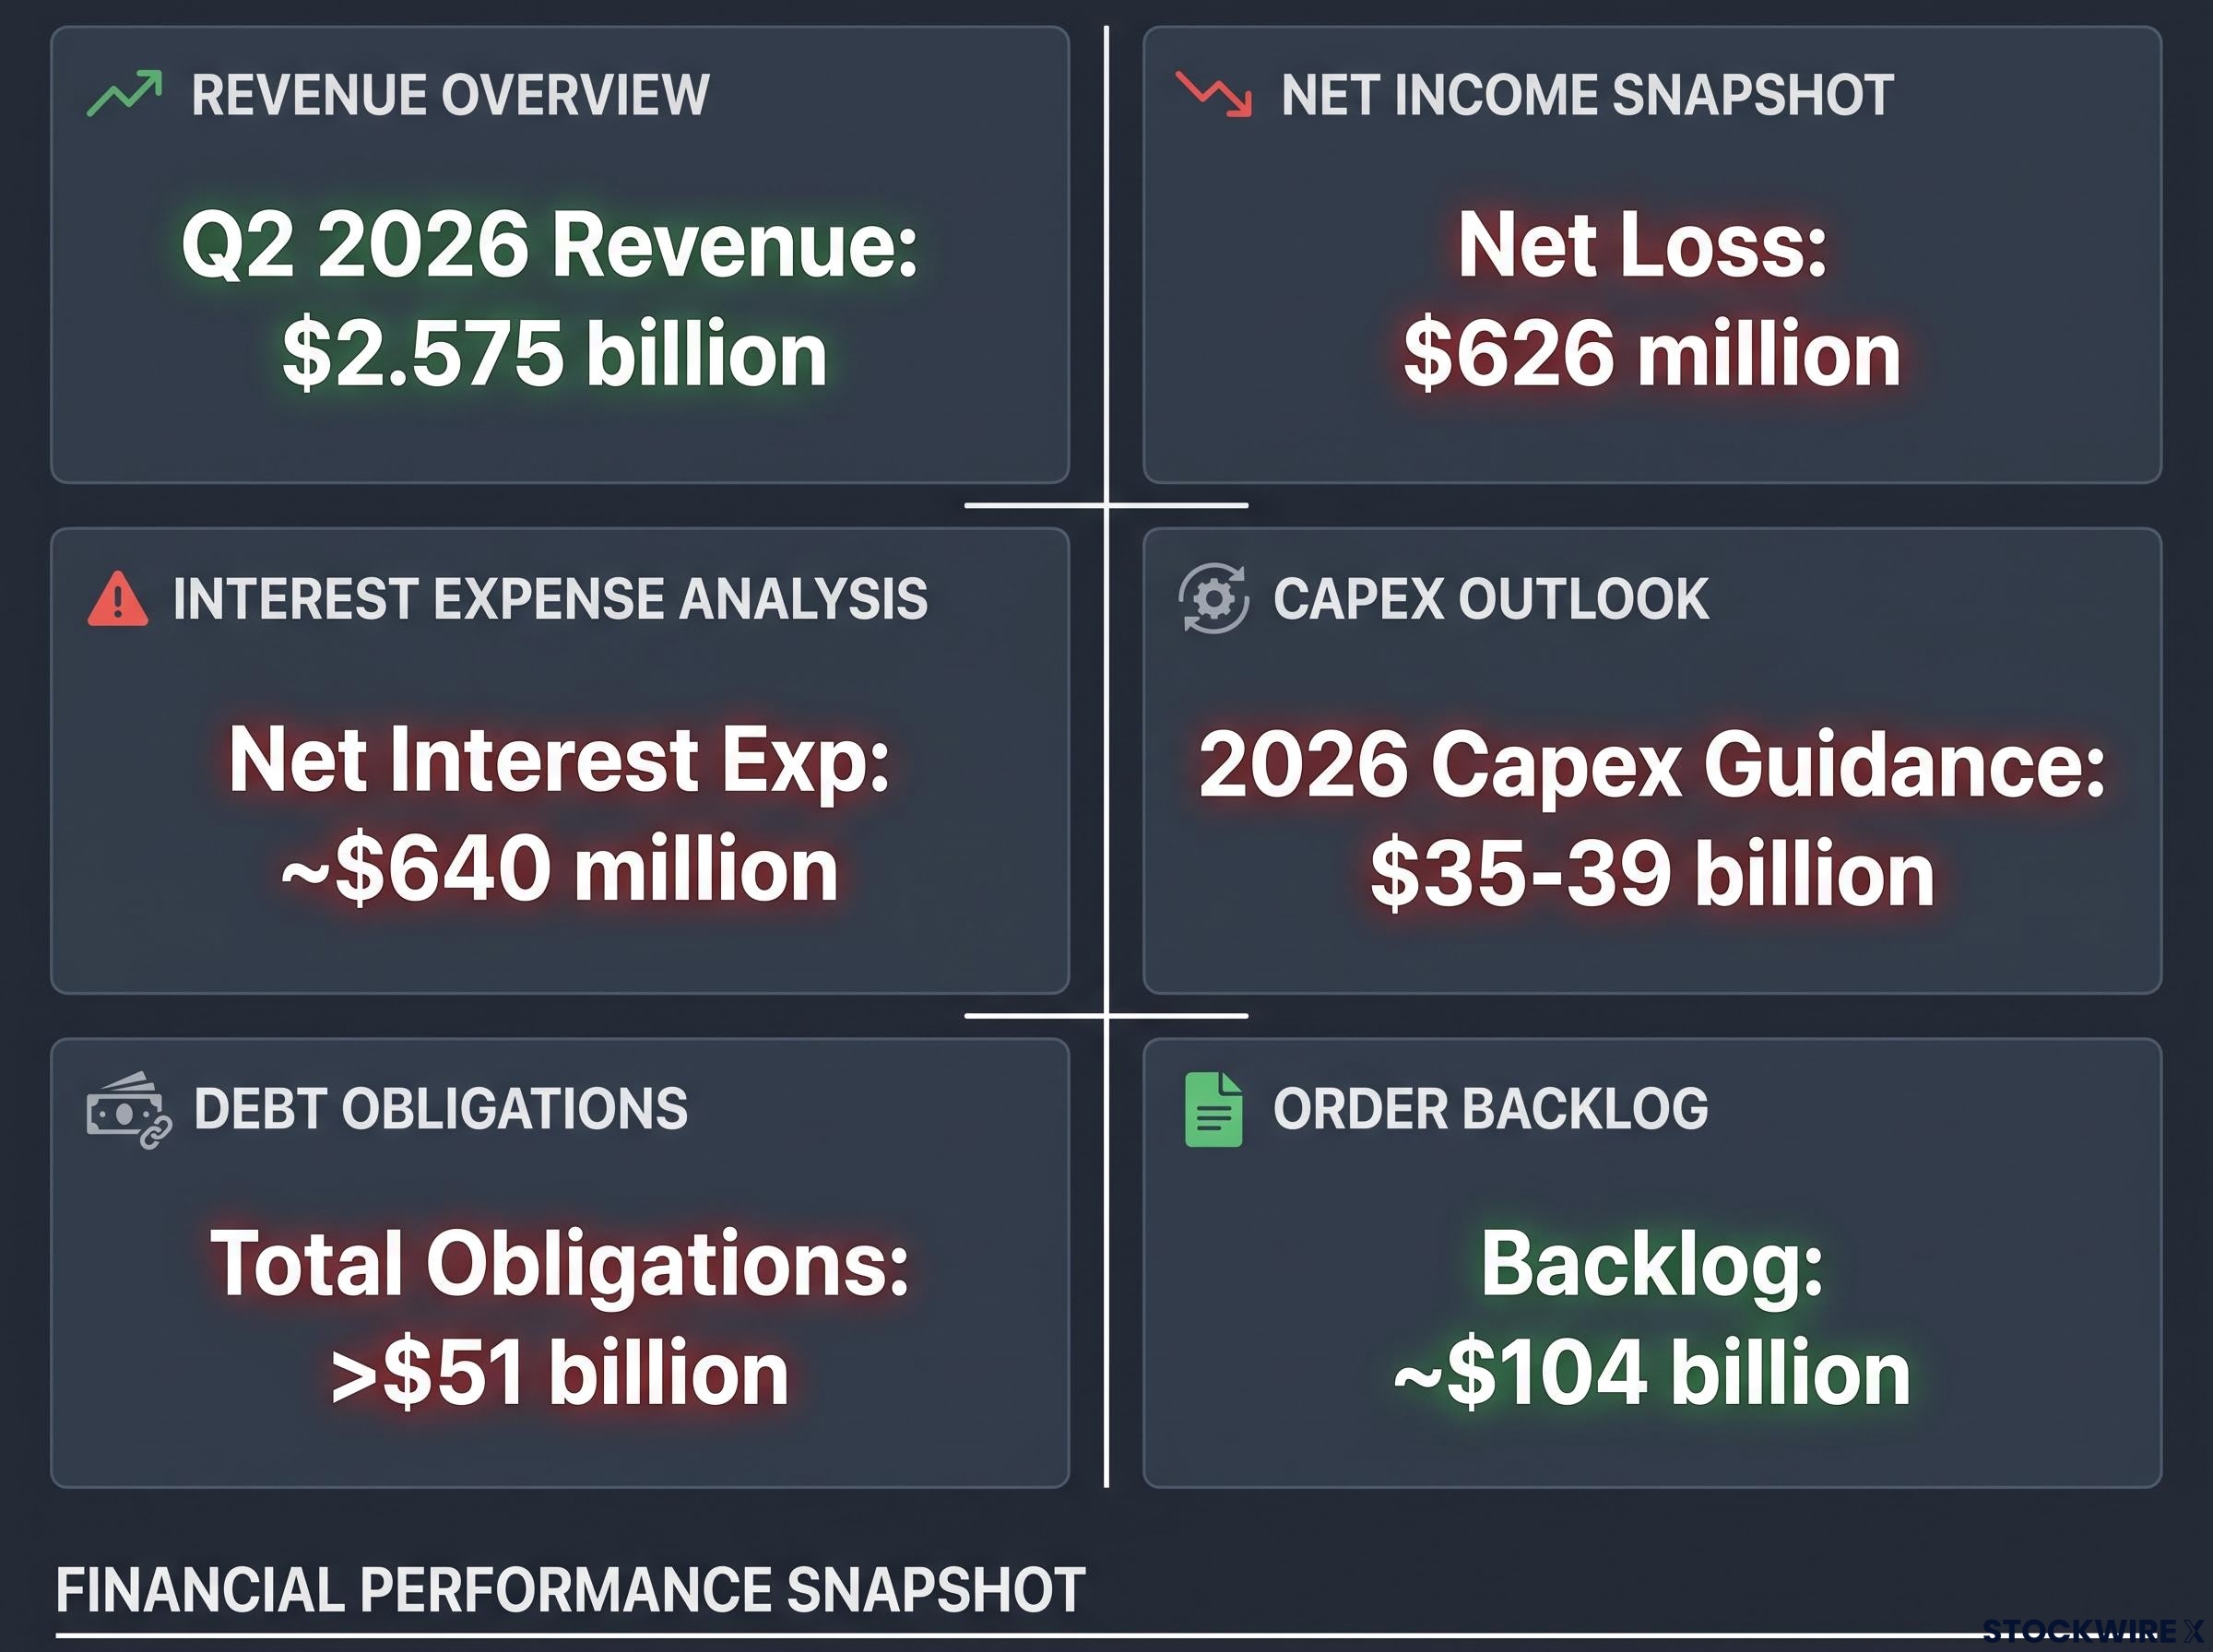
The credit data makes that story look thin. Q2 2026 revenue rose 112.4% to $2.575 billion, yet the company posted a $626 million net loss, with net interest expense of about $640 million. Backlog stands near $104 billion, and 2026 capex guidance is $35-39 billion.
Debt figures vary by definition: about $35.6 billion of cash debt, roughly $50 billion by Reuters’ estimate, and more than $51 billion including other obligations. The 9.75% 2031 notes yielded about 15.78%, while the 9.625% 2032 notes yielded about 14.8%.
Five-year credit default swaps (insurance contracts that pay out if a borrower defaults) rose above 1,140-1,200 basis points. That pricing implied a five-year default probability of about 60-63%, though such figures depend on recovery assumptions and are not a default forecast.
HSBC’s core objection HSBC’s Abhishek Shukla estimates CoreWeave’s average return on invested capital at 8.9% over 2026-30, below its borrowing cost, which would mean added investment destroys value.
Goldman Sachs’ Gabriela Borges counters that much of the financing is asset-backed, so public bond yields overstate the marginal cost of capital.
| Firm | Rating | Target |
|---|---|---|
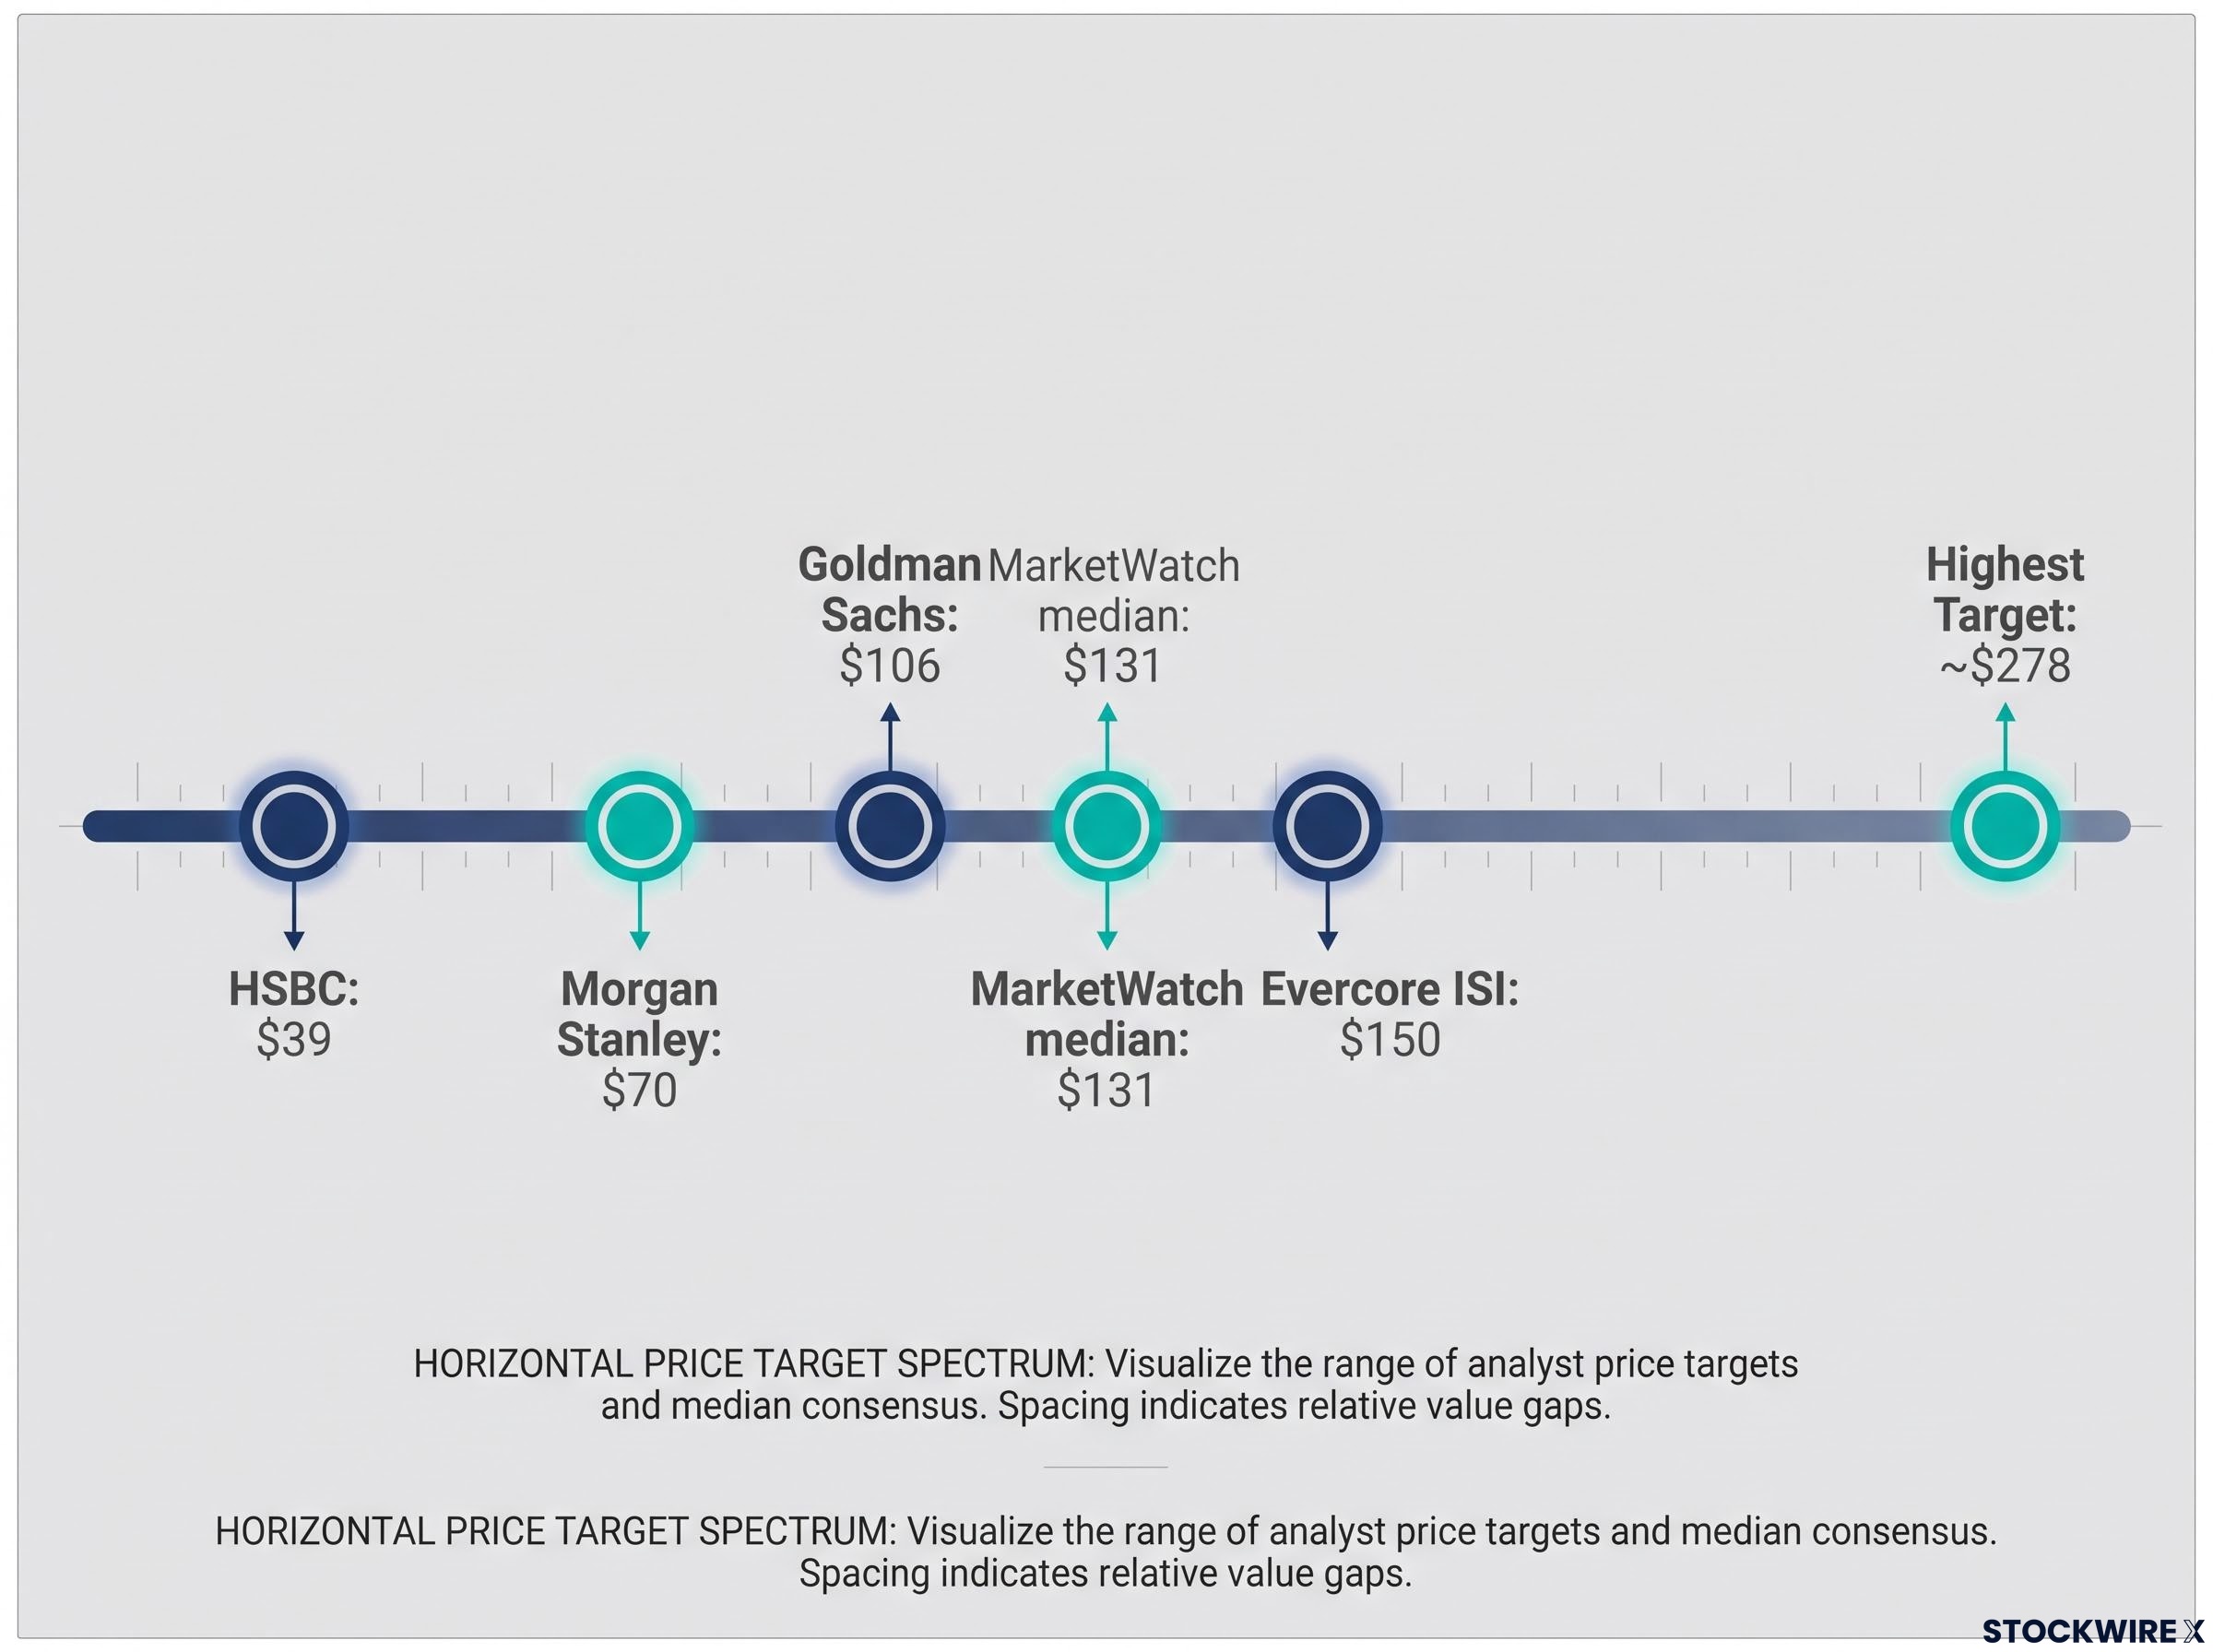
| HSBC | Reduce | $39 |
| Morgan Stanley | Equal-weight | $70 |
| Goldman Sachs | Buy | $106 |
| Evercore ISI | Outperform | $150 |
Published targets run from $39 to about $278, with a MarketWatch median of $131. Several risks sit behind that spread:
- Backlog is not cash: customers must take delivery and fund deployments.
- Customer concentration: heavy reliance on a few hyperscale buyers.
- GPU depreciation: roughly six-year useful lives against Nvidia’s fast product cycle.
- Refinancing and dilution: costly debt could force equity raises.
- Circular financing: Nvidia supplies GPUs, invests in the company and backstops unsold capacity through April 2032.
- Neocloud consolidation: Elon Musk warned of “guppy-level death,” and Gartner forecasts more than 80% of neoclouds could lose independence by 2030.
If you are weighing a CRWV position, these variables matter more than any options trade, because they decide whether a put seller ends up assigned.
What can options flow tell you, and what should you ignore?
Even an accurately reported print can mislead. A large put sale may be a hedge or one leg of a volatility trade, and long-dated options carry substantial volatility and time value that blur any directional read.
Apparent put support can also disappear. Dealer hedging can unwind, and sellers can roll down and out to lower strikes and later dates. The risk is asymmetric: the seller’s gain is capped at the premium, while a credit-driven slide far below the strike could produce substantial losses.
Because about 90% of options trades have a market maker on the other side, dealer hedging can amplify or dampen price moves around large strikes, which complicates any attempt to read support from a single print.
Remember the verifiability problem as well. These trades come from options-tape commentary that later searches could not locate. The broader put/call mix, shifting from 44% to 35% puts over two sessions, is the firmer sentiment evidence.
Before drawing a conclusion from any print, ask:
- Was the position opened or closed?
- Which side did it trade on, bid or ask?
- Does the change in open interest confirm new positions?
- Could it be a hedge, spread or roll?
- Does the breakeven match the thesis being claimed?
Flow can show you where positioning and risk appetite sit. It cannot tell you where the stock is “safe.”
What the CoreWeave trades suggest, and what they cannot promise
If the reports are accurate, the put selling shows that at least one participant would accept a net entry near $38, while the call crossing reflects a long-dated bet that needs a large rally. Neither proves a floor.
The decisive variables remain credit costs, roughly $50 billion of obligations, and continued access to refinancing. Three signals deserve your attention next:
- Bond yields and CDS spreads, and whether they ease from mid-October levels
- Further put open interest building at lower strikes
- Any refinancing, asset-backed facility or capital-raise announcement
This is analysis, not a recommendation to buy or sell.
Readers interested in the wider sector picture can follow our full explainer on AI financing risk, which sets neocloud leverage against hyperscaler capex and circular financing.
This article is for informational purposes only and should not be considered financial advice. Investors should conduct their own research and consult with financial professionals before making investment decisions. Past performance does not guarantee future results. Financial projections are subject to market conditions and various risk factors.