Wall Street cheered on Monday. The Nasdaq Composite rose 0.8%, the Philadelphia Semiconductor Index climbed 2.82% after a 3.21% drop the previous week, and Nvidia added 2%.
The day before, Elon Musk posted on X that more than 200 “neocloud” firms faced “guppy-level death and consolidation”. Markets rallied while one of technology’s loudest voices questioned who will pay for the AI buildout, and that gap sits at the centre of the AI bubble debate.
The timing matters. Microsoft, Alphabet, Amazon and Meta are expected to spend more than $730 billion on capital expenditure in 2026, borrowed money is funding a growing share, and Anthropic‘s IPO filing on 26 October 2026 has pushed AI valuations back into the spotlight.
If you own an index fund, a pension or super account, or individual tech stocks, you have something at stake here. This piece separates the parts of the boom that look like 1999 from the parts that do not, so you can judge where the real fragility sits.
What is AI, and which companies carry the exposure?
Artificial intelligence (AI) is a field of computer science that aims to replicate human thinking abilities in machines. It includes machine learning (systems that improve by finding patterns in data), deep learning, natural language processing and computer vision.
You already use it. Chatbots, image generators like Midjourney, Upstart‘s AI credit assessments, drug discovery tools and the recommendations on YouTube, Spotify and Facebook all run on it.
Investor excitement arrived fast after ChatGPT’s public release in late 2022.
The rally that started it Nvidia rose more than 200% in the six months after ChatGPT launched.
The exposure chain, from chips to neoclouds
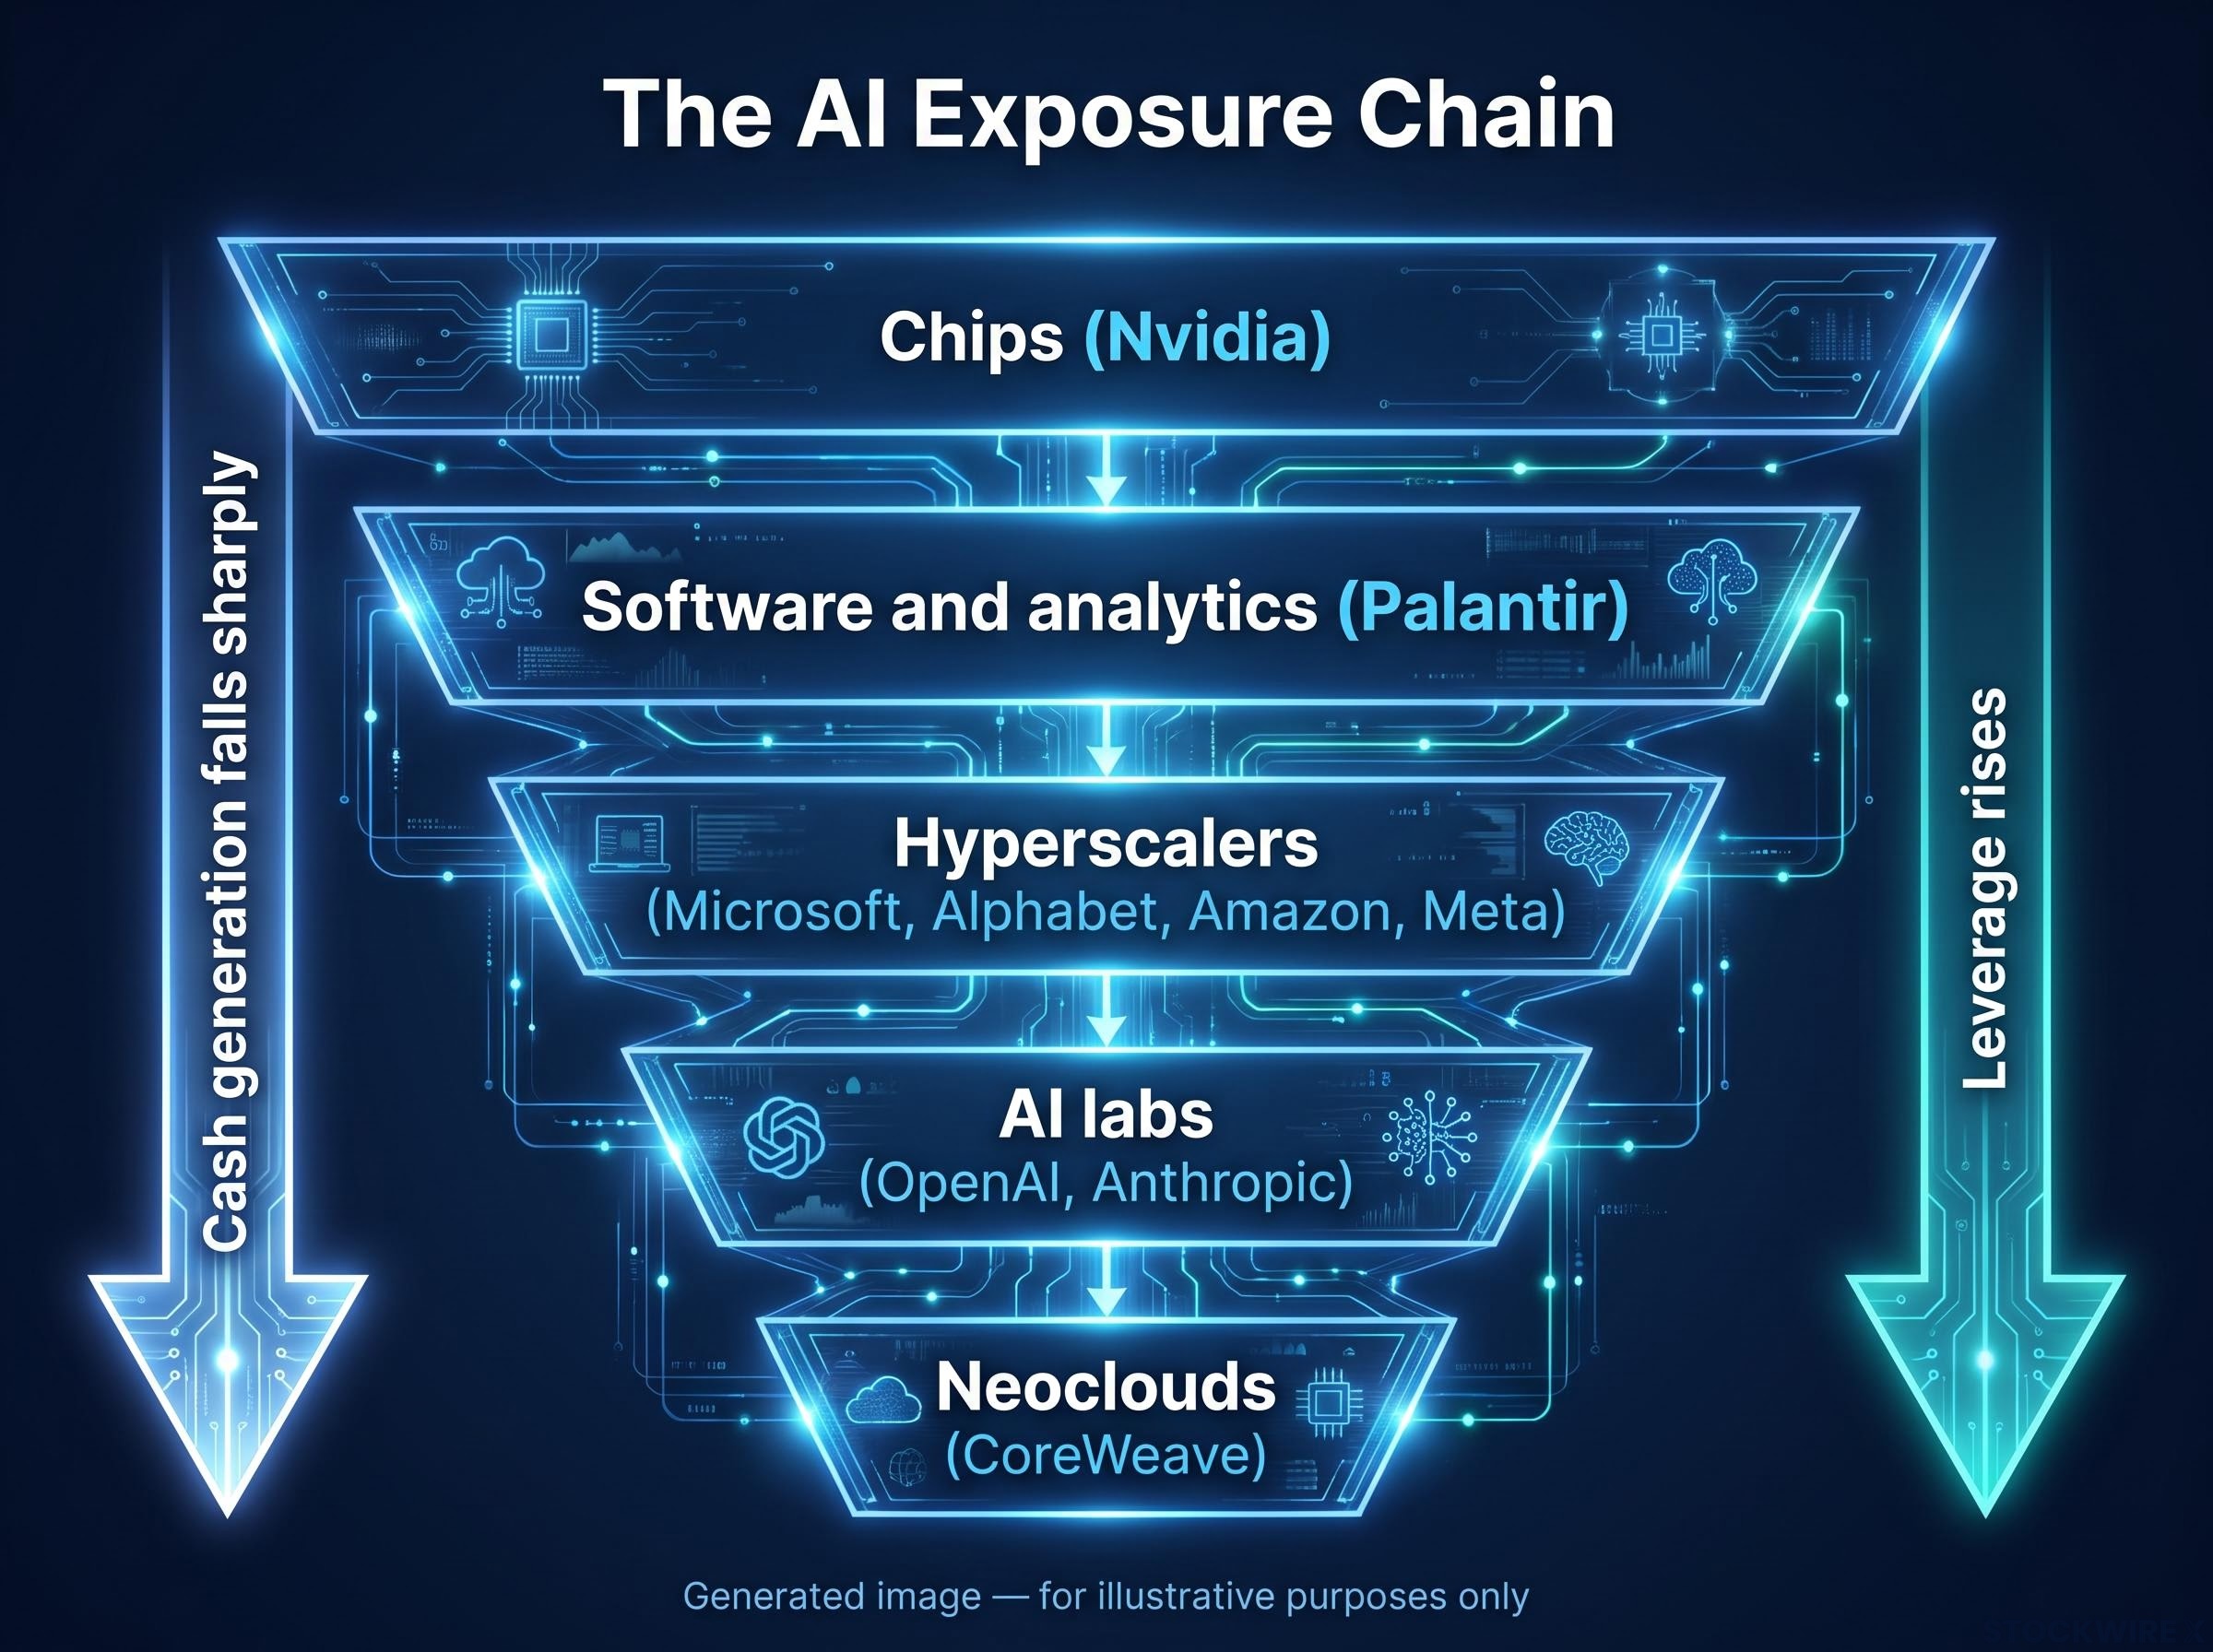
“AI stocks” is less a sector than a supply chain, and each link carries a different kind of risk:
- Chips (Nvidia): sells the processors everyone needs; fortunes depend on order volumes.
- Software and analytics (Palantir): sells data tools to governments and corporations; driven by adoption.
- Hyperscalers (Microsoft, Alphabet, Amazon, Meta): the cash-rich cloud giants funding most of the buildout. Microsoft holds a large stake in OpenAI.
- AI labs (OpenAI, Anthropic): build the models and sign huge cloud contracts; driven by future monetisation.
- Neoclouds (CoreWeave): rent out GPU capacity, largely funded with debt; driven by utilisation and refinancing.
Cash generation falls sharply as you move down that list, and leverage rises.
Monday’s rally was broad. Deutsche Bank analysts credited a chip recovery, big-tech participation and rebounds in AI laggards, while Tesla jumped more than 5% and the Magnificent Seven gained 0.76%. The financing worry, however, sits lower in the chain.
If you hold a broad index fund, you likely already own meaningful AI exposure through those seven giants. The question is not abstract for you.
For readers wanting the spending detail behind the seven giants’ buildout, our full explainer on hyperscaler AI capex shows how Microsoft’s $37 billion AI revenue run rate compares with the spend.
When big ASX news breaks, our subscribers know first
How do today’s valuations compare with the DotCom peak?
The “it’s 2000 again” story is tempting. Prices have soared, the technology feels world-changing and the spending looks enormous. The numbers tell a messier story.
What the multiples say
A forward price-to-earnings (P/E) ratio compares a share price with expected earnings over the next year. Price-to-sales compares it with revenue.
| Index/company | Forward P/E | Price-to-sales | Source/date |
|---|---|---|---|
| Nasdaq 100 | Not found | Not found | No authoritative current source |
| S&P 500 | Approx. 19x (trailing 26.20x) | Not found | Seeking Alpha, Multpl, 26-27 October 2026 |
| Nvidia | Approx. 13.4x (other sources 16x-25.6x) | Approx. 17.0x | Yahoo Finance, 27 October 2026 |
Treat every figure with caution. Nvidia’s forward multiple swings depending on the forecast period, adjusted versus statutory earnings and the snapshot date.
Valuation multiples also depend on earnings quality, and depreciation assumptions that stretch GPU lives to six years when economic lives are closer to three can flatter reported earnings by 10-15%.
A clean March 2000 comparison could not be sourced. The widely quoted claim that the Nasdaq 100 traded at 60x earnings at the DotCom peak versus 25x comes from mid-2023 and should not be read as a current statistic.
A modest multiple on the dominant chip maker tells you the risk is less about paying 1999-style prices for Nvidia and more about whether the earnings it is priced on prove durable.
What 2000 still teaches
| Precedent | Lesson |
|---|---|
| Cisco, 2000 | A dominant supplier with a real business can still suffer a prolonged collapse if valuation outruns growth. |
| Nortel | Suppliers face falling orders when overleveraged customers cancel plans. |
| WorldCom | Debt-funded expansion can turn a slowdown into a solvency crisis. |
| Telecom fibre overbuild | Useful infrastructure can still deliver poor near-term returns. |
The similarities are real:
- Infrastructure is being built ahead of proven demand.
- Debt turns disappointment into credit events.
- Circular financing puts the same capital on several sides of a deal.
So are the differences:
- Leading firms generate substantial revenue and cash flow.
- The technology is deployed, with genuine demand.
- Valuations vary widely; Morningstar estimated on 12 October 2026 that AI stocks trade at roughly an 8% discount to fair value.
Against that, the Bank of England warned in July 2026 that AI valuations had risen faster than broad indices, and that concentration, leverage and momentum trading could amplify any revaluation. The honest answer: bubble-like in places, not everywhere.
Why does debt-funded AI spending worry regulators and Elon Musk?
If valuations are not the whole story, financing is the part that deserves your attention.
How the spending is being funded
| Company | 2026 capex or spending | Financing approach |
|---|---|---|
| Amazon | $54.21B in Q2, up 68% | About $25B raised in July after about $64B earlier |
| Meta | $135B-$145B | About $25B in bonds; proposed new non-voting share class |
| Alphabet | Full-year figure not presented | About $24.8B of debt raised April-June |
| Big four combined | More than $730B | Goldman expects about $250B of hyperscaler bonds |
Goldman Sachs estimates debt covers about one-third of hyperscaler capex, with roughly $750 billion of spending set against about $778 billion of operating cash flow. That leaves almost nothing spare.
Morgan Stanley counted nearly $236 billion of AI-related debt issuance by 31 May, with nearly $570 billion forecast for the year. S&P Global expects more than $7 trillion of spending from 2025-2030 and negative free cash flow until at least 2027.
The International Monetary Fund (IMF) has flagged circular financing, where companies act as customers, investors and lenders to each other at once. Anthropic has committed at least $110 billion with Amazon, $114.5 billion with Google and $44.9 billion with Microsoft, while Amazon and Google are also its investors.
The Bank for International Settlements has also flagged circular financing loops between hyperscalers and neoclouds, warning that revenue booked inside the loop may mask how much independent end-user demand actually exists.
CoreWeave and the neocloud stress test
CoreWeave carries about $50 billion of debt, according to LSEG. Its credit-default swaps (insurance against a borrower defaulting) rose to around 1,200 basis points, and some bonds yield roughly 15-16%.
Its $104.2 billion backlog sounds reassuring, but backlog is contracted future revenue, not collected cash. Capex is forecast at up to $39 billion.
Musk’s warning More than 200 neoclouds face “guppy-level death and consolidation”, he said, because debt markets will hesitate to fund them.
His target is the neocloud layer, not the whole AI economy.
How a downturn would travel
- AI demand or monetisation disappoints.
- GPU rental rates and utilisation weaken.
- Neoclouds earn less while interest bills stay fixed.
- Bond yields rise and refinancing dries up.
- Operators cancel GPU orders and sell equipment, eroding collateral values.
- Chip makers, builders, utilities and lenders lose demand.
- Hyperscalers cut spending, valuations fall and index outflows add forced selling.
Leverage, not enthusiasm, is what turns a slowdown into a crisis. If you hold chip, cloud or utility stocks that sell into this buildout, you are exposed to the borrowers’ ability to refinance, even if you never own a neocloud.
How long can a bubble last, and what should you watch?
Spotting excess does not tell you when it ends.
The timing problem Stanley Druckenmiller argues bubbles do not end within six months, and an AI bubble would likely last at least two and a half years, like the late-1990s DotCom run.
He still holds Palantir and Nvidia. The experts genuinely disagree:
| Source | Position |
|---|---|
| Bank of England | No bubble declared; warns of amplified revaluation risk |
| IMF | Sharp reversals possible if payoffs fail |
| Goldman Sachs | About $9 trillion potential value, dependent on heavy monetisation |
| Morningstar | AI stocks about 8% below fair value |
| Druckenmiller | Bubbles run for years; holds Nvidia and Palantir |
| Elon Musk | Most neoclouds will not survive |
In mid-2023, analysts judged there was no bubble yet, citing expected revenue growth. The 2026 debate adds leverage and circular financing. Anthropic, which filed for its IPO on 26 October and could trade before Thanksgiving at a possible $1.5-2 trillion valuation, will test investor appetite.
Because even a correct bubble call can be early by years, treat valuation concern as a prompt to check your position sizing and diversification, not as a timing signal.
Signals worth tracking
- Neocloud bond yields and CDS: rising costs mean refinancing is getting harder.
- Hyperscaler free cash flow: deeper negatives mean more borrowing.
- GPU rental rates and utilisation: falling rates squeeze leveraged operators first.
- AI revenue versus capex: a widening gap means spending is outrunning payoff.
- IPO reception: a weak Anthropic debut would signal fading appetite.
These statements are speculative and subject to change based on market developments and company performance.
Real technology, fragile financing: how to hold both ideas at once
The evidence points to real technology and real earnings at the top of the chain, with bubble-like risk concentrated in leveraged, circular financing and the neocloud layer.
Respected voices disagree, and key data is missing: current Nasdaq 100 multiples, comparable March 2000 figures and reliable measures of retail and fund exposure. Confident certainty in either direction is not supported.
The next tests are close. Watch the Anthropic IPO marketing window, neocloud refinancing and the next round of hyperscaler capex updates. Then look at your own portfolio and ask how concentrated your AI exposure really is.
Past performance does not guarantee future results. Financial projections are subject to market conditions and various risk factors.
This article is for informational purposes only and should not be considered financial advice. Investors should conduct their own research and consult with financial professionals before making investment decisions.