
A fall of roughly 25-28% from a record high usually reads like an obituary. Yet while gold slid toward $4,000 an ounce, the physical metal held in exchange-traded funds climbed to a record. Prices and conviction are moving in opposite directions, and that gap is the most important clue to whether the gold bull market is finished.
Rising Treasury yields, fears of a Federal Reserve rate hike and forced selling in other markets have pushed bullion down to a reported low near $3,986. The next few weeks matter for anyone holding bars, miners or gold ETFs, because the $4,000 line is where technical damage could start compounding.
This analysis draws on GBI chief economist Trey Reich’s interview with Megan King Diaz on the Golds Show, tested against wider market data. You will come away with a practical way to separate a cyclical correction from a secular reversal, and a clearer sense of how long each gold vehicle needs you to hold on, and how much pain each can inflict along the way.
Is this a correction or the end? What the price and the drawdown actually show
Start with the uncomfortable number. Gold traded around $4,020.60 on 26 October, after touching an intraday low of $3,975.23 on 23 October, according to Reuters-based data that has not been independently confirmed.
That is a long way below January’s peak. How far depends on whose numbers you use, and the figures do not line up neatly.
| Metric | Reich’s figure | Wider data | Note |
|---|---|---|---|
| Peak | About $5,500 (29 January) | $5,595 | Wider data unverified |
| Drawdown | About 25% | About 28.5% | Gap reflects differing peak levels |
| Recent low | About $3,986 | $3,975.23 | Both recorded on 23 October |
Reich also described gold as roughly 5% below a start-of-year level near $4,300. That comparison does not reconcile with the spot data, so treat it cautiously. The 25-29% drawdown is the better-supported frame.
The context Reich adds is the prior run: gains of 65% and 27% over the previous two years. A drawdown this size tells you momentum has broken, but you should weigh it against an enormous climb, not against a calm baseline.
Reich’s view The gold bull market is not finished, and the $4,000 level should hold, with a strong rally likely once short-term pressure from oil and Fed-tightening worries fades.
When big ASX news breaks, our subscribers know first
Why can gold fall when the long-term case looks strong? Yields, the Fed and forced selling
The pressure did not arrive all at once. It built through several channels, each with its own mechanics.
- Forced liquidation: gold is liquid, which makes it the asset people sell when losses pile up elsewhere.
- Higher real yields: gold pays no interest, so rising bond yields raise the cost of holding it.
- Dollar strength: a firmer dollar makes gold dearer for non-US buyers.
- Fed-hike expectations: September’s repricing pushed yields and the dollar up together.
- Slower central-bank buying: official demand is steady but too slow to absorb sudden futures selling.
The trigger came at the end of September, when 10- and 30-year Treasury yields broke out of their range after unexpectedly strong S&P Global purchasing managers’ index (PMI) data. Reuters reported the 10-year yield’s third-quarter surge was its largest quarterly increase since 1994 (unverified), with strategists expecting it to ease from about 5.30% toward 5.00% by year-end.
Then came the liquidation. Reich estimates gold trades around $150 billion a day, so when artificial intelligence (AI) stocks, growth equities and leveraged tech debt fall, gold gets sold to cover the losses. CoreWeave bonds trading near 78 cents on the dollar (an unverified detail) show how far that AI-credit stress had travelled.
The pattern is hard to miss. None of these pressures says anything about why people own gold; they describe market plumbing, and plumbing problems tend to clear.
Gold pays no interest, so what matters is not the headline policy rate but real yields, the nominal Treasury yield minus inflation expectations; that is why a September repricing in Fed-hike odds hit bullion so quickly.
How Fed-hike odds swung in a month
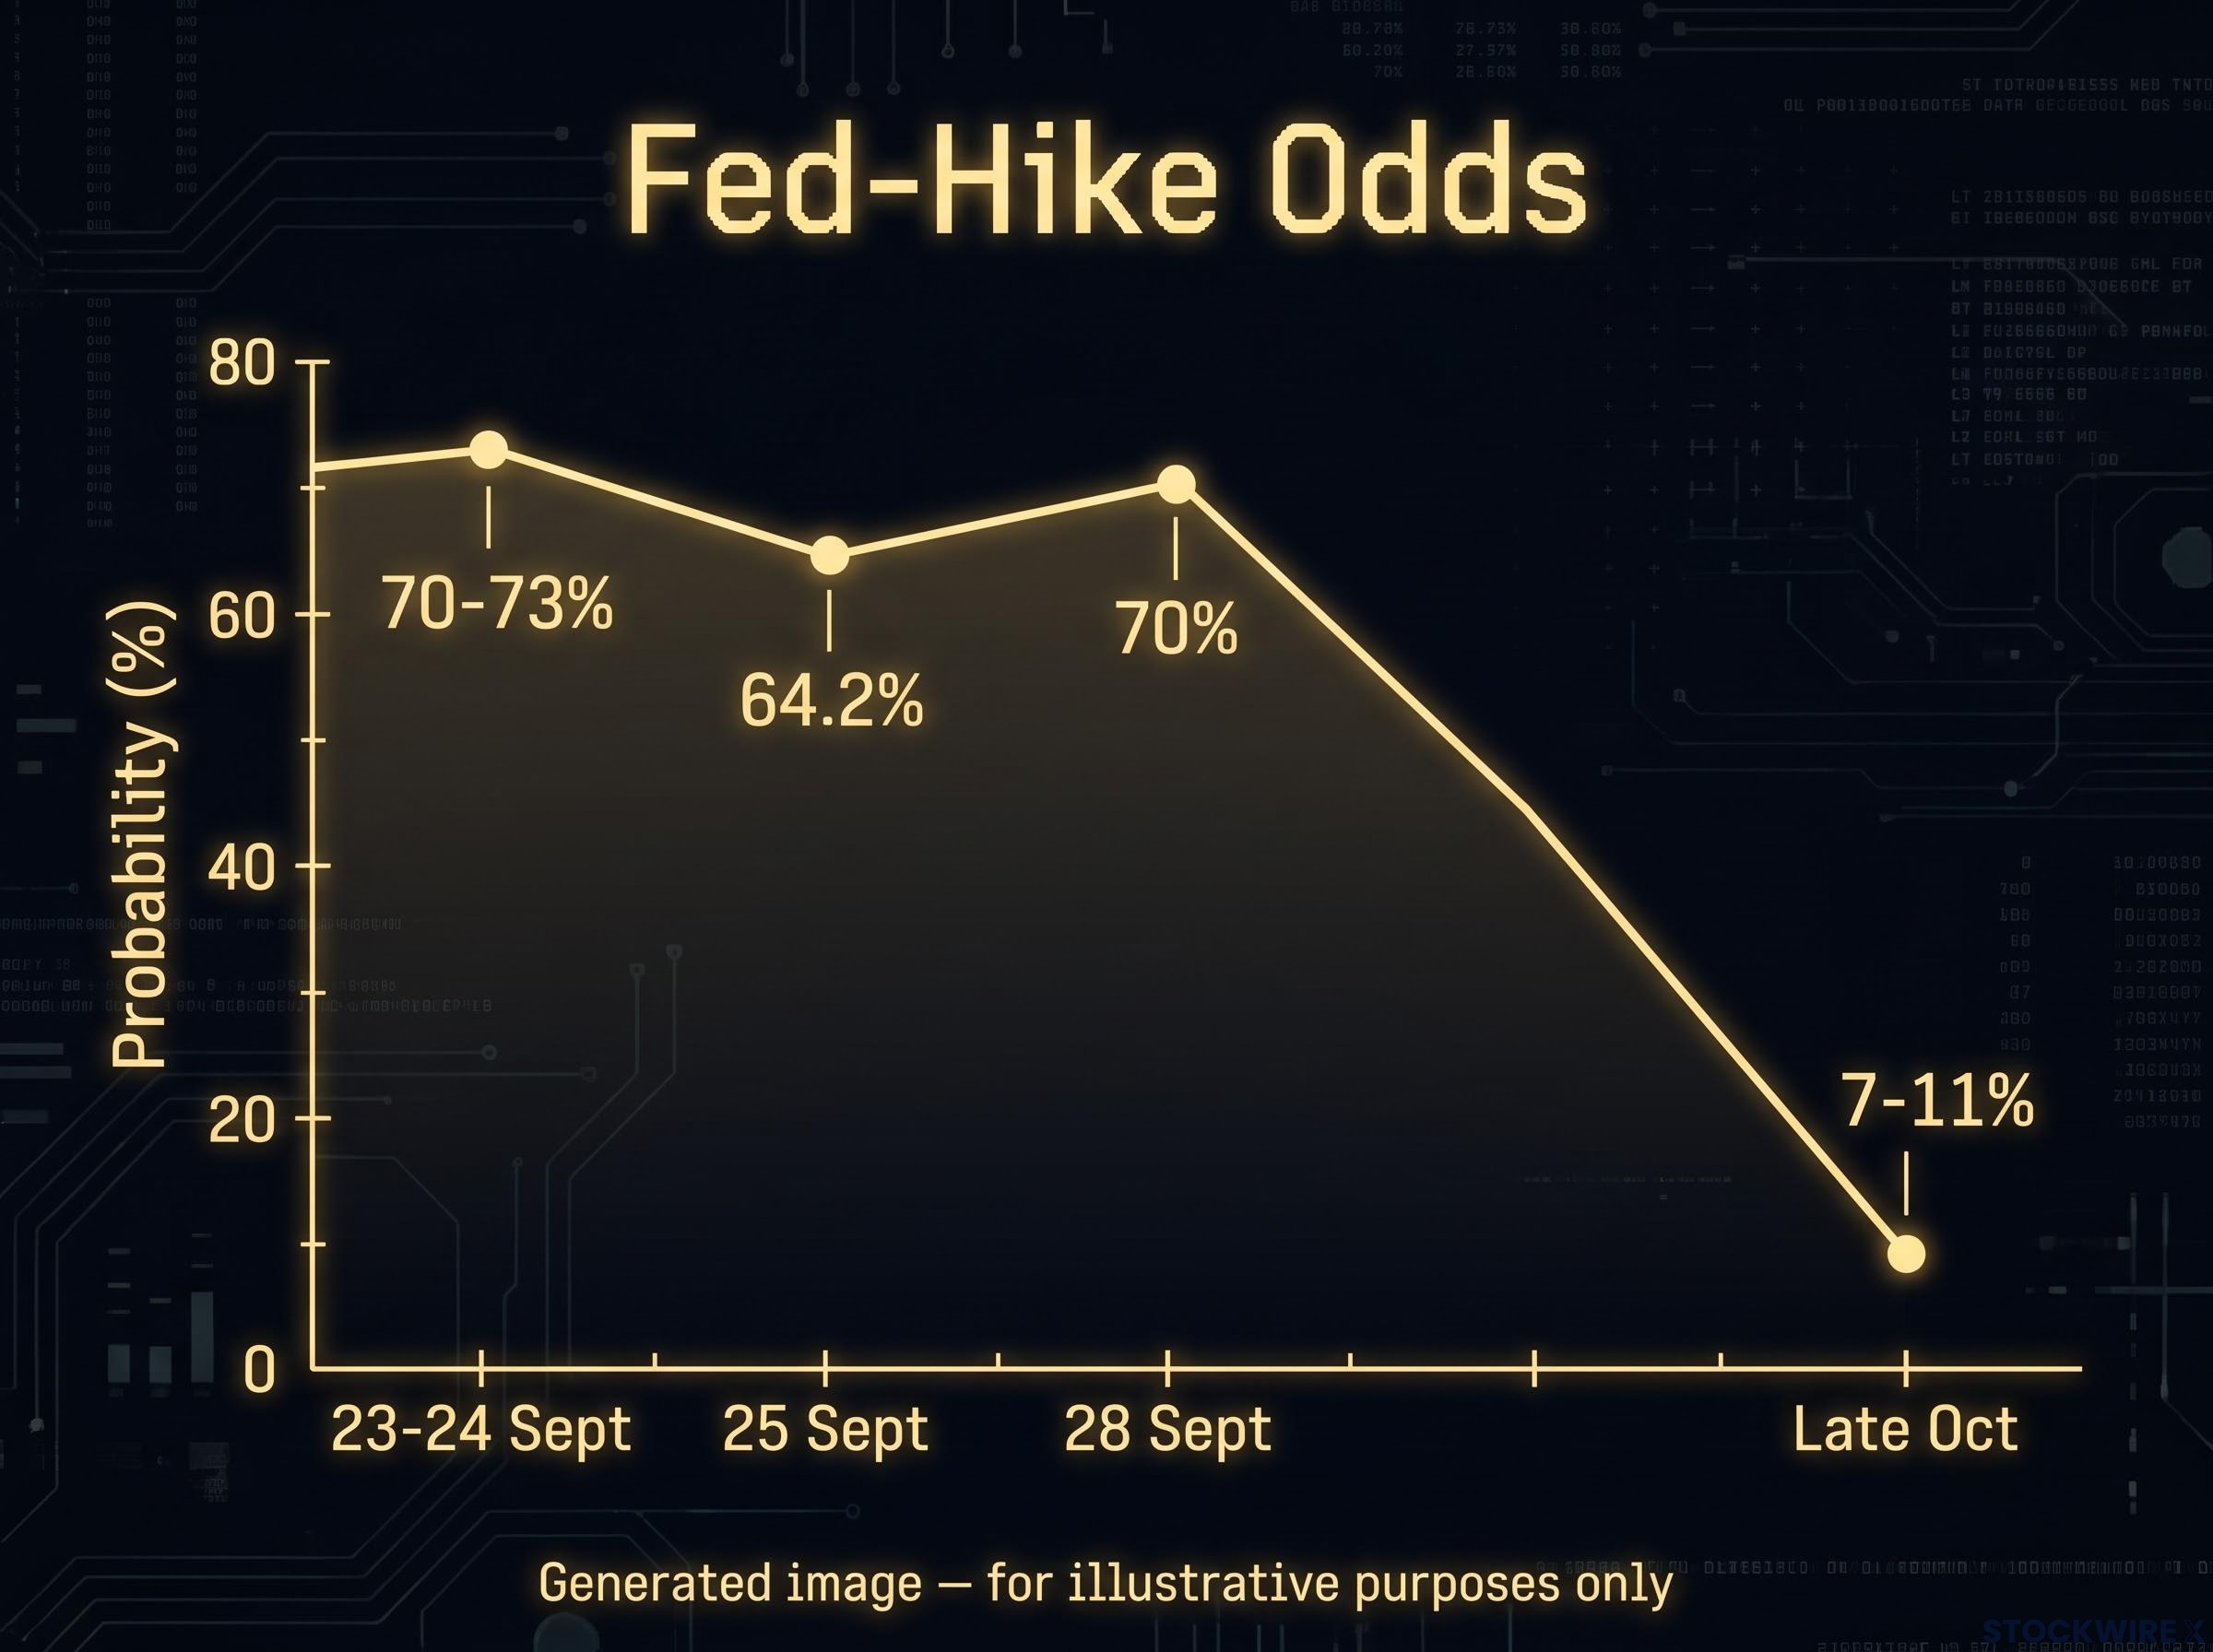
Reich cited odds of an October Fed hike at 70% on 28 September. Unverified research puts the figure at 64.2% on 25 September, with a peak of 70-73% on 23-24 September. The differences mostly reflect observation dates and shifting futures prices.
By late October, those odds had collapsed to roughly 7-11%, depending on the day measured. Fed leaders, including New York Fed president John Williams, signalled no urgency, which Reich reads as concern about Treasury market fragility.
He also argues federal debt service of about $1.2 trillion a year limits how far the Fed can hike. For you, that matters because Reich expects the next upward catalyst to be Fed-related: the moment markets conclude the Fed will not get tough.
What is monetary debasement, and why is gold not a CPI trade?
Most investors assume gold should rise when inflation headlines get scary. Reich argues that assumption is exactly why so many end up disappointed.
Consumer price index (CPI) inflation measures changes in the price of a basket of everyday goods and services. Under that kind of inflation, Reich says, gold should roughly keep pace with other prices and little more.
Monetary debasement The erosion of a currency’s purchasing power through persistent money and credit expansion, fiscal deficits, rising debt and falling confidence in the currency or the government behind it.
Under monetary inflation, gold should outpace other prices. That is the distinction that drives the thesis, and it cuts both ways.
| Scenario | CPI | Real yields and dollar | Likely gold response |
|---|---|---|---|
| Debasement fears grow | Falling or stable | Suppressed or weakening | Gold can rise |
| Temporary price shock | Rising | Rising as tightening is priced | Gold can fall |
| Ordinary goods inflation | Rising | Broadly stable | Gold roughly keeps pace |
Reich’s three long-term drivers are anti-dollar sentiment, the US deficit and Fed credibility. He watches signals such as quasi yield-curve-control talk from the Treasury secretary; yield-curve control means efforts by a central bank or treasury to cap bond yields at certain maturities. The takeaway for you is that CPI prints are the wrong dashboard for gold.
Sovereign stress as a debasement signal
France and Brazil are Reich’s live examples of eroding confidence in sovereign balance sheets. France’s 10-year premium over German bonds reached 177 basis points (one basis point is one-hundredth of a percentage point); unverified research puts it at 177.7 on 22 October, the widest since 2011, with the French 10-year yield at 5.1415%.
In Brazil, a weekend presidential election result hit local markets hard, and the Bovespa fell 13.9%. Accounts of the real’s drop differ (about 11% in one report, 8% in another), and Reich’s own figures of 25% and 17% market declines likely reflect different measures.
These are confidence signals, not direct price drivers. Reich also cautions that gold is not an especially effective geopolitical hedge, so read sovereign stress as slow-building evidence rather than a trading cue.
Who is buying and who is panicking? ETFs, central banks and miners
Here is the apparent contradiction. Gold fell, yet ETF holdings kept rising, according to Reich, who argues retail investors have largely sat out since the January and March highs, leaving smarter money doing the buying.
Unverified World Gold Council data supports the picture: record third-quarter ETF inflows of $31 billion, and holdings up 67 tonnes to a record 4,256 tonnes.
Prices and assets under management fell, but tonnes rose ETF assets dropped 7% to $574 billion purely on lower prices, while the physical metal held reached an all-time high.
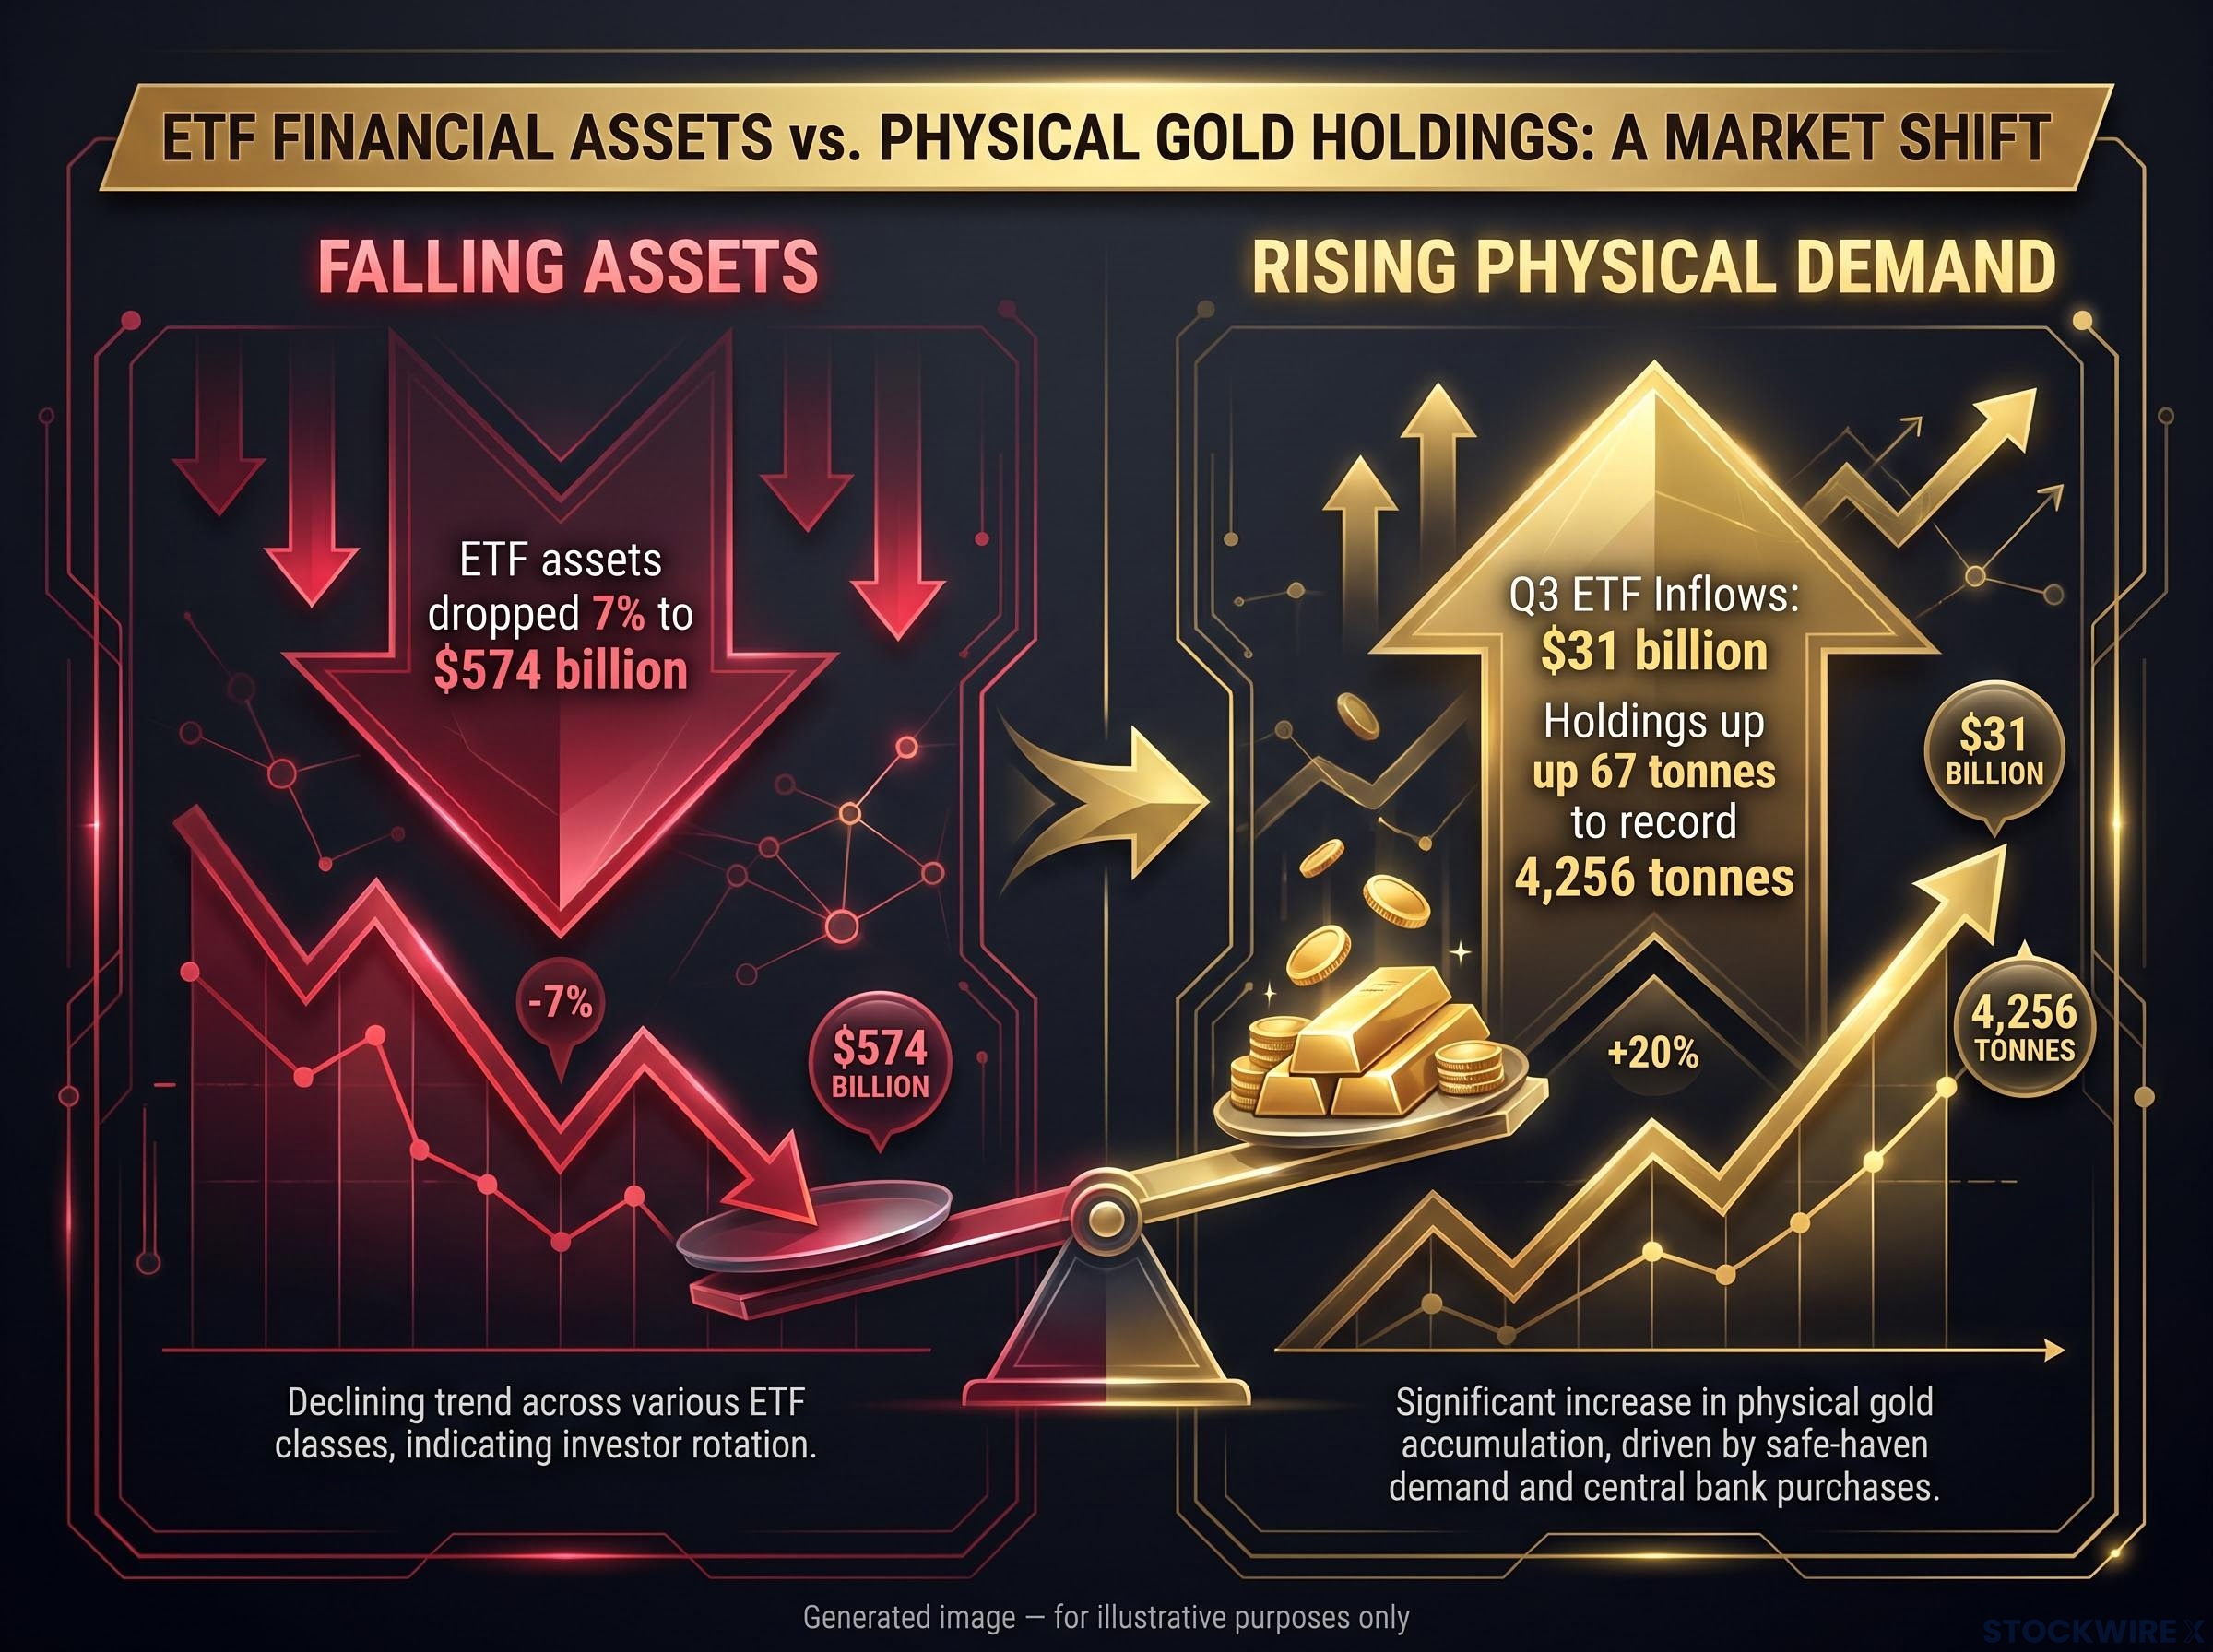
That tells you demand is being repriced, not abandoned. Central banks reinforce the point: Goldman Sachs estimated official buying of 79 tonnes in August, more than four times the pre-2022 monthly average (unverified).
Official buying has been structural rather than tactical: central-bank demand topped 1,000 tonnes a year for three straight years, a scale that helps explain why dips tend to attract buyers.
Miners are the sharpest test. Reich puts gold down about 25% and the VanEck Gold Miners ETF (GDX) down 29%, a narrow gap he reads as bullish because miners historically fall 150-200% of gold’s decline. Unverified data shows GDX at $81.02 on 26 October versus $94.20 on 30 January, about 14% lower; the difference comes from measuring against a January close rather than the peak.
The institutional split looks like this:
- Bullish: UBS’s chief investment office is constructive over 12 months and expects dip-buyers near $4,000 (unverified).
- Bullish: Record ETF tonnage and central-bank demand point to an ongoing accumulation cycle.
- Cautious: A Reuters poll cut its 2026 median forecast to $4,495 (unverified), citing high yields and a stronger dollar.
- Sceptical: Official buying can cushion a fall without preventing sharp corrections in futures, ETFs or miners.
If the bullish reading proves wrong, miner holders are the most exposed.
Can history tell us what happens below $4,000? The 2008 playbook and holding-period rules
Three past episodes offer a test for today.
| Episode | Main driver | Gold outcome | Miner outcome | Parallel to today |
|---|---|---|---|---|
| 2008 | Liquidity scramble, margin calls | Fell, then recovered strongly | Fell harder than bullion | Strong if forced selling drives the fall |
| 2013 | Expectations of less accommodation | Fell sharply | Much deeper drawdown | Shows a secular bull can endure a severe bear phase |
| 2022 | Real yields, strong dollar | Held up better than risk assets | Underperformed on costs | Partial; today has record ETF and central-bank demand |
Reich ties the Q3 2008 drop to unusual forces: a ban on shorting financials forced short covering while commodities crashed. Today resembles that liquidity phase only if forced selling is the driver, and it resembles the later recovery only if policy turns back toward easing.
He offers a striking hypothetical. If the S&P 500 fell 30%, gold equities could double before the index recovers 10-15%.
What a break below $4,000 would involve
A clean break could trigger stop-loss orders, futures deleveraging and ETF redemptions feeding on each other. Against that, UBS expects structural buyers to step in around the same level.
Reich’s downside case is a 2-3 month drift toward roughly $3,600, with miners likely hit harder. Treat it as a possibility, not a forecast.
Whether that move is survivable depends on your horizon, not the daily price:
- Bullion: strategic monetary insurance held across a full cycle, accepting multi-month or multi-year stagnation.
- ETFs: similar purpose, but you must tolerate mark-to-market swings even when demand is healthy.
- Miners: leveraged cyclical equities; Reich suggests holding at least 3-5 years, citing Rick Rule’s experience of 50% drawdowns in stocks that ultimately won.
Past performance does not guarantee future results, and these scenarios are speculative and subject to change with market conditions.
For investors weighing the bullion-versus-miners split, our deep-dive into one fund manager’s gold-heavy allocation covers why bullion beat a major producers ETF in 2023 and 2024.
The bull market is bruised, not proven broken: what to watch next
Momentum has broken, and the correction carries real risk. The bearish case is serious: a roughly 28% fall, higher long-term yields, a firmer dollar, leveraged liquidation and the chance of a $4,000 break.
Yet the structural evidence has not reversed. Record ETF tonnage, continued central-bank buying, UBS’s constructive stance and Reich’s three drivers all remain in place, with French and Brazilian stress hinting at renewed demand for monetary protection.
Three signposts will settle the argument:
- Whether $4,000 holds on a closing basis
- Whether Fed hike expectations keep softening
- Whether sovereign and credit stress continues to build
Several figures cited here remain unverified, so weigh them accordingly.
This article is for informational purposes only and should not be considered financial advice. Investors should conduct their own research and consult with financial professionals before making investment decisions.