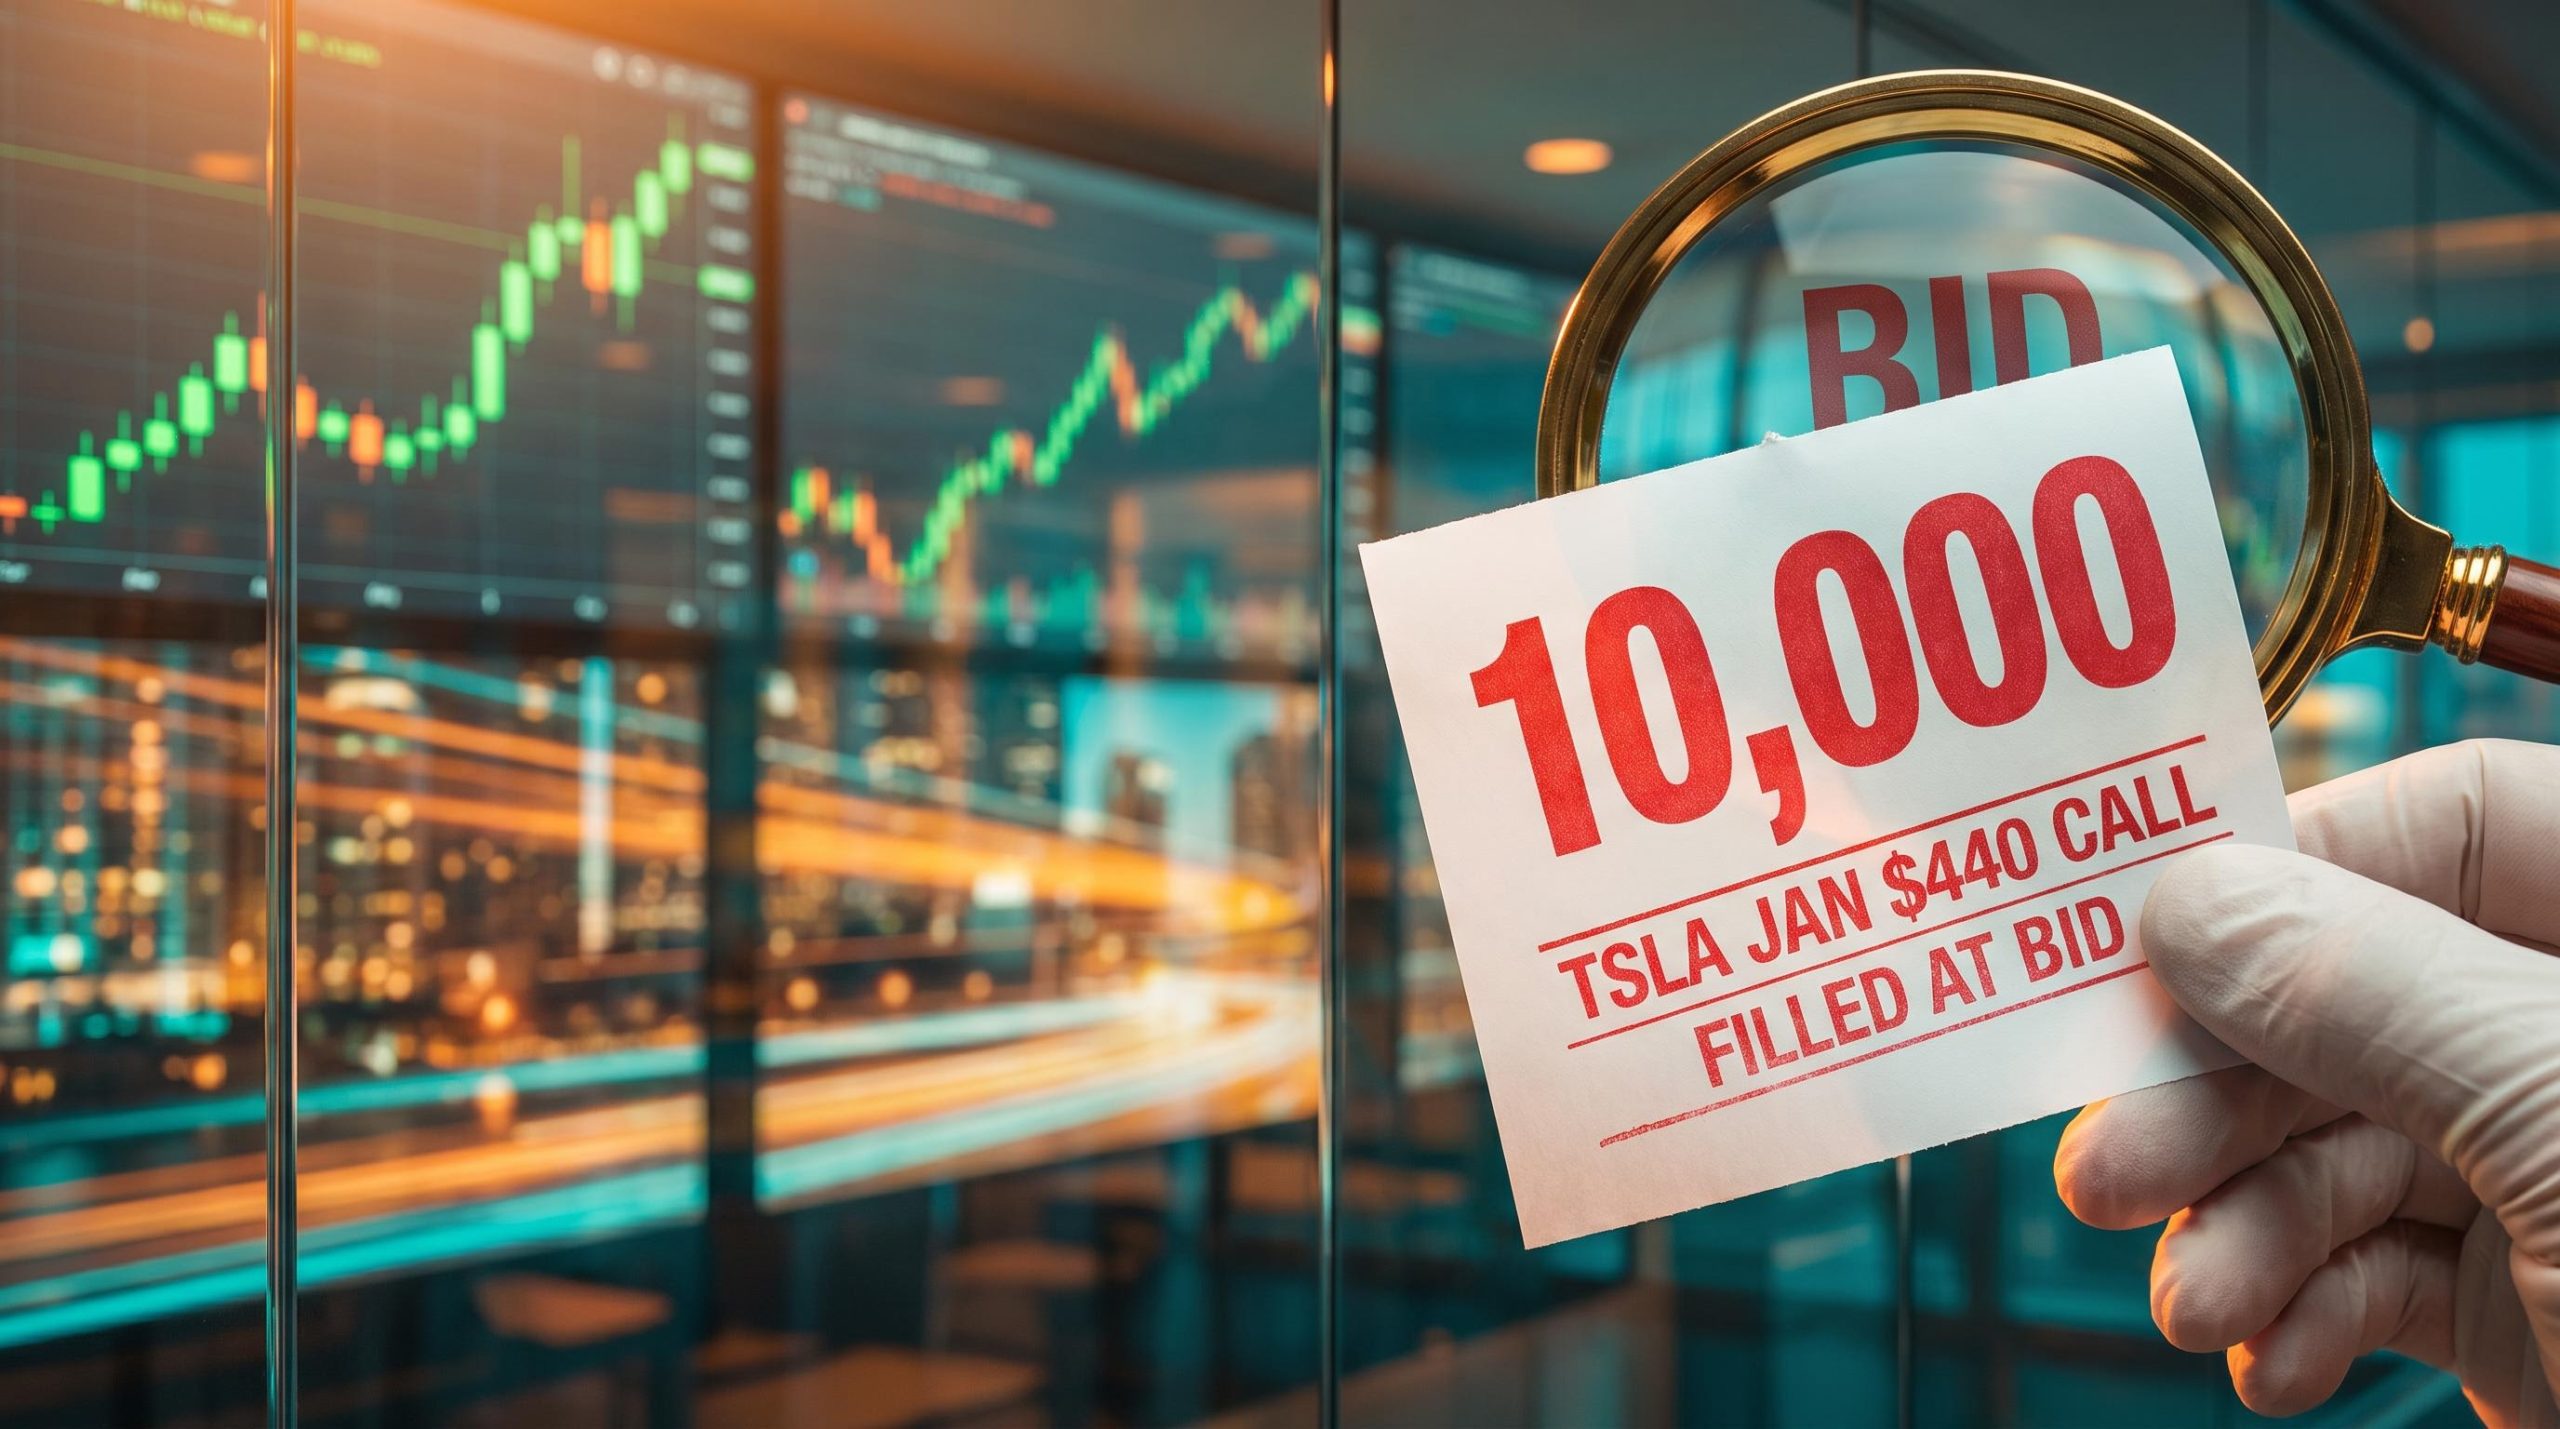
A 10,000-contract block of Tesla call options sounds like someone placing a very large bullish bet. The tape says something less certain. Bullflow reported the January $440 block as filled at the bid, which means nobody can yet prove the trade was a purchase at all.
That uncertainty sits on top of an unusual pricing backdrop. Tesla is trading just above $400 after a rally driven by Tesla-SpaceX merger speculation and a Barclays upgrade to Overweight with a $450 price target.
Options on the stock look inexpensive by recent standards. IV rank is low, and 25-delta call skew sits at a 90-day low. For anyone weighing upside exposure, the real question is whether cheap actually means cheap.
This piece gives you a practical way to judge whether current pricing favours buying upside. It also gives you a quick read on implied moves for this week’s major earnings reports, so you have something to compare Tesla against.
What does the January $440 print actually tell you?
The headline is simple. About 10,000 contracts of the 15 January 2027 $440 calls changed hands on 26 October, the largest reported Tesla options block in Bullflow’s data. It was part of a heavy session: 1,486 Tesla options trades carrying roughly $215.7 million in premium.
Then the certainty starts to slip. SpotGamma put the premium at about $10 million, while Bullflow recorded about $14.4 million. Neither figure is necessarily wrong. Vendors capture different execution prices, select trades differently and take snapshots at different moments.
The bigger issue is where the trade printed.
The bid-side caveat Bullflow reported the $440 block as filled at the bid. Buyers typically pay the ask, so a bid-side fill weakens the case that someone opened a fresh bullish position.
A block of this size could be any of the following:
- A new purchase of upside exposure
- A sale of calls, possibly to collect premium
- A closing trade on an existing position
- A roll from one strike or expiry into another
- One leg of a spread or other multi-leg order
SpotGamma’s data adds one more layer. Dealers are short roughly 12,000 calls at the 440 strike and 24,000 at the 500 strike. That tells you where dealer exposure sits, not what the original trader expects.
The safe reading is that a very large transaction occurred. Treat it as one input, and never as a signal to copy. (For transparency, the SpotGamma commentator who flagged the trade is long Tesla stock but holds no Tesla calls.)
Why the SpaceX call figure deserves extra caution
SpotGamma’s scanner also reported about $4 million of SpaceX November $150 calls being bought. No attributable flow report confirmed that size or premium. The merger speculation behind it is public and documented. The options flow is not, so give it less weight.
When big ASX news breaks, our subscribers know first
Is Tesla volatility cheap, or just quiet?
If the block cannot tell you direction, the price of the options themselves might tell you something. The most appealing signal here is a low IV rank.
Implied volatility (IV) is the level of future price movement that option prices are currently building in. IV rank shows where today’s implied volatility sits within its own range over a past period, usually a year. A low rank means options are pricing less movement than they usually have.
Every vendor reports a low number, but no two agree on which one.
| Source | Metric | Reading | Date |
|---|---|---|---|
| SpotGamma dashboard | IV rank | 4.78% | 11 October 2026 |
| Options Analysis Suite | IV rank / ATM IV | 11.4% / 39.5% | 23 October 2026 |
| SpotGamma commentary | IV rank / risk reversal rank | 7 / 20 | 27 October 2026 |
| OptionsBand | ATM IV, 28 October expiry | 53.2% (implied one-day move ±2.6%) | 27 October 2026 |
The OptionsBand figure measures a single near-term expiry, so it is not comparable with a full-term IV rank. The gaps elsewhere reflect timestamps and methodology, which is normal.
The vendor gaps also hint at a method problem: IV rank relies on only two extreme points in a year, so a single past spike can distort it, which is why IV percentile is often checked alongside it as a confirmation read.
What matters is the shared direction. Tesla option premiums are near the cheaper end of their range. That alone does not give you an edge, because SpotGamma’s own guidance notes that a low rank can mean cheap options, a quieter expected period, or a catalyst the market has not yet repriced.
Before you call the volatility cheap, ask three questions:
- Is a known catalyst approaching that the options have not priced in?
- Has realised movement been as subdued as implied volatility suggests?
- Could a headline lift IV briefly, then let it collapse?
What does the cheapest call skew in 90 days signal?
Low IV tells you the overall price of options. Skew tells you how that price is split between upside and downside.
25-delta call skew compares the implied volatility of a moderately out-of-the-money call with that of an equivalent put. A risk reversal is a trade that buys one side and sells the other, and SpotGamma uses that call-versus-put gap to frame skew.
The pattern is clear in SpotGamma’s data. Put skew is relatively rich, while 25-delta call skew is cheaper than at any point in 90 days for both one-month and January options. The commentator reads that combination, alongside the large call print and low IV, as an attractive upside setup.
Skew tends to describe how fast the market expects a move rather than which way it will go, and reading options skew correctly matters before treating cheap upside pricing as a bullish signal.
Reading skew without reading too much into it
Cheap call skew does not automatically mean bulls are absent. Call skew moves for several reasons:
- Call spreads, where traders buy one upside call and sell another
- Risk reversals that pair calls with puts
- Dealers marking scarce upside options more expensively
- Hedging of short-stock or synthetic-short exposure
- Institutional upside participation financed by selling downside volatility
SpotGamma’s scenario for a reversal is meme-style retail buying. If that wave arrives, call skew could rise and lift the value of existing call positions.
Two precedents, two lessons A 2026 academic study ties Tesla’s 2020 rally to the retail and meme-stock boom, with call demand reinforcing the climb. By late 2021, Tesla’s options footprint exceeded all S&P 500 companies combined except Amazon, yet valuation and reversal risk remained.
For you, cheap call skew means upside convexity (the ability of a call to gain value faster as the stock rises) costs less relative to downside protection right now. That is a pricing condition, not a forecast. It may favour outright calls over spreads, but only if you already hold an upside view.
Where could dealer gamma and merger headlines move Tesla next?
Skew describes what options cost. Dealer gamma describes how the hedging behind those options can push the stock itself.
Gamma measures how quickly an option’s sensitivity to the stock price changes. When dealers are positive gamma, they tend to sell into rallies and buy dips, which dampens movement. When they are negative gamma, they buy as the stock rises and sell as it falls, and Cboe research describes that hedging as able to exacerbate price swings.
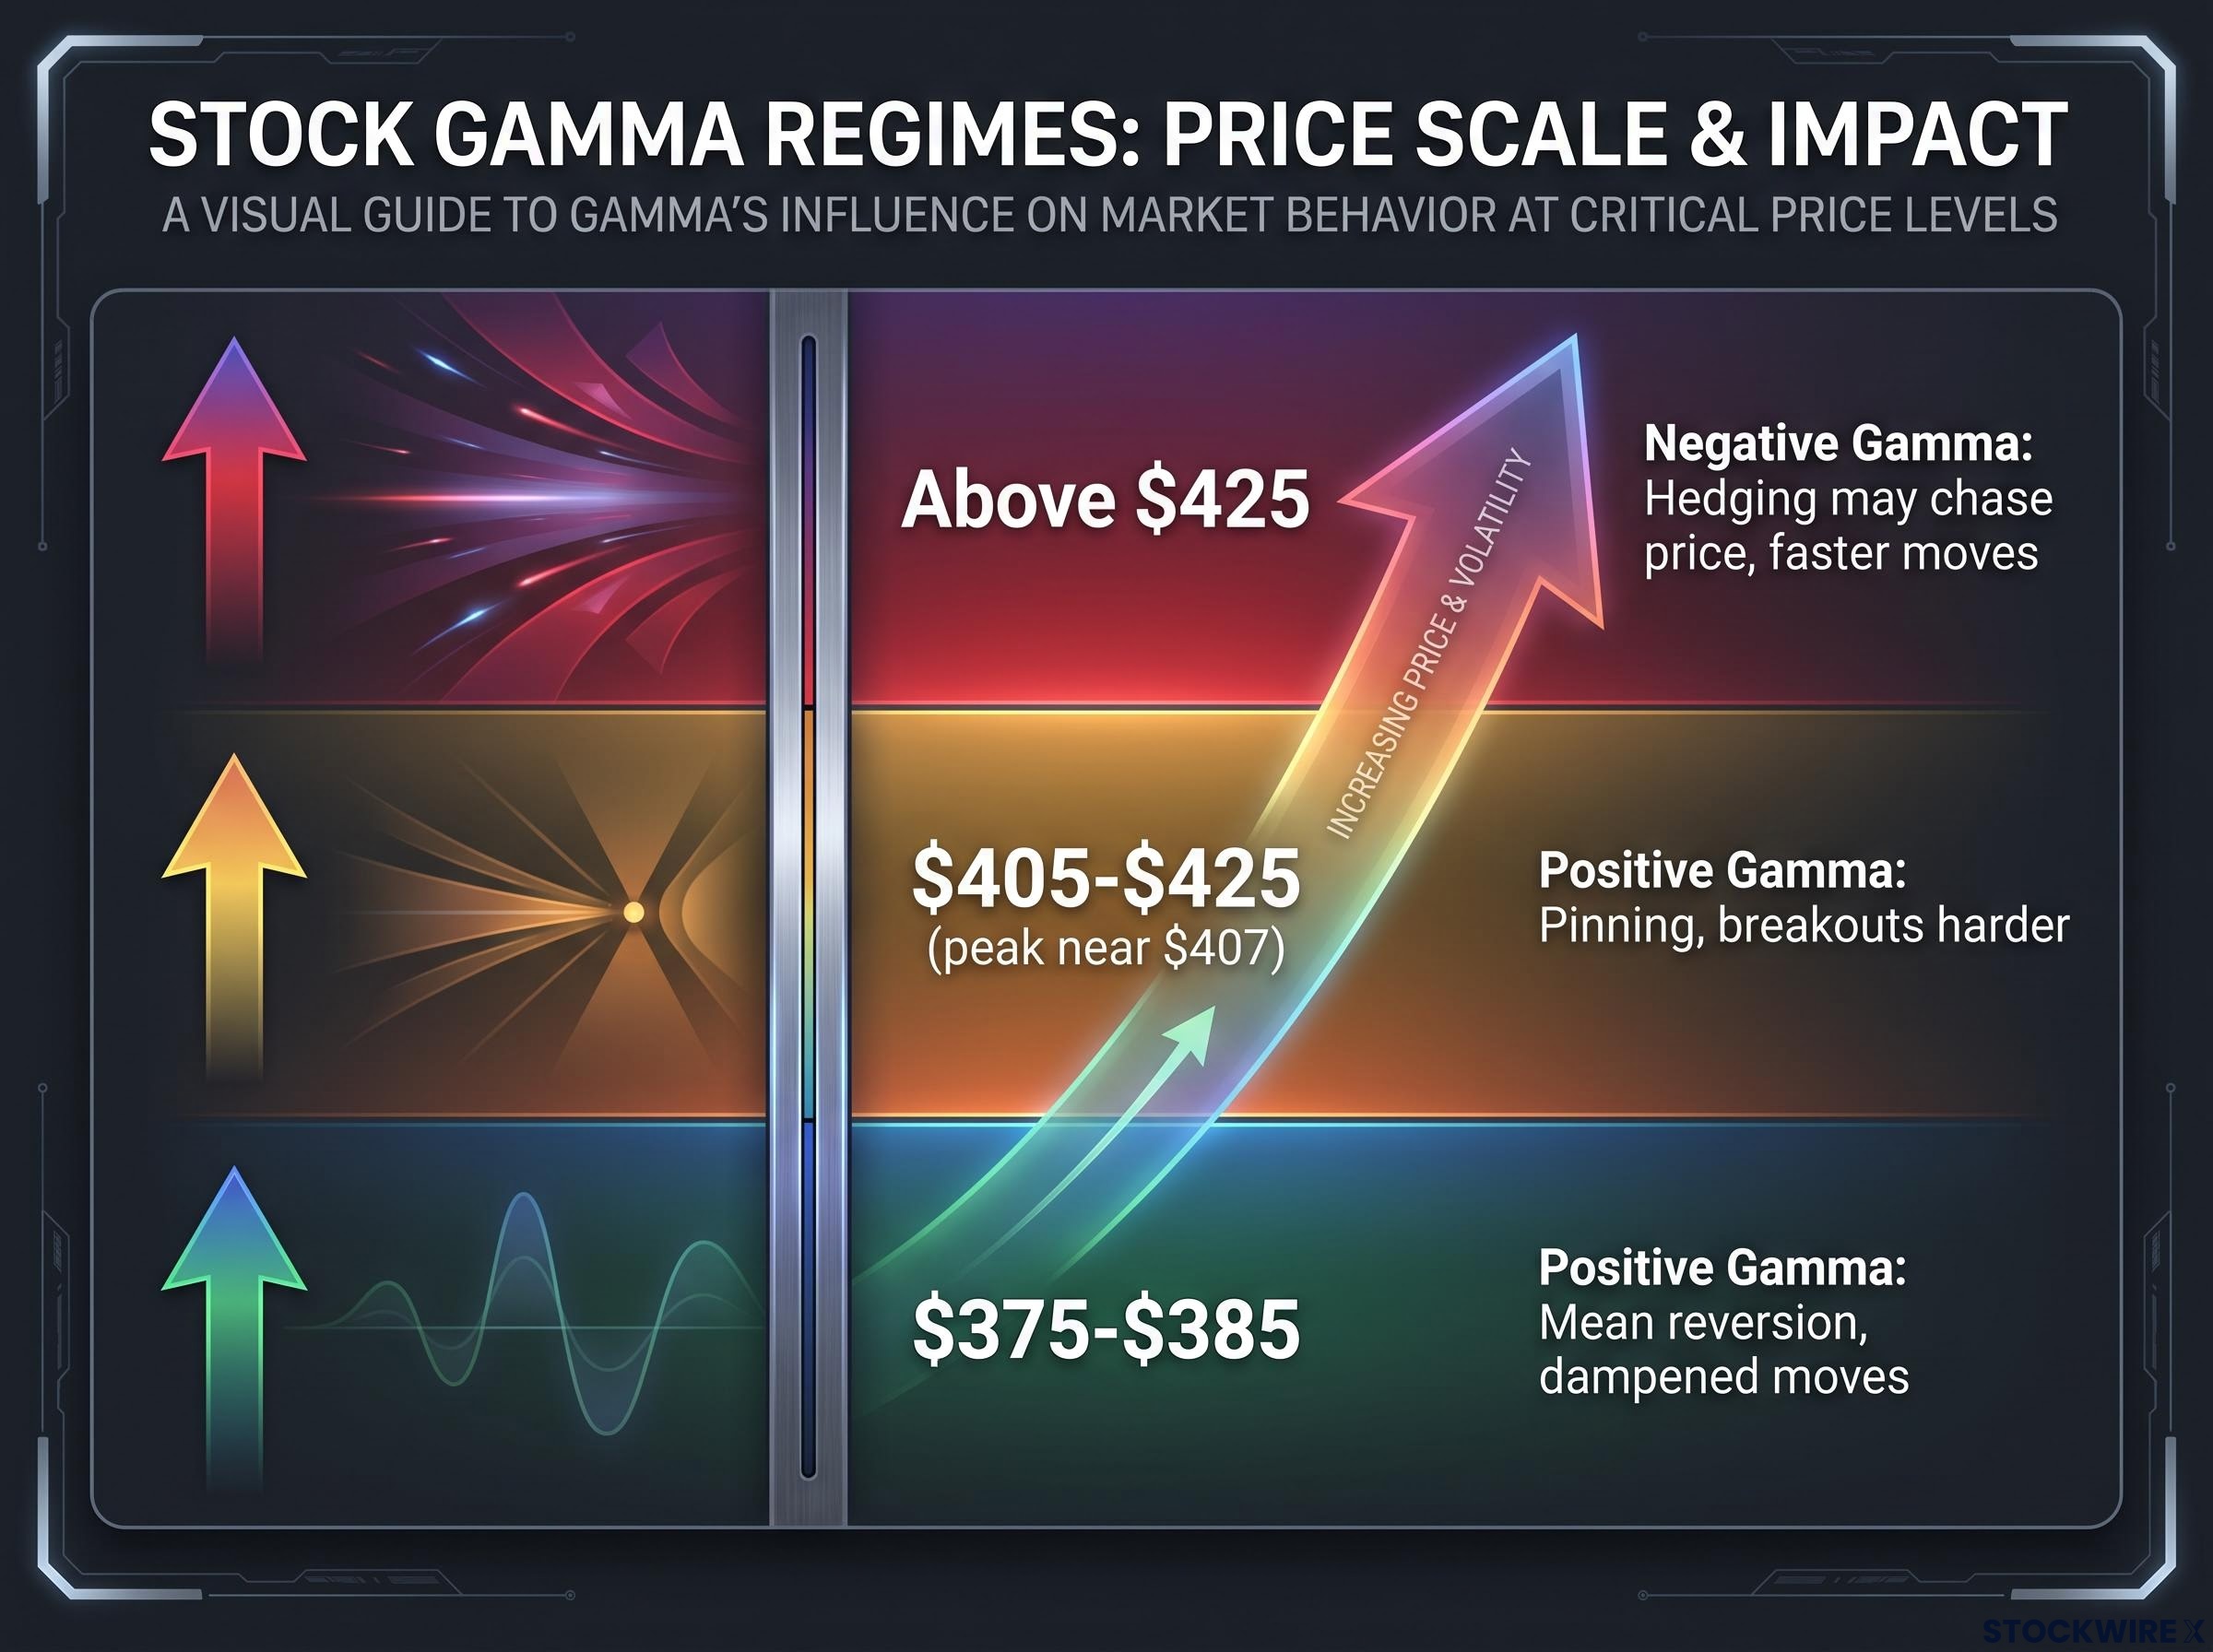
SpotGamma maps Tesla’s zones as follows. These are behavioural zones, not guaranteed support or resistance.
| Price zone | Gamma regime | Likely behaviour |
|---|---|---|
| $375-$385 | Positive | Mean reversion, dampened moves |
| $405-$425 (peak near $407) | Positive | Pinning, breakouts harder |
| Above $425 | Negative | Hedging may chase price, faster moves |
With Tesla just above $400, the stock sits near the stabilising band. Recent momentum has been strong: web reporting cited a roughly 5% rise on 26 October, while SpotGamma described a gain of about 3% on the morning of 27 October, and these appear to be separate sessions.
With roughly 90% of options trades having a market maker on the other side, dealer hedging can account for much of a stock’s movement, though research suggests the gamma effect is real but modest.
A single headline could change the regime. Heavy retail call buying leaves dealers short calls, and their hedging requires buying stock as Tesla rises.
Merger rumour: what is confirmed and what is not
- 20 October: Elon Musk called a Tesla-SpaceX merger “a good idea”, and special committees formed to examine a combination (Reuters).
- 21 October: Musk said nothing had been agreed and a deal was not guaranteed (BBC).
- 22 October: A SpaceX filing stated “no determination by our special committee has been made” (Reuters).
Any deal would need approval from the special committee, the board and Musk as controlling shareholder. There are no terms and no confirmation.
For your positioning, a break above $425 into negative gamma could accelerate gains. If the headline fades, IV can collapse and hurt call holders even if Tesla holds its higher level.
What are the real risks of buying cheap calls, and what do the week’s earnings imply?
The Options Industry Council notes that an option’s value depends on the stock price, time remaining and implied volatility. Each one can work against you. Ordered by how often they hurt retail buyers:
- Theta decay: options lose value daily, faster near expiry.
- IV crush: volatility can fall sharply after a catalyst passes.
- Strike risk: the January $440 call expires worthless if Tesla finishes below $440, regardless of any interim rally.
- Bid-ask spreads: far-out strikes can carry wide spreads.
- Headline-gap risk: merger news can gap the stock up, then reverse it.
- Full-premium loss: your maximum loss is everything you paid.
Reading implied moves across vendors
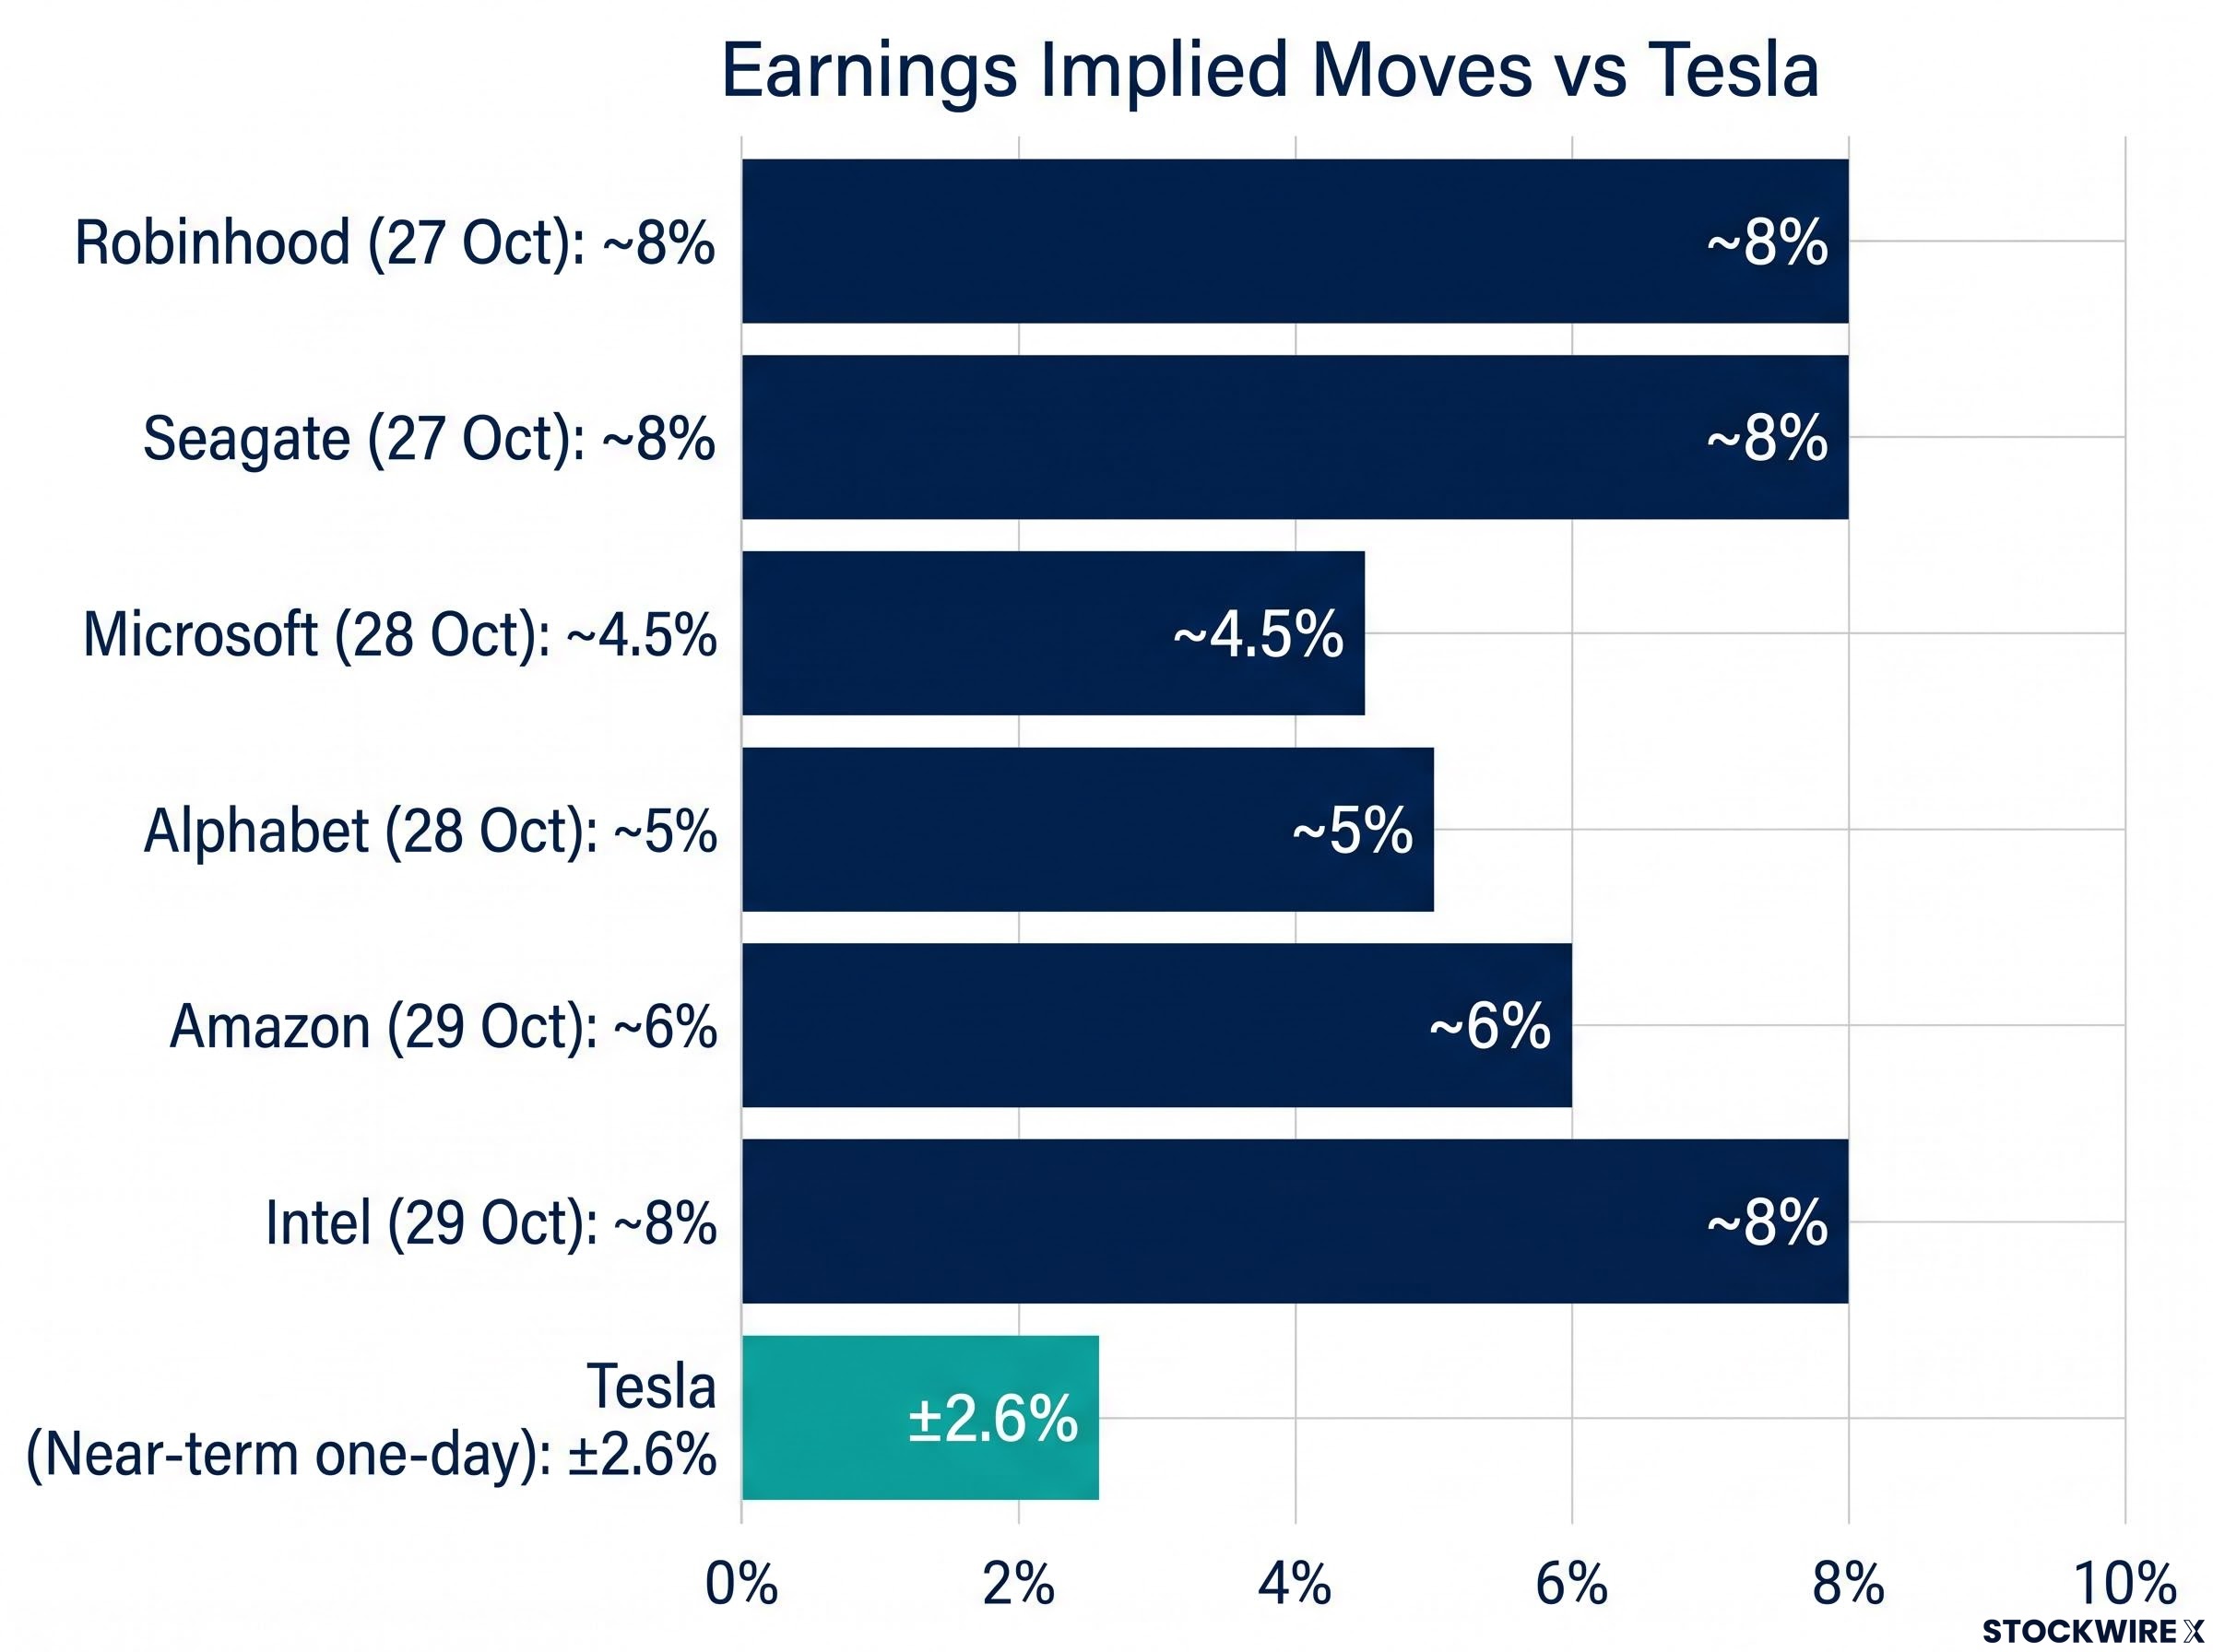
This week’s earnings give you a benchmark for how the market prices event risk. All six report after the close.
| Company | Report date | SpotGamma | OptionWiz | Benzinga |
|---|---|---|---|---|
| Robinhood | Tue 27 Oct | ~8% | ±9.5% | ±12.28% |
| Seagate | Tue 27 Oct | ~8% | Not reported | Not reported |
| Microsoft | Wed 28 Oct | ~4.5% | ±5.3% | ±4.86% |
| Alphabet | Wed 28 Oct | ~5% | ±6.1% | ±5.66% |
| Amazon | Thu 29 Oct | ~6% | ±7.7% | ±7.22% |
| Intel | Thu 29 Oct | ~8% | ±9.5% | ±10.54% (later ±12.98%) |
SpotGamma also flags high IV for Microsoft and Alphabet, with only about a 10-point contraction expected after results. Robinhood’s range, from about 8% to ±12.28%, shows how far vendors can diverge.
Implied moves are estimates. Compare relative size across names rather than anchoring on one number, and you will see that Tesla’s near-term ±2.6% one-day move sits well below these event-driven peers.
Options signals around earnings have missed in both directions, with realised moves landing far from implied ones in multiple past reports.
Past performance does not guarantee future results. Implied moves and price projections are subject to market conditions and various risk factors.
Weighing cheap Tesla upside against what the data cannot prove
Low IV rank and cheap call skew make Tesla upside inexpensive relative to its own history. The evidence around it is weaker: a bid-side block of unknown direction, an unconfirmed SpaceX figure and a merger story with nothing agreed.
If you are weighing exposure, work in order. Define your view and timeframe first. Then choose a structure that fits what skew is charging (an outright call, a spread or a risk reversal), size the position so losing the full premium is acceptable, and pick an expiry that sits beyond the catalysts you are betting on.
From here, watch whether call skew and IV rank begin to lift, how Tesla behaves around $407 and above the positive-gamma band, and whether any formal merger announcement or denial arrives.
This article is for informational purposes only and should not be considered financial advice. Investors should conduct their own research and consult with financial professionals before making investment decisions.