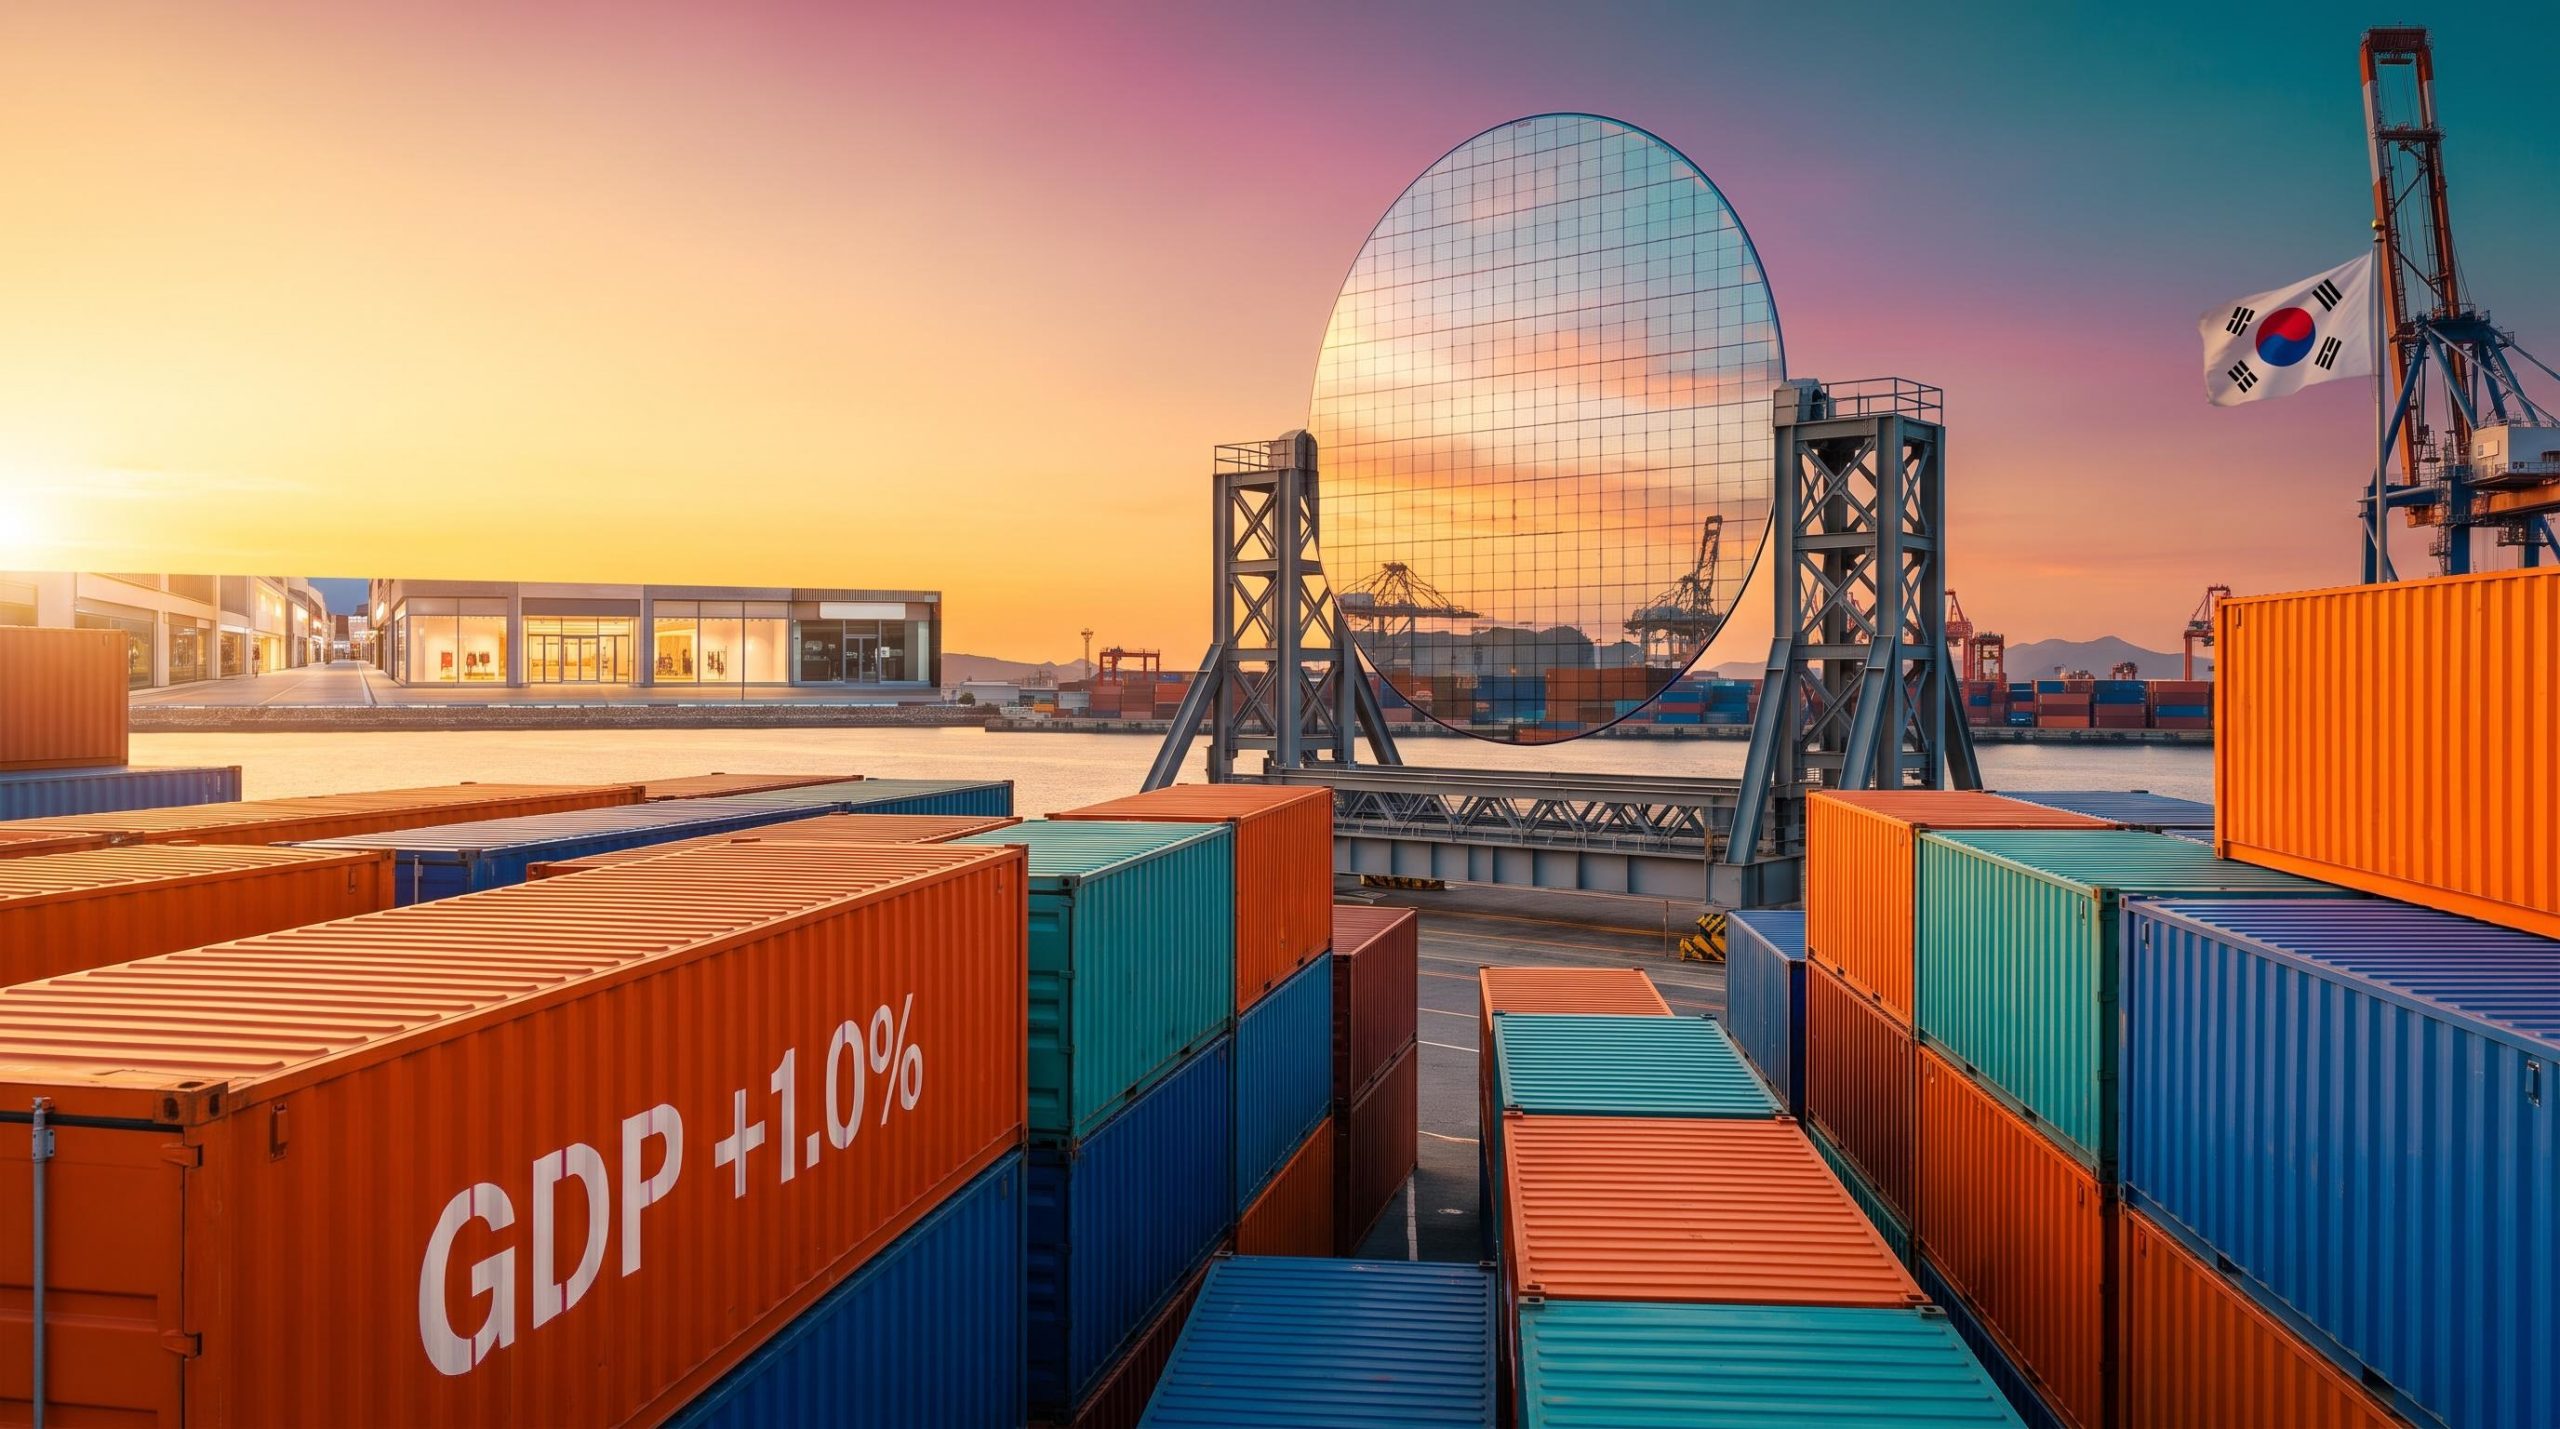
South Korea’s economy grew 1.0% in the third quarter, comfortably ahead of the 0.7% that economists had pencilled in. Yet in the same quarter, Korean households spent less than they did in the three months before, the first drop in private consumption in nearly four years.
That split is the signal the headline South Korea GDP number hides. A strong growth print and a retreating consumer are sitting side by side.
The Bank of Korea (BOK) published its advance estimate on 27 October 2026, five days after holding its policy rate at 3.00%. DBS responded within hours by lifting its growth forecasts for both 2026 and 2027. The question is whether this beat marks a broad recovery or a narrow, chip-powered surge that the rest of the economy has not yet joined.
Here is what the component data tells you about the durability of the AI-driven cycle, why DBS chose to upgrade, and which indicators should shape your view from here.
What did South Korea’s third-quarter GDP beat actually show?
On the surface, the quarter looked like a clean win. Real GDP rose 1.0% quarter-on-quarter against a 0.7% median forecast in a Reuters poll of 16 economists, and 3.4% year-on-year against 3.0% expected. Real gross domestic income, which adjusts for changes in the prices a country gets for its exports relative to what it pays for imports, jumped 3.4% q/q and 18.8% y/y.
Then the components arrive, and the picture tilts.
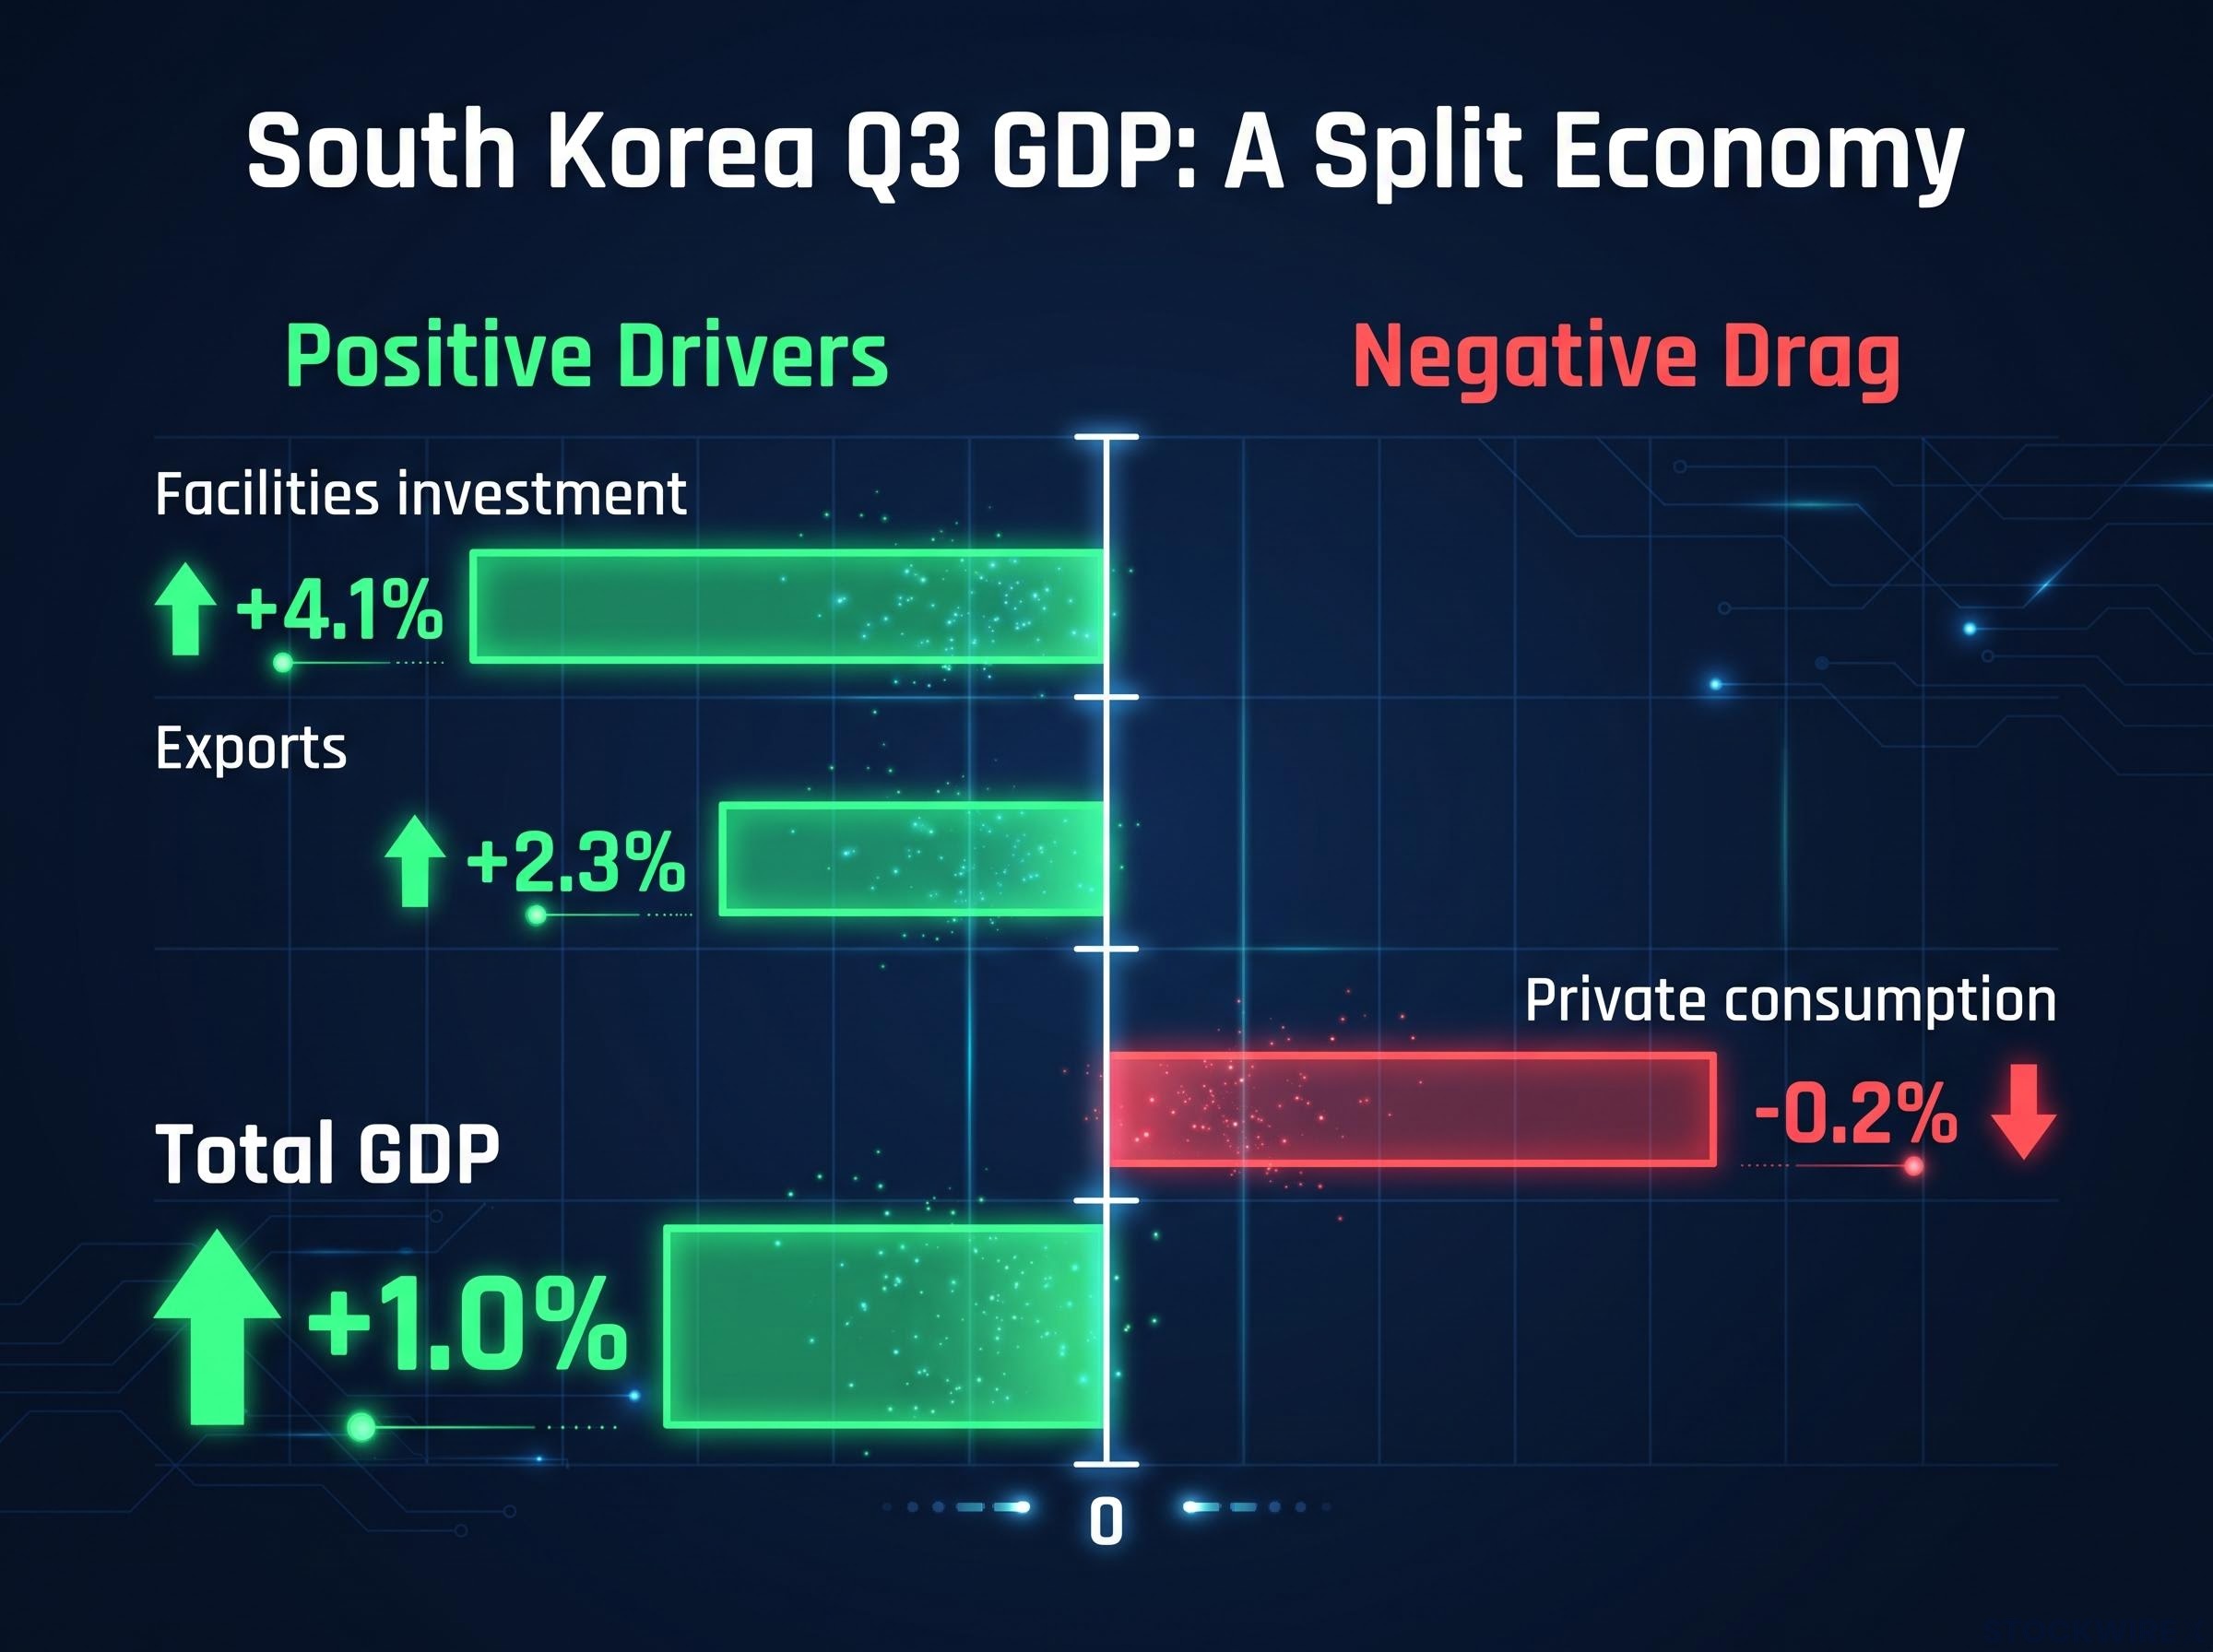
Exports rose 2.3% and facilities investment climbed 4.1%, led by semiconductor-manufacturing equipment. Private consumption fell 0.2%. Construction investment was not disclosed in the primary releases, so its contribution remains unknown for now. All figures are preliminary.
DBS presents the same quarter on a seasonally adjusted annualised rate (saar) basis, which scales a single quarter’s change up to a full-year pace. The two sets are different lenses on identical data, not competing results.
| Component | Q3 result (q/q, BOK) | DBS saar figure | Driver |
|---|---|---|---|
| GDP | +1.0% | +3.9% (vs 5.0% Q1-Q2 average) | Exports and investment |
| Exports | +2.3% | +9.6% | Semiconductors, machinery, electrical equipment |
| Private consumption | -0.2% | -1.0% | Equity correction, car strikes |
| Facilities investment | +4.1% | Not provided | Chip-manufacturing equipment |
The annual trend is also easing, from 3.8% y/y in Q1 to 3.7% in Q2 and 3.4% now.
DBS view: Ma Tieying, economist at DBS Group Research, said the data confirm that the AI-driven growth cycle remains intact.
What this tells you is that the headline rate overstates how widely gains are shared. Read the print through its parts, not as one number.
Why consumers pulled back
The KOSPI fell 18.83% between July and October. The slide followed new leveraged-ETF rules: from 16 July, new single-stock leveraged products were banned from listing, and the minimum deposit for new investment rose to KRW 30 million. Weaker financial-services activity and fewer car purchases, amid strikes at major automakers, added to the drag.
The Kospi slide that weighed on household wealth was concentrated in a few names, with Samsung and SK Hynix accounting for roughly 70% of the market capitalisation lost, which helps explain why the consumption hit arrived alongside record chip exports.
When big ASX news breaks, our subscribers know first
How does the AI chip cycle turn into Korean growth?
The number on screen is hard to ignore. Korea Customs Service final data show September exports of US$121.1 billion, up 83.7% y/y, with semiconductors at US$60.503 billion, up 260.3%. Earlier ministry figures (US$60.30 billion, +262.8%) have been superseded.
Milestone: September was the first month Korean semiconductor exports exceeded US$60 billion, nearly half of all exports.
So how does that money reach the wider economy? The chain runs in five steps:
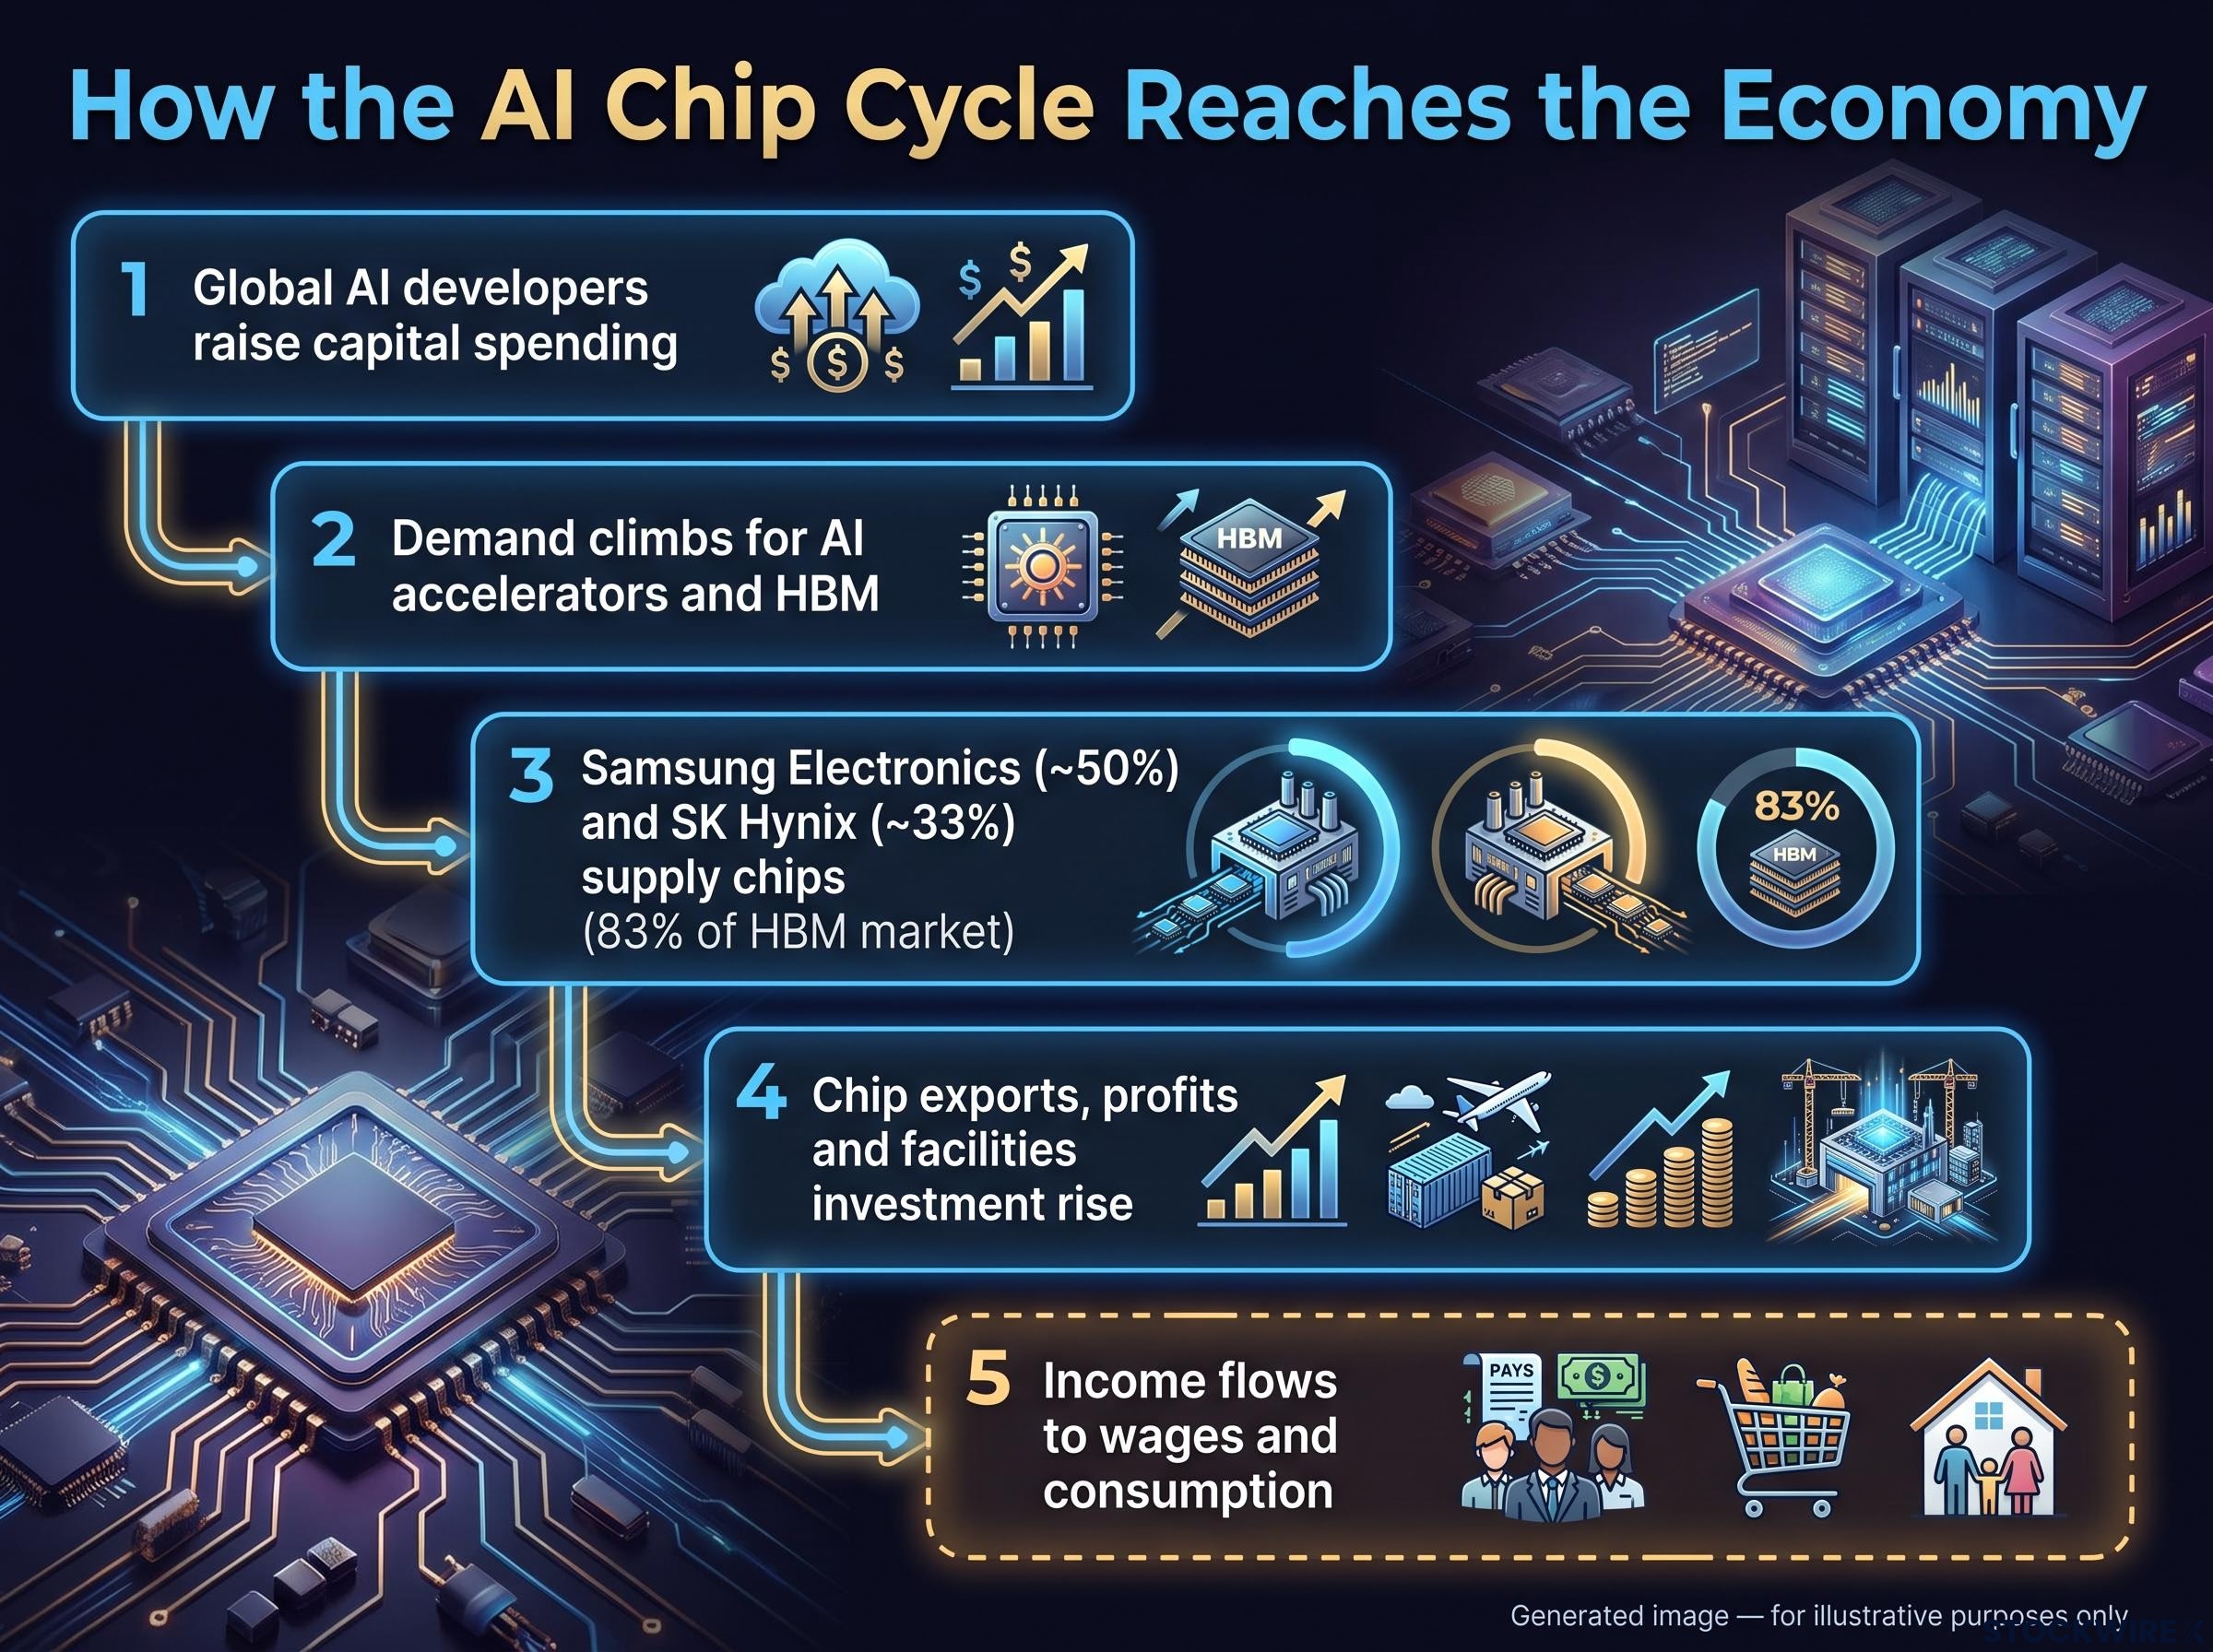
- Global AI developers and data-centre operators raise capital spending.
- Demand climbs for AI accelerators and especially high-bandwidth memory (HBM), a type of stacked memory chip that moves data to AI processors far faster than standard memory.
- Samsung Electronics and SK Hynix, which together hold roughly 83% of the HBM market (about 50% and 33% respectively), supply the chips and expand capacity.
- Chip exports, corporate profits and facilities investment rise, helped by higher memory prices.
- Export income eventually flows into wages, dividends, bonuses, tax receipts and consumption.
The fifth link is the slowest and least certain. That is why record exports can coexist with falling household spending: the money has reached steps three and four, but you should not assume it has reached step five yet.
Structural boom or cyclical peak?
- Structural reading: reflected in the DBS and BOK export outlooks, AI infrastructure is a multi-year build-out rather than an ordinary memory upswing.
- Cyclical reading: Korea remains exposed to a memory and capex boom, where prices, inventories and orders can reverse quickly if customers cut spending or supply overtakes demand.
Investors exploring the structural case should read our deep-dive into HBM demand as a structural trade, which explains how per-chip memory content is rising 3.6x across GPU generations.
Why did DBS raise its 2026 and 2027 forecasts?
The upgrade follows the data logically. DBS judged that strong chip shipments and investment outweighed near-term consumption weakness, and lifted its 2026 forecast to 3.8% from 3.5% and its 2027 forecast to 2.9% from 2.4%.
Set beside peers, DBS sits at the optimistic end.
| Institution | 2026 | 2027 | Note |
|---|---|---|---|
| DBS | 3.8% (from 3.5%) | 2.9% (from 2.4%) | 27 October 2026 |
| Bank of Korea | 3.3% | 2.9% | August forecasts; October statement flagged “considerably higher” growth |
| IMF | 3.3% | Not found | Cited by CNBC, 22 October |
| Nomura | 3.6% (from 3.2%) | Not found | Upgraded in October |
| OECD / Goldman Sachs | Not found | Not found | No current figures located |
The BOK held at 3.00% on 22 October after two consecutive hikes, while signalling its own numbers are likely to rise.
The BOK’s hold also leaves a gap with swap markets, which have priced the policy rate near 3.75% within twelve months, well above the committee’s own modal projection of 3.25%.
DBS on the gap: Ma noted that the equity correction may have temporarily opened a gap between exports and investment on one side and domestic consumption on the other.
Now the complication. Even after the upgrade, DBS projects growth slowing from 3.8% to 2.9%. The upgrade tells you a leading forecaster sees the AI cycle lasting through 2027, but the slowdown tells you the strongest growth is probably being booked now.
Past performance does not guarantee future results. Financial projections are subject to market conditions and various risk factors.
What could break the story, and what should you watch next?
That projected slowdown hints at the fragility beneath the upgrade. An expansion this concentrated carries specific risks:
- Chip concentration: semiconductors are nearly half of exports.
- US trade policy: tariffs and technology controls hit an export-led model directly; the BOK cited external risks in October.
- Household debt and rates: leverage limits spending after two hikes.
- AI-capex slowdown: delayed AI returns or an inventory correction would hit HBM prices and investment hardest.
- Won moves: a weaker won lifts exporters’ earnings but raises import costs; a stronger one erodes competitiveness.
Won moves matter more than usual here, because a rally of about 16% from the early-July low squeezes exporter margins even as record chip volumes support the current account.
Lessons from 2018 and 2023
The 2018 memory boom delivered strong exports and profits that reached households unevenly, and the later downturn exposed that gap. In 2023, a chip slump hit exports while high rates and household debt held back domestic demand; recovery started with chips before broadening. The 2026 pattern is more lopsided still, with GDP rising as consumption falls. Sceptics argue the Q3 headline overstates how broad the recovery is.
Chip strength is already in the headline, so the tests that matter are consumption and export breadth. Watch these, in order:
- HBM volumes and prices, the first sign of demand turning.
- Monthly chip exports and export breadth across autos, machinery and chemicals, showing whether growth is spreading.
- Facilities investment versus construction and consumption, revealing balance in domestic demand.
- Household consumption, retail sales and credit, the final link in the chain.
- KOSPI and foreign flows, which drive the wealth effect.
- US trade policy, the largest external shock risk.
- The won and BOK policy, since stronger growth could prompt further hikes.
These statements are speculative and subject to change based on market developments and policy decisions.
What the Q3 beat confirms, and what it still leaves open
The quarter confirms a powerful AI and semiconductor upswing. It does not yet confirm a broad Korean recovery. Exports and chip investment carried the print while consumers retreated, and DBS’s upgraded path of 3.8% in 2026 and 2.9% in 2027 builds in both the strength and the coming cooling.
Your decision point rests on two or three readings. If household consumption stabilises and monthly exports broaden beyond chips, the optimism has foundations. If chip exports keep surging while consumers stay weak, the growth story remains narrower than the headline suggests.
This article is for informational purposes only and should not be considered financial advice. Investors should conduct their own research and consult with financial professionals before making investment decisions.