
A more expensive call option does not mean the market thinks a stock is headed higher. Take AMD on the day it closed at 645. A call roughly 100 points above the price, at the 750 strike, cost about $1,700. A put the same distance below, at 550, cost about $1,100.
That gap is options skew in action. The richer side tells you how fast traders think the stock could move, not which way it will go.
Upside and downside options sitting the same distance from the share price almost never cost the same. Most retail traders either ignore the gap or read it as a forecast. Misreading it costs you money. You may overpay for protection, or you may sell premium on the cheap side when the rich side was sitting right there.
Once you know how to read it, an option chain starts to show you where the market is nervous and where it is excited. This guide shows you how to spot skew on any chain in a couple of minutes, what it is signalling, and which strategies are built to take advantage of it.
What is options skew, and what is it really telling you?
Your instinct probably says that a call $100 above the stock and a put $100 below it should cost about the same. That seems fair, because the stock has to travel the same distance either way.
Run a quick test on almost any option chain and you will see that instinct break. In nearly all markets, the two sides are priced differently.
Options skew is the unequal pricing of out-of-the-money options that sit the same distance above and below the underlying price. An out-of-the-money option is one that would be worthless if it expired today: a call with a strike above the current price, or a put with a strike below it.
Your option prices all trace back to implied volatility, which is why richer strikes on one side of the chain show up as higher IV at those specific strikes, and why the gap you see between a call and a put is really a gap in assumed movement.
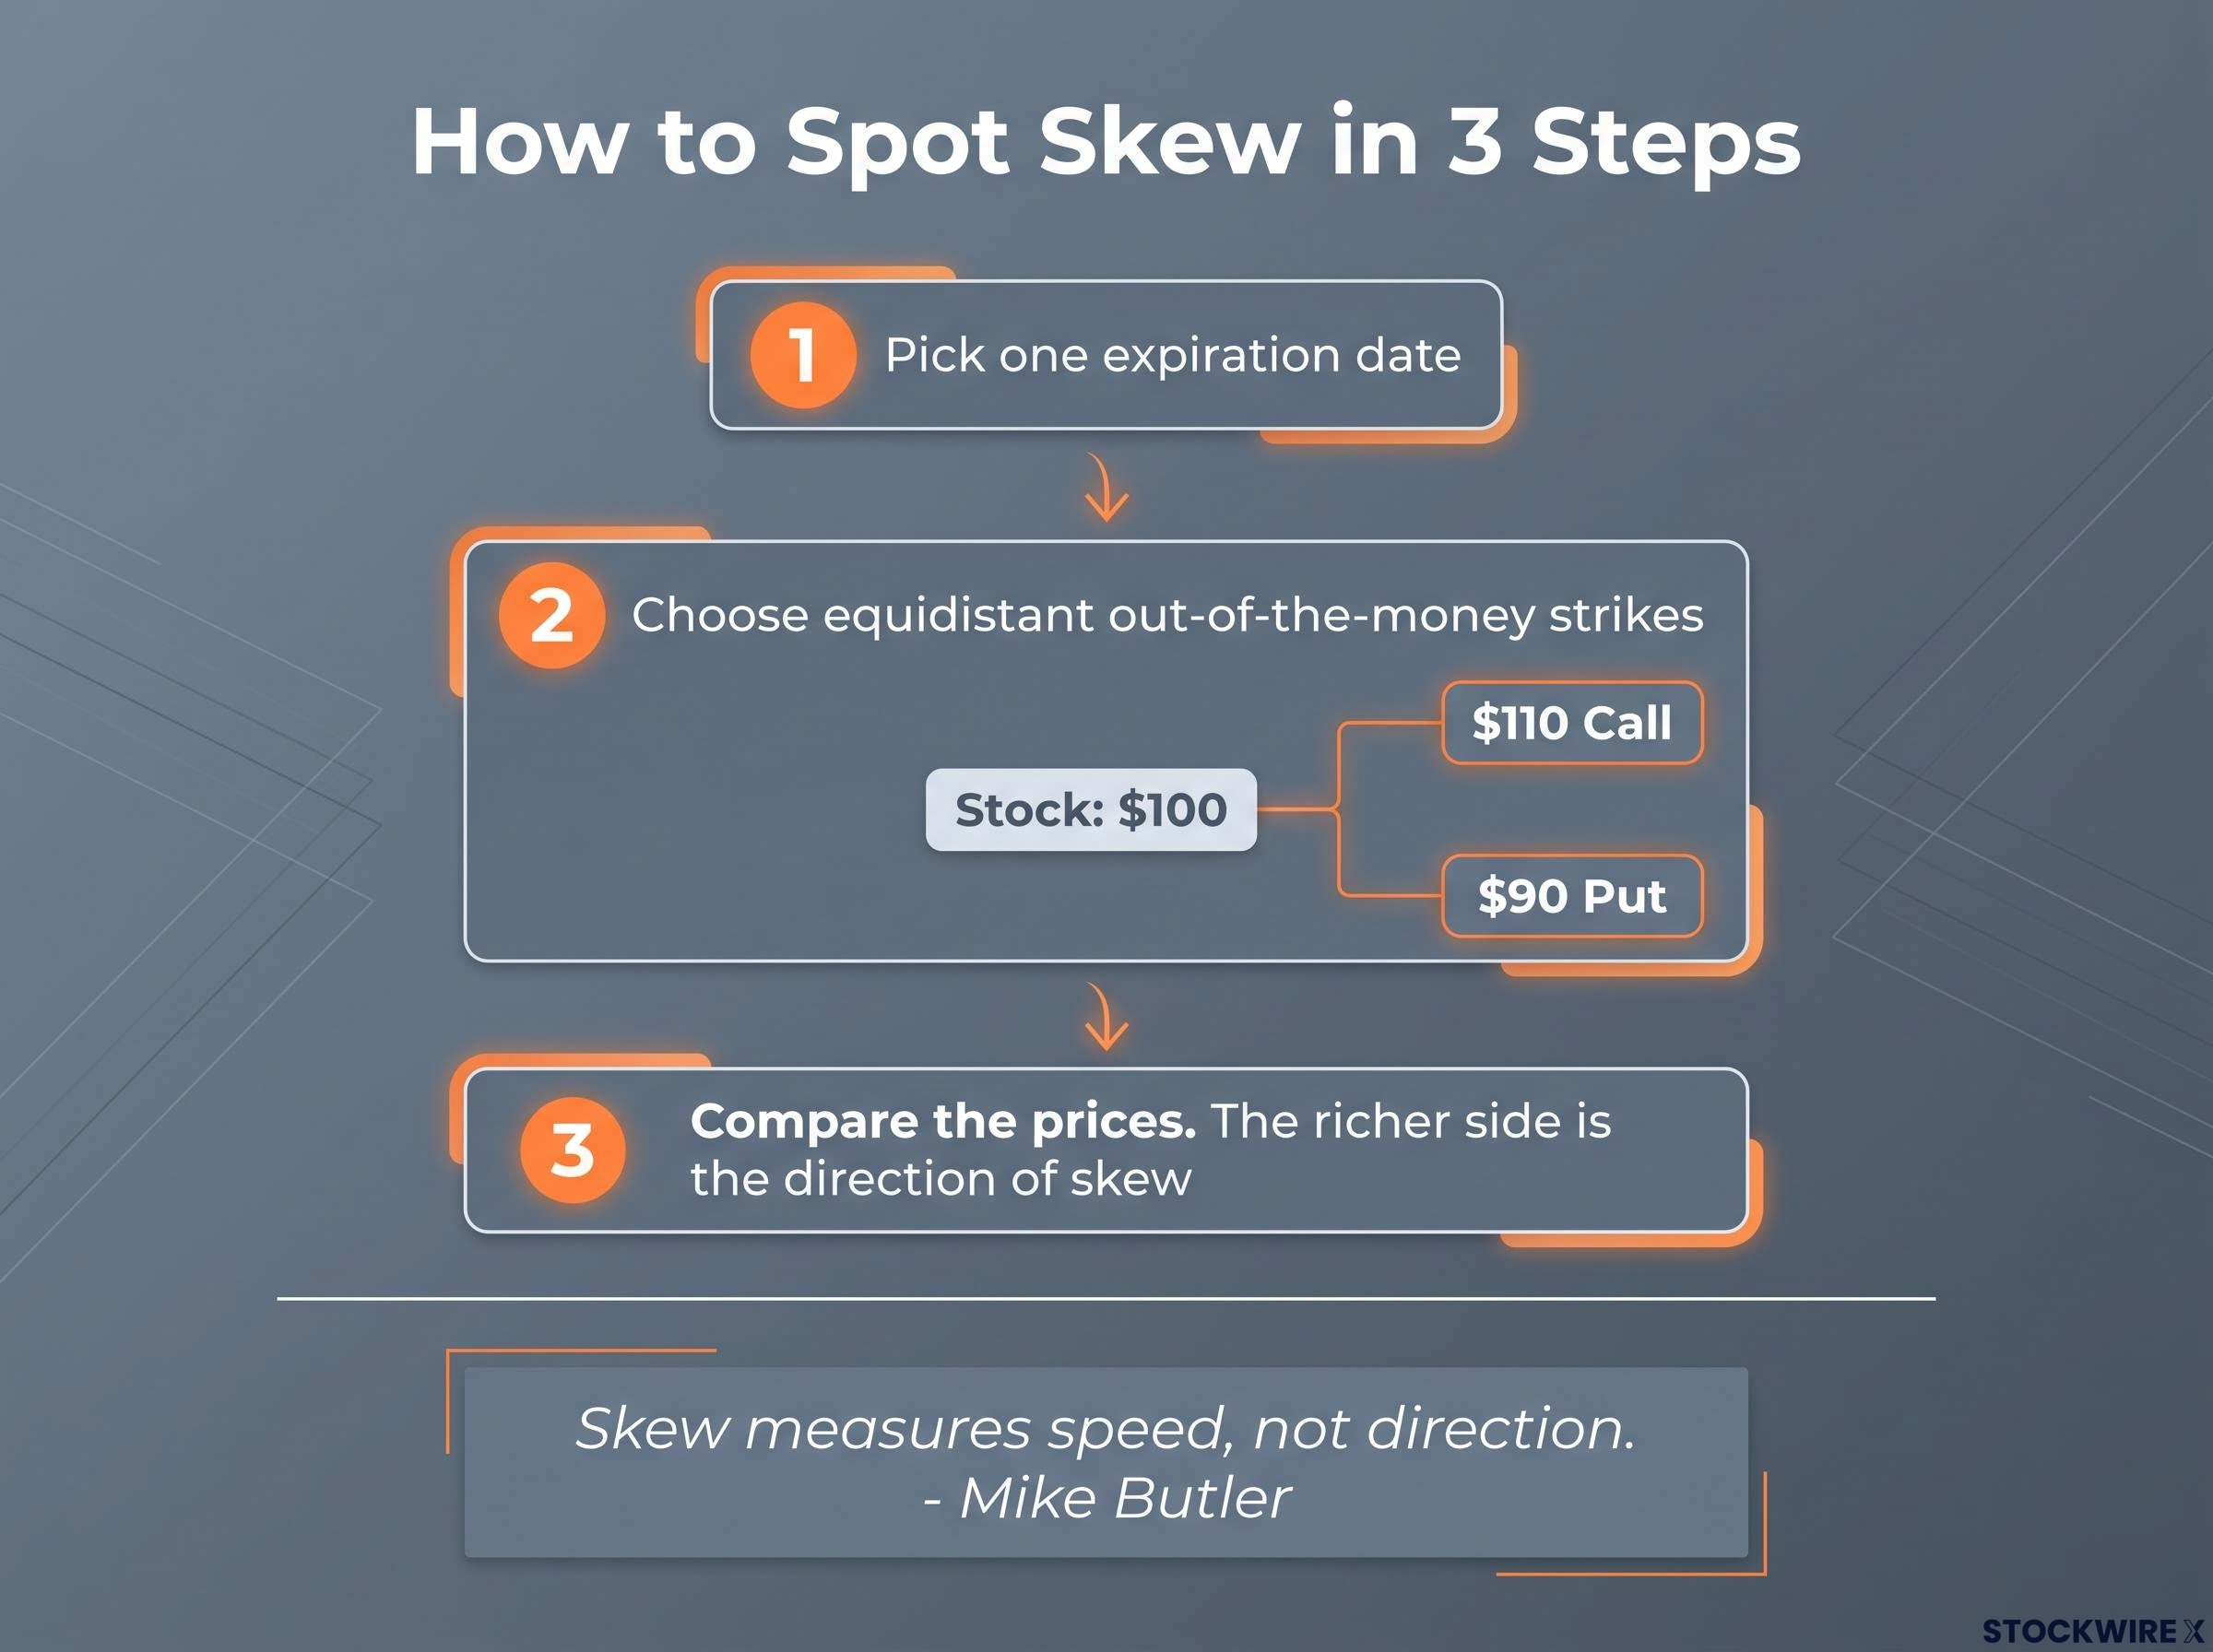
How to spot skew in three steps
- Pick one expiration date. Comparing different dates mixes in time value and muddies the reading.
- Choose equidistant out-of-the-money strikes. If the stock is at $100, compare the $110 call with the $90 put.
- Compare the prices. Whichever option costs more is the richer side, and that is the direction of skew.
That is the whole check. It takes about two minutes once you know where to look.
Call skew versus put skew
Call skew means the upside options are richer. Put skew means the downside options are richer.
Neither tells you where the price will land. Mike Butler of Tasty Live, speaking on the Options in Action programme, frames skew as a reading of perceived velocity risk.
Skew measures speed, not direction A richer side shows where the market is paying up for a fast, outsized move. It does not guarantee the underlying will move that way.
Use skew to judge how expensive protection or speculation has become on each side. Do not use it to pick a direction.
When big ASX news breaks, our subscribers know first
Why does AMD show call skew while SPX and SPY show put skew?
The easiest way to understand skew is to put two opposite readings side by side.
AMD: call skew after a long rally
In Butler’s example, AMD closed at 645 after a rally that had run for months and, on a longer view, years. The 750 call traded around $1,700. The 550 put traded around $1,100. The upside option was roughly 50% more expensive, about $500-$600 more for the same expiration.
The market was pricing the chance that AMD could accelerate higher faster than expected. In momentum rallies, traders often buy calls to get leveraged upside with limited capital, and that demand pushes call prices up.
One honest caveat: those figures come from Butler’s example at that day’s close. They are not today’s quotes. Recent snapshots of AMD show mixed or near-neutral skew in October 2026, which reinforces the larger point. Single-stock skew is a snapshot, and in a sharp pullback it can flip back to put-heavy.
SPX and SPY: the structural put skew
Flip to the S&P 500 Index (SPX) and the picture reverses. With SPX near 7,800, a put 200 points out of the money traded around $3,900 (quoted 38/39). The 8,000 call traded around $2,600-$2,700.
| Product | Underlying level | Richer option | Approx. price | Skew type |
|---|---|---|---|---|
| AMD | 645 | 750 call | $1,700 (vs $1,100 for 550 put) | Call skew |
| SPX | ~7,800 | Put 200 points out of the money | $3,900 (vs $2,600-$2,700 for 8,000 call) | Put skew |
Index put skew is persistent for four structural reasons:
- Crash hedging: pension funds, asset managers and insurers buy index puts to protect portfolios, and they keep renewing those hedges.
- Dealer positioning: market makers are usually net short index puts and need richer prices to cover gap risk and hedging costs.
- The volatility risk premium: implied volatility (the move the option price assumes) tends to exceed the volatility that actually happens, especially on downside strikes.
- Market behaviour: indices tend to climb gradually and fall sharply.
Cboe SKEW Index The index closed at 154.34 on 9 October 2026, up from 149.19 the day before. Readings above 100 point to a heavier left tail. It is not a directional forecast.
For you, this means downside protection on the index is structurally expensive, while chasing a hot single stock through calls often means paying a premium.
How do interest rates distort call and put prices in longer-dated options?
Here is a gap that looks like skew but mostly is not. Compare SPX at-the-money options, where the call and put share the same strike right at the current price.
| Expiration | ATM call | ATM put | Gap |
|---|---|---|---|
| 27 days out | ~$10,000 | ~$9,500 | ~$500 |
| January 2027 | ~$26,000 | ~$19,000 | ~$7,000 |
The further out you go, the wider the gap. That is the arithmetic of put-call parity at work.
Put-call parity is the pricing rule that links a call, a put and the underlying at the same strike and expiration. It depends on the forward price, which is the expected price of the index at expiration after accounting for interest rates and dividends. Higher rates lift the forward price and make calls worth more. Dividends pull the other way.
Rates moved last month. On 16 September 2026, the Federal Reserve raised the federal funds target range by 25 basis points to 3.75%-4.00%, effective 17 September. It was the first hike since 2023.
Butler attributes the long-dated call premium to that hike. No reporting directly ties the decision to SPX or SPY call-versus-put pricing, so the link rests on his explanation. There are three ways to read the gap:
- Mechanical carry: rates, dividends and carry explain most of it, and at-the-money “skew” is just parity.
- Extra risk premium: long-dated index options may carry additional premium because investors pay for exposure to big moves.
- Term-structure quirks: rate and dividend patterns can make calls richer at some maturities and puts at others.
The practical lesson is to separate what parity requires from what genuine market opinion adds. A long-dated call that costs more than the matching put is largely carry, so do not read it as bullish sentiment or as extra skew to trade. Butler does point out one use: if you hold a couple of hundred SPY shares, you can sell a longer-dated call at or above the market to collect that rate premium.
For readers wanting to size the rate effect on long-dated positions, our dedicated guide to rho and interest rate effects on options shows how a 1% rate move changes a one-year at-the-money call.
How can you use options skew to your advantage?
The core principle is simple. When you sell an option on the skewed side, you collect more premium, and that premium lowers your cost basis.
Covered calls and naked puts
In call skew, a covered call does the work. Selling the AMD 750 call against 100 shares collected roughly 50% more than the 550 put, about $500-$600 more. The trade-off is that you give up any gain above 750.
In put skew, selling puts pays more. Persistent put skew means naked puts on SPY collect richer premium than equidistant calls. A naked put is a sold put without an offsetting position, which leaves you obliged to buy the shares if the price drops below the strike.
Butterflies and other spreads
A butterfly combines bought and sold options at three strikes to create a defined-risk bet on a price range. Skew shows up clearly in the pricing. With SPY closed at 777 on a 9-day cycle, Butler compared two 10-point-wide butterflies.
Same width, different prices Downside butterfly (767/757/747): about $0.70 Upside butterfly (787/797/807): about $1.20
Debit spreads and diagonals with a short leg on the skewed side can also benefit. Selling the rich side still does not guarantee a profit.
| Strategy | Skew it suits | Example | Main benefit | Main trade-off |
|---|---|---|---|---|
| Covered call | Call skew | AMD 750 call vs 100 shares | About $500-$600 more premium | Upside capped above 750 |
| Naked put | Put skew | SPY puts | Richer premium | Large losses in a crash |
| Butterfly | Either, short leg on rich side | SPY 767/757/747 vs 787/797/807 | Defined risk | Profit limited to a narrow range |
Think of skew as a pricing tailwind for sellers on the rich side. It improves your entry price, but it does not tell you the trade will win.
What are the risks of trading skew, and how fast can it change?
Collecting rich premium feels like getting paid extra. Usually, that is because you are taking on extra risk.
Five risks to weigh before selling skew
- Tail risk on short puts: a crash or gap can cost far more than the premium you collected, and bad years for indices have seen declines of 20%-40%.
- Capped upside on covered calls: in strong rallies, when call skew is often richest, the gains you forgo can dwarf the premium.
- Early assignment: American-style options can be exercised before expiry, especially around ex-dividend dates, leaving you with unwanted shares or a short position.
- Margin and leverage: margin requirements can rise sharply in volatile markets, which can force you out of positions at the worst moment.
- Fair compensation: the premium may simply be fair payment for risk rather than a mispricing.
Rich does not mean mispriced Many academics and practitioners view skew and the volatility risk premium as fair payment for bearing crash or melt-up risk. Shorting them is a choice to take risk, not a built-in edge.
Treat every skew trade as a decision to hold a specific risk in exchange for premium. Size it so that a gap or a rally cannot force your hand.
The volatility risk premium is not a quirk: SPY implied volatility has exceeded realised volatility roughly 84% of the time over the past decade, which helps explain why sellers on the rich side are usually paid for the risk.
How quickly skew can reprice
Skew responds to events, and history shows it can shift fast:
- 2018-2019 trade war: SPX and SPY put skew jumped during US-China tariff escalations, then flattened as headlines cooled.
- 2021 meme stocks: retail call buying in GameStop and AMC drove extreme call skew.
- 2023-2024 AI and semiconductor rallies: leading names showed richer upside calls, though sharp pullbacks could flip them back to put-heavy.
- Early 2020 COVID shock: index put skew spiked, then relaxed over the following months.
No case-specific skew data for 2025-2026 is available, so these are historical patterns. The lesson still holds: a reading you rely on today can reprice overnight.
Reading skew before you place the trade
Skew shows where the market fears or craves speed. Index skew leans structurally toward puts, single-stock skew can turn call-heavy in rallies, and long-dated call premiums are mostly rate-driven carry. Selling the rich side improves your price, but it is a trade-off, not an edge.
Before your next trade, run a short routine:
- Compare equidistant out-of-the-money strikes at one expiration.
- Identify the richer side.
- Separate what parity requires from genuine skew.
- Decide which risk you are willing to be paid to hold.
Watch how skew shifts around earnings, Federal Open Market Committee (FOMC) meetings and geopolitical events. Paper-trade a covered call or butterfly before you commit real capital.
This article is for informational purposes only and should not be considered financial advice. Investors should conduct their own research and consult with financial professionals before making investment decisions. Options carry significant risk, and past pricing patterns do not guarantee future results.