
S&P 500 futures have finished roughly where they started about 80 days ago, in early August. That looks like a range bound market with nothing to say, yet the index still set a record intraday high of 7,844.52 on 6 October 2026. Flat net change is not the same as an empty signal.
A broken uptrend line and a fresh record can sit on the same chart. That is why headline-only readers so often misread sideways action. They see “record high” and assume strength, or “trendless” and assume boredom.
As of 21 October 2026, one presenter’s technical read of the latest session offers a useful teaching case. He sees a broken trend line, a failed retest and price gaps boxing the market in.
This gives you a working framework for reading trend lines, gaps and breakouts, and for testing whether other markets confirm or contradict the equity signal. It is education, not a trade recommendation.
What a trend line, a gap and a breakout actually tell you
Every chart signal in this story comes from three tools. Each looks simple on screen, but the logic behind it explains why a break usually means “neutral” before it means “down”.
Trend lines and polarity
A rising trend line is a line drawn under a series of higher lows, the points where each pullback stopped above the last one. While price holds above it, buyers are setting the pace.
When price closes below that line, the pace has weakened. Former support can then act as resistance, a shift traders call polarity. Support is a price area where buying has previously absorbed selling.
The logic is about trapped buyers. People who bought near the old support and watched it break often sell when price climbs back to their entry, just to get out even. New short sellers may join them at the same level.
Broken does not mean bearish The CMT Association cautions that a broken uptrend first changes the condition from uptrend to neutral, not necessarily to downtrend. More evidence is needed.
Gaps as reference zones
A gap occurs when a stock or index opens well above or below the previous session’s trading range, leaving an untraded zone on the chart. A gap fill is a return to the pre-gap level.
According to Investopedia, a fill can signal the original move lacked staying power. If price then holds at that level, the gap can become support or resistance in its own right.
Range breakouts and false breaks
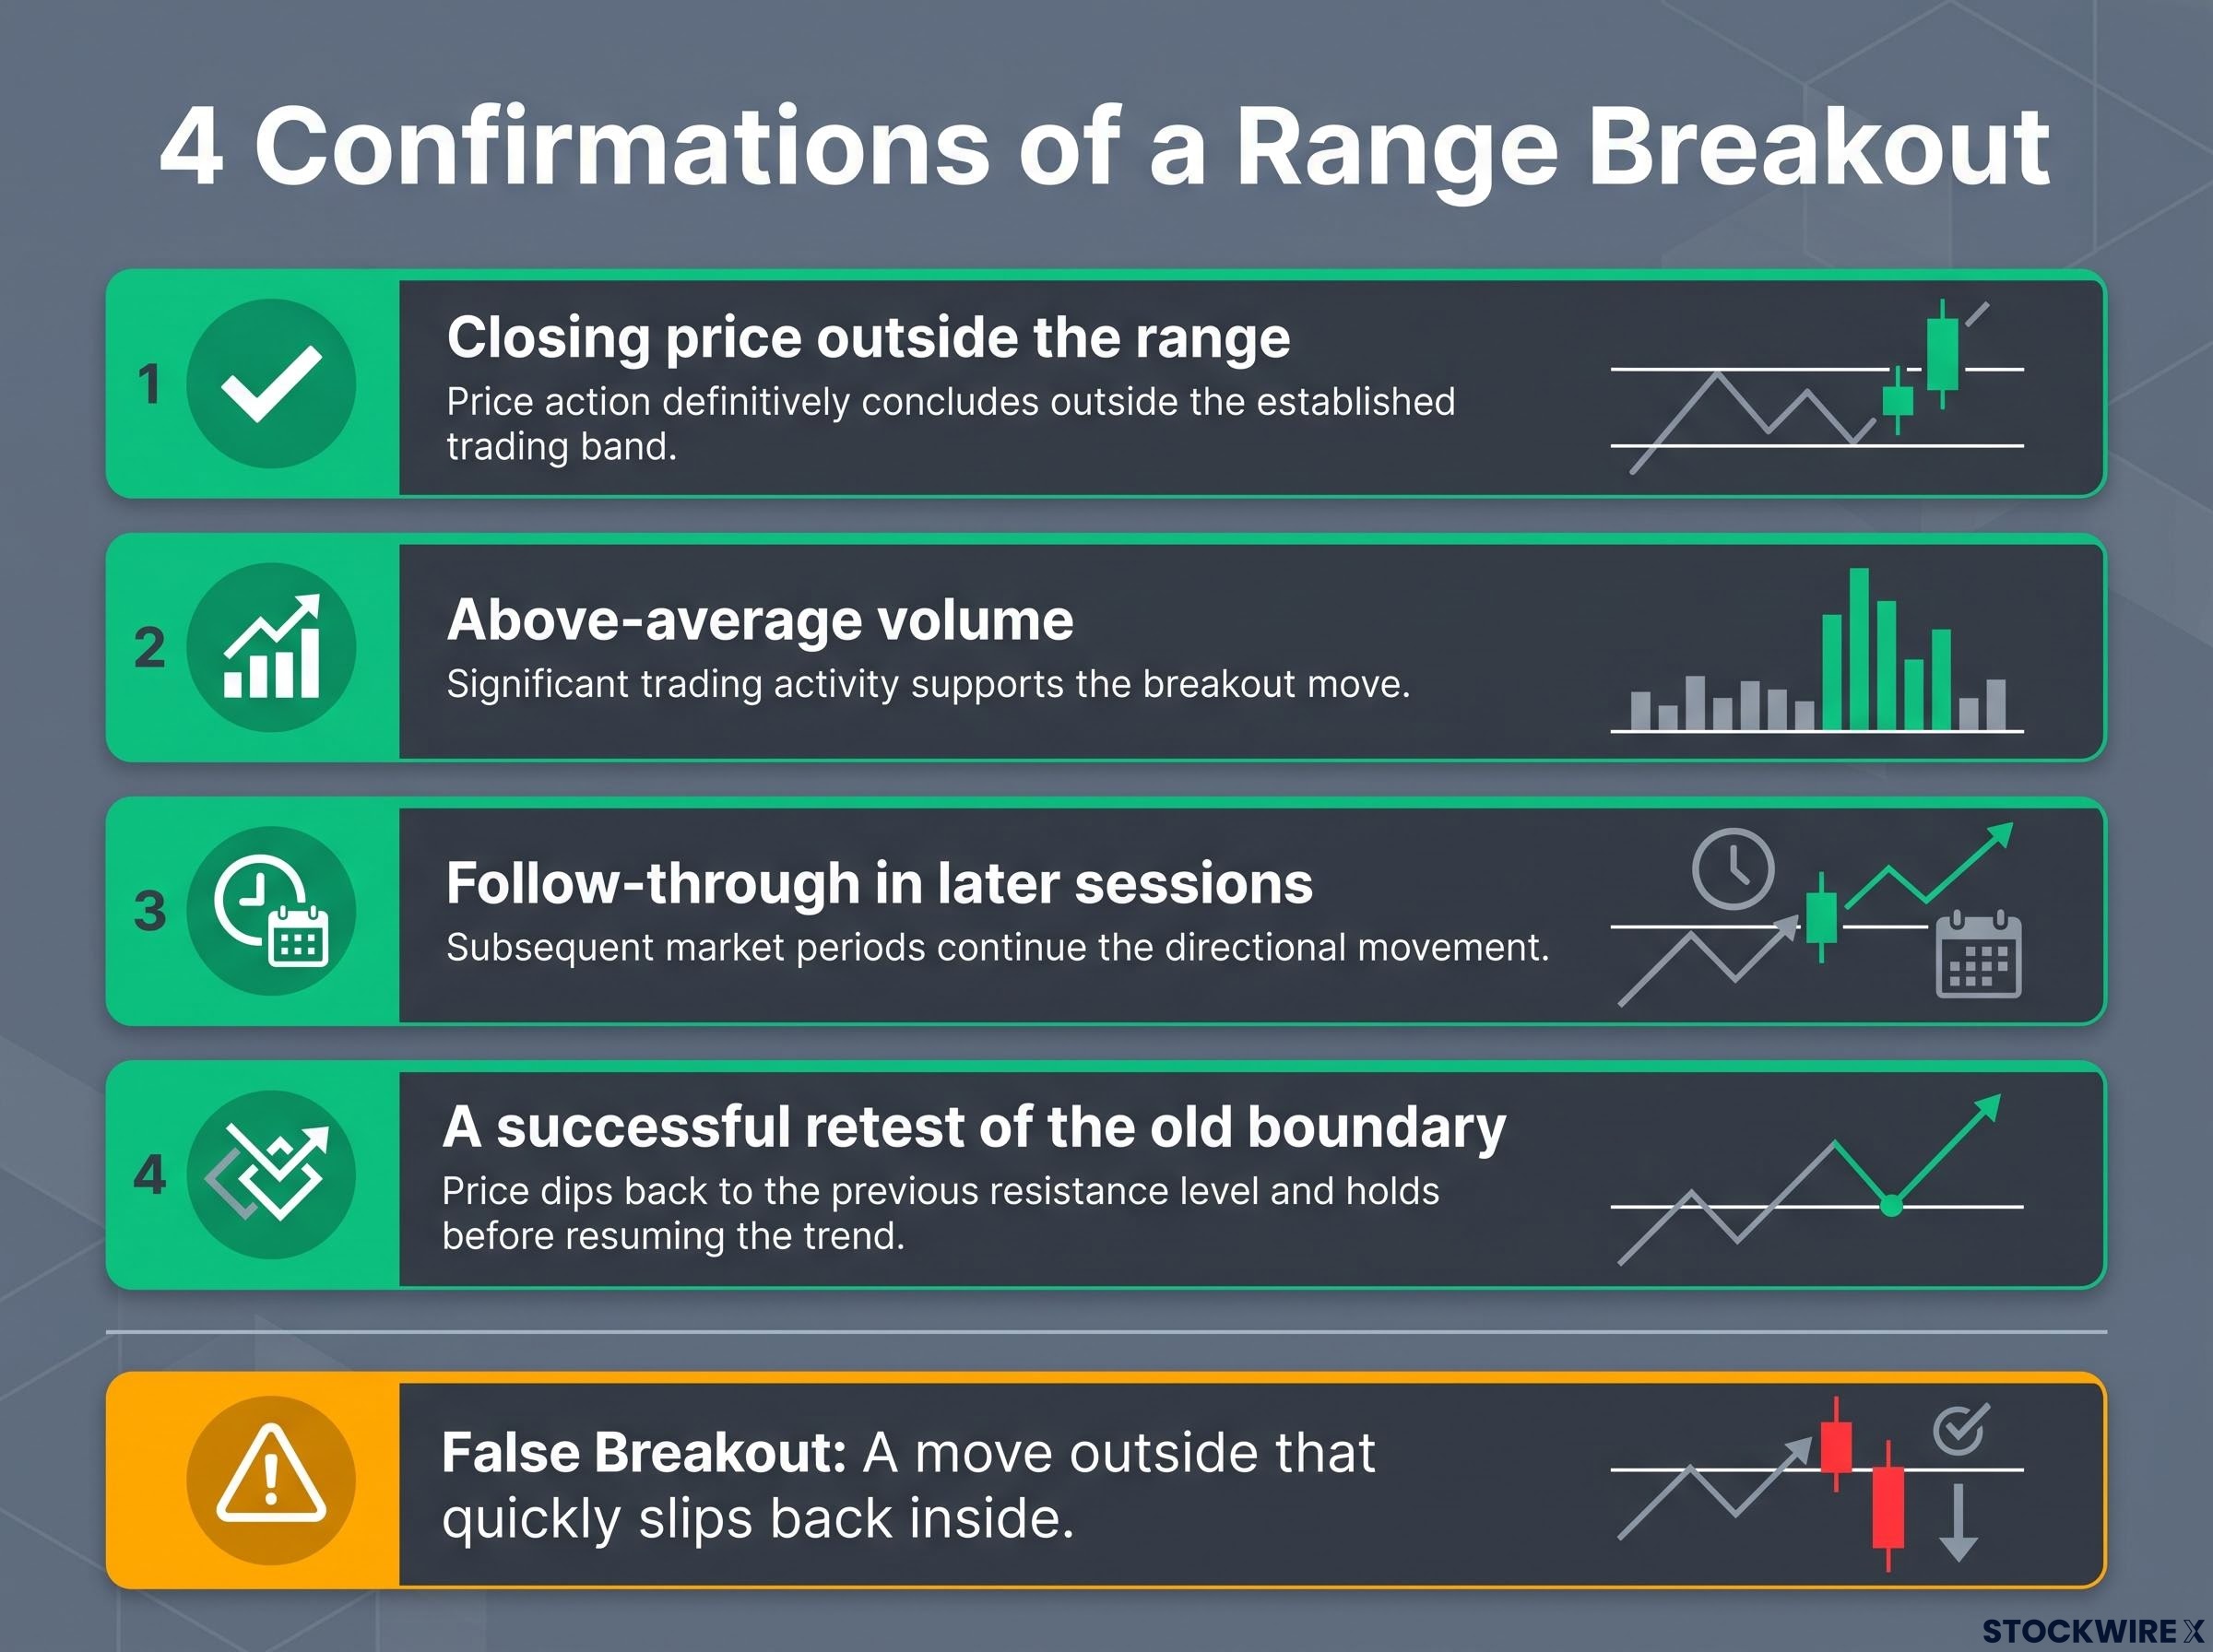
A breakout is a sustained move outside a defined horizontal or diagonal boundary. Traders usually want four confirmations:
- A closing price outside the range
- Above-average volume
- Follow-through in later sessions
- A successful retest of the old boundary
A move outside that quickly slips back inside is a false breakout. The CMT Association treats trend-line touches and breaks as warnings that need tactical confirmation, not standalone signals.
Of the four breakout checks, volume confirmation is the one most often skipped, yet a move on roughly seven times normal volume carries far more conviction than the same move on thin trading.
So when you see a line break, treat it as a prompt to check the evidence, not as a verdict. A close, volume and a failed retest would upgrade the warning. A swift recovery above the line would cancel it.
When big ASX news breaks, our subscribers know first
How the S&P 500 range played out: a broken trend line, a failed retest and about 80 flat days
The framework gets interesting once you watch it applied to real prices.
The timeline
According to Schaeffer’s Research, the index traded in a band of roughly 7,400-7,600 before an advance on 4 August. It then settled into a 7,600-7,800 channel. The prior intraday record of 7,816.70 came on 13 August, and Reuters noted the index spent more than 30 trading sessions going sideways afterwards.
On 6 October, it broke out to a record intraday high of 7,844.52 and a record close of 7,818.93.
| Phase | Approximate level or duration | What it signalled | Resolution |
|---|---|---|---|
| June-August range | 43 trading days, pullback about 5.03% | Consolidation | New highs |
| Pre-August range | 7,400-7,600 | Pause before advance | 4 August move higher |
| Post-August channel | 7,600-7,800, pullback about 3.95% | “Go-nowhere” market | Record on 6 October |
| Post-record drops | Gaps confining price for about 11 trading days | Broken trend line, failed retest | Unresolved |
Reuters’ comparison of the two pullbacks favoured the later range being another consolidation, not a top. A shallower dip suggested sellers had less force the second time.
How the presenter reads it
The record came only days before the presenter’s session, and two notable drops followed, including one on the prior Friday. Buyers rallied from Friday’s low, but the session high stalled just beneath the broken trend line. That is a failed retest: old support behaving as resistance.
A failed breakout is confirmed by reclaim and follow-through, not by the break alone, which is why most new highs and lows deserve patience before any conclusion is drawn.
SPY and the Dow ETF each rose about 0.25%, while ES futures sat near unchanged over roughly 80 days. Price gaps above and below have confined the market for about 11 trading days. In his view, a break either way would matter.
This is one trader’s view, and he discloses a short-heavy portfolio that is down about 4% from Friday’s peak close.
The apparent conflict between “broken trend” and “fresh record” comes down to timing. The record came first; the breakdown read came after the drops that followed it.
Schaeffer’s historical sample Across 19 cases where the S&P 500 stayed within 3% of a recent high for at least 20 days, ranges lasted about 30 days on average (25-day median). Upward breaks averaged 1.02% the next month (67% positive); downward breaks averaged -0.29%.
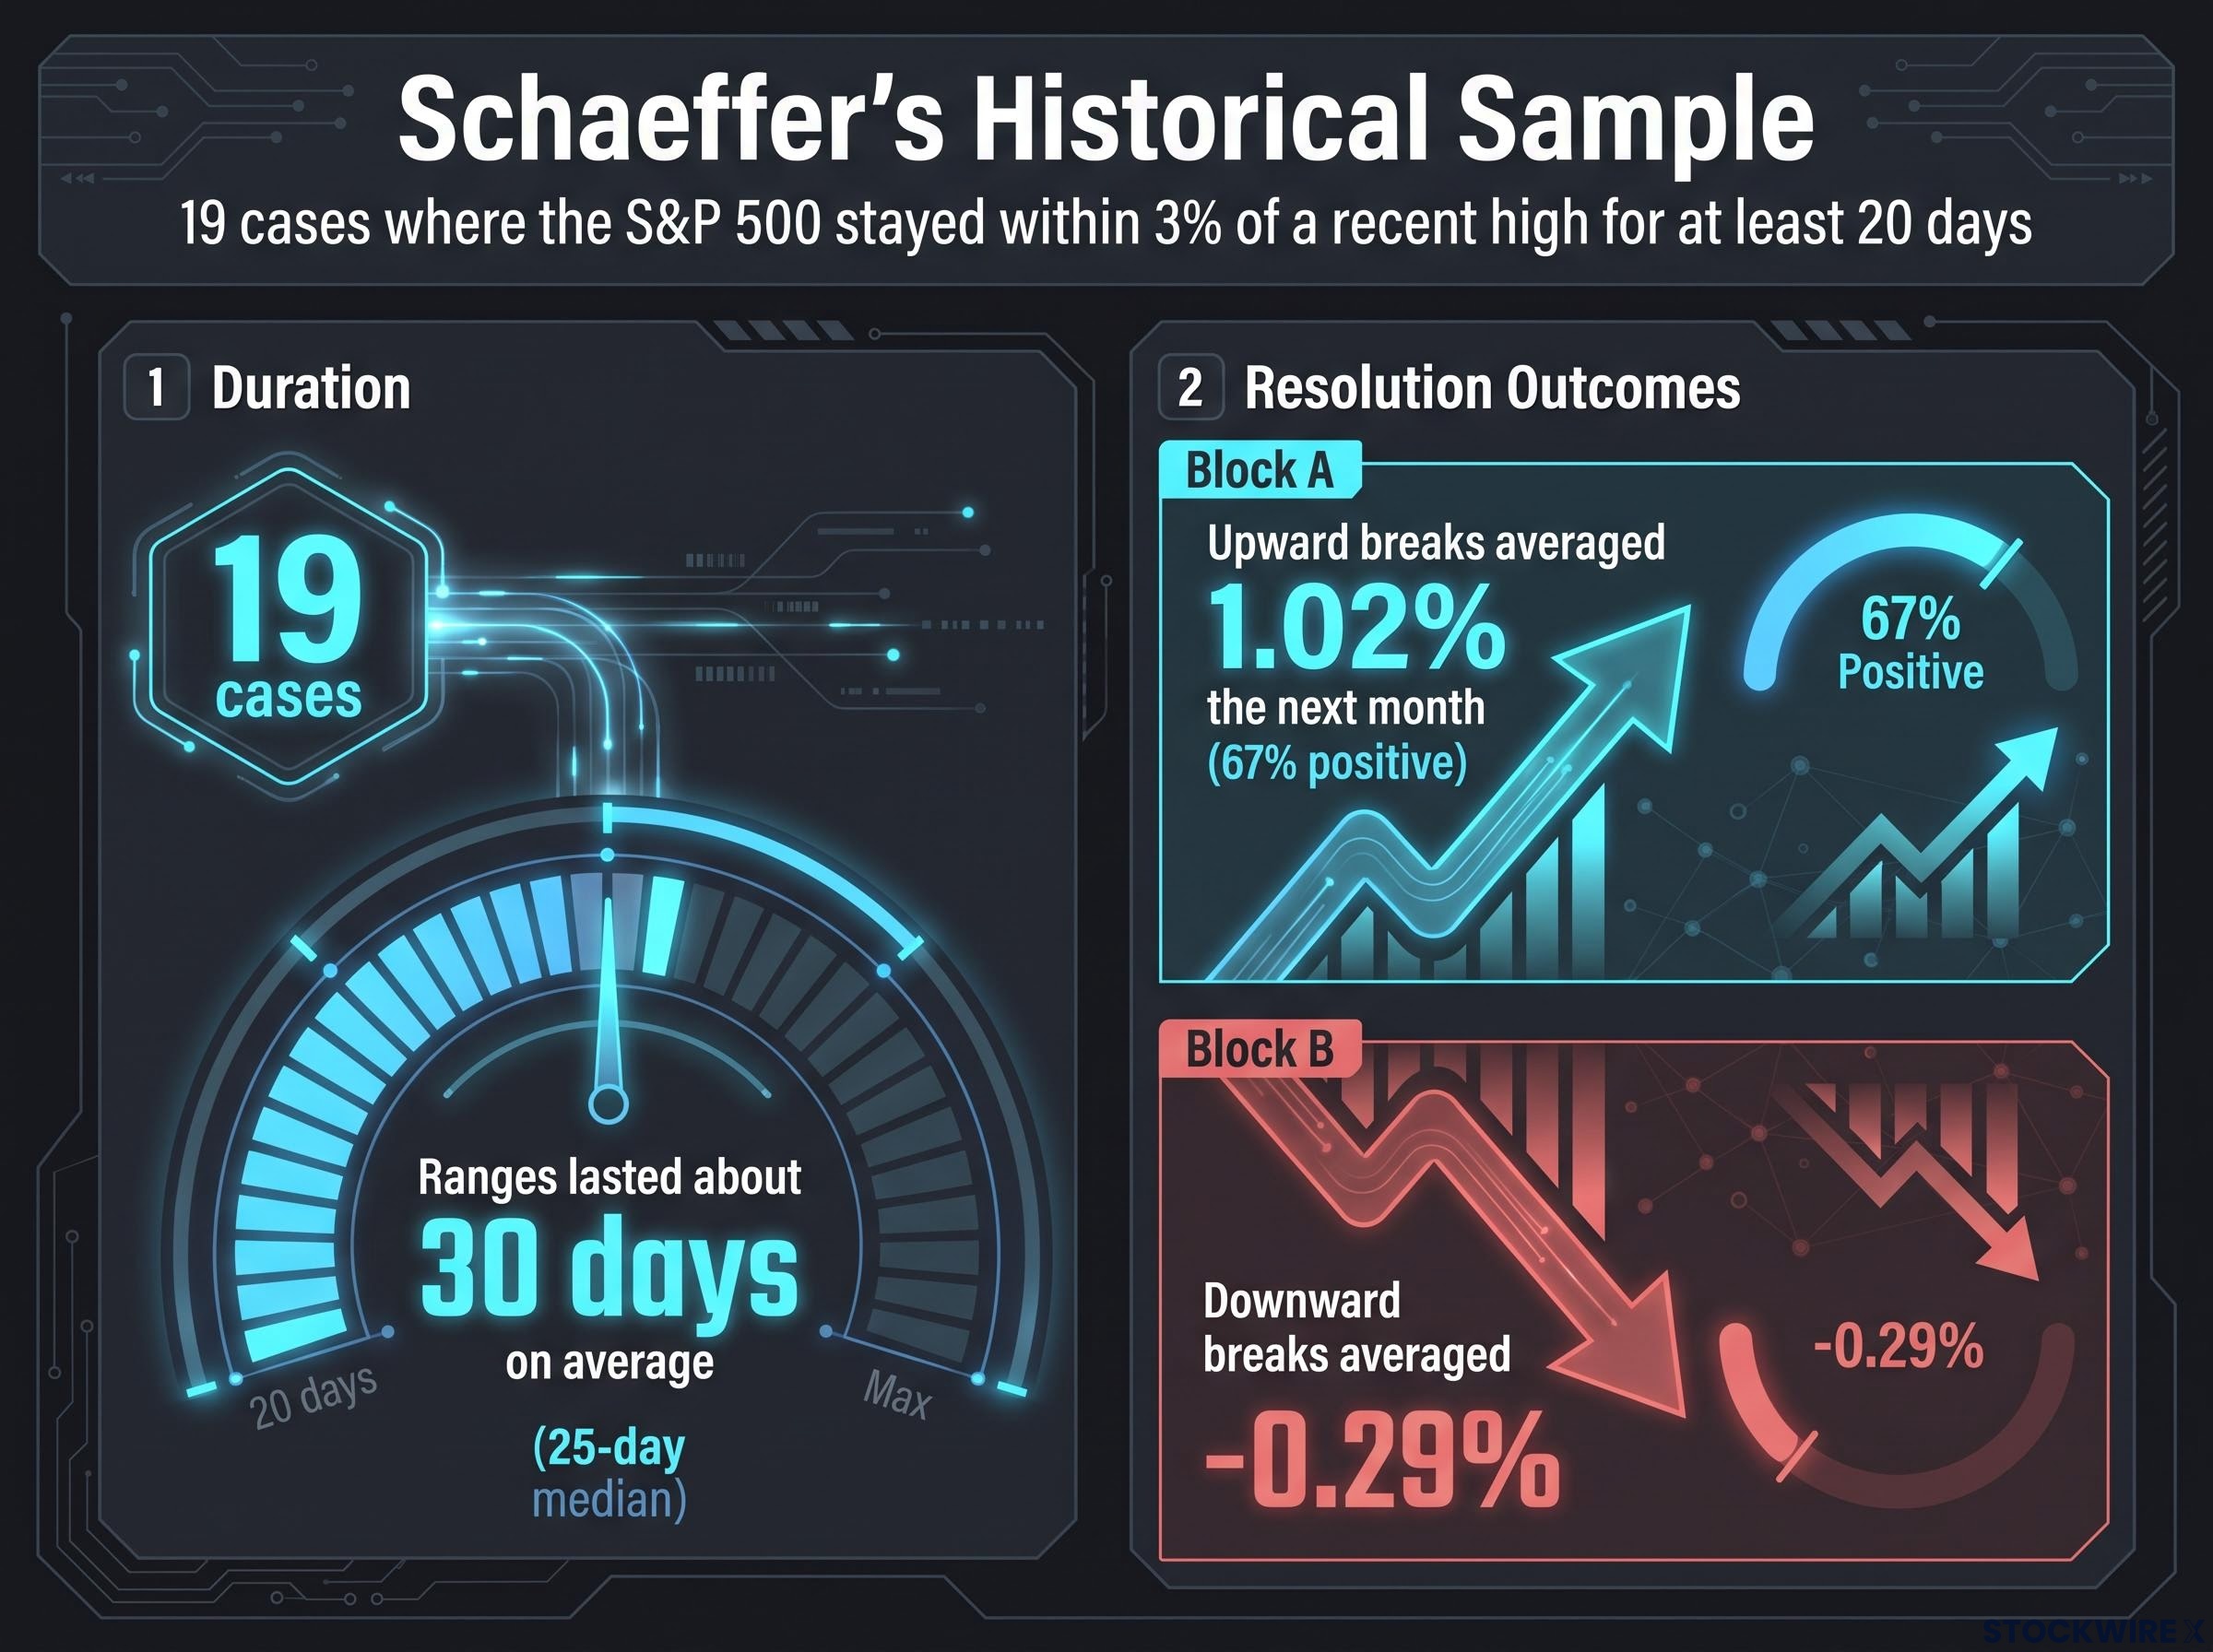
The lesson for you: ranges often outlast expectations and can resolve either way. Judge one by what price does at its edges, not by how long it has run.
Do other markets confirm the signal? Tech, country funds, metals, energy and crypto
The same three tools show up across asset classes. Moving through them reveals a less comfortable truth: the signals do not agree.
Tech and semiconductors
SpaceX rose 7.3% in the session, according to the presenter, after Q3 revenue of $14.58 billion, up 161%. The Seoul Economic Daily reported its AI division now makes up 52% of revenue. The presenter said South Korea rose over 1%, and the Malay Mail reported SK hynix and Samsung each up at least 7% in Asian trade.
That reversed the 13 October selloff, when Samsung fell 7.4% and SK Hynix 10.1%, dragging SpaceX lower. AI sentiment travels both ways between these markets, and confirmation can flip on a single earnings report.
Not everything confirmed, though. The leveraged Korea fund rose about 3.4% but still carries a head-and-shoulders top with an open gap. The space ETF UFO, where SpaceX is about 16% of holdings, shows a bearish topping pattern. Meta’s results that evening could move semiconductors given its heavy AI spending.
Country funds
FXI (China) fell 1.78%, extending a months-long downtrend. EWZ (Brazil) sits below a price gap ahead of a runoff election. EWW (Mexico) has formed a symmetric triangle, a narrowing pattern that often precedes a break in either direction.
Metals, energy and rates
Gold futures broke their trend line, with support turning into resistance. Silver sits near year-long support, and palladium has fallen over 50% from its high. Kitco reported gold slightly higher and silver lower on 21 October, with the 10-year Treasury yield near 5.1%, down from highs above 5.3%.
- Crude conflict: The presenter described crude falling sharply on peace talk, while Kitco reported it higher on 21 October after attacks on Strait of Hormuz shipping. They may describe different sessions.
- Implication: Until that is resolved, you cannot treat oil as confirming or contradicting the equity read.
Crypto
The presenter puts bitcoin in an up-channel at over $84,000 and MSTR up about 7%. No independent price data was found to verify either figure.
| Asset or fund | Technical feature | Concept illustrated | Latest move |
|---|---|---|---|
| XLK | Range between gap support and resistance | Gaps as boundaries | Range-bound |
| SMH | Gaps near 536 and 563 | Gap confinement | Upper end of five-day range |
| SOX | Long-term uptrend channel | Intact trend | Trend holding |
| QQQ | Higher high and higher low | End of mini-downtrend | Up about 1 percentage point |
| Gold futures | Trend-line break | Polarity | Slightly higher (Kitco) |
| FXI | Months-long downtrend | Trend persistence | -1.78% |
When markets line up, your confidence in a read can rise. Strong chips set against high yields and Hormuz risk tell you the range may stay unresolved for a while. Treat these single funds as illustrations, not recommendations.
Why a range-bound market resists easy reading: false breaks, bias and competing stories
If that disagreement leaves you less certain, good. Sideways price action supports several stories at once.
| Interpretation | Supporting logic | Main risk |
|---|---|---|
| Consolidation before continuation | Shallow pullbacks, prior range resolved higher | Could reflect fading demand |
| Distribution top | High valuations, rising yields, selling into strength | Needs a decisive downside break to confirm |
| Technical breakdown | Broken trend line, failed retest | A break first means “neutral” |
| Fundamental resilience | AI spending, productivity, solid demand | Multiples can shrink if yields rise |
The Federal Reserve’s May 2026 financial-stability assessment warned that valuations were high and the equity risk premium, the extra return investors demand for owning shares over safer bonds, sat well below its historical average. Fed officials never called the market range-bound. They weighed resilient spending and productivity against geopolitical, inflation and financial-conditions risks.
Morgan Stanley, by contrast, read the August consolidation as base-building after a breakout. Both views rest on the same chart.
Short-heavy positioning is not bullish evidence on its own either. Forced covering can produce a rally that fades. The evidence on reliability is mixed too: research found support and resistance had predictive power in currency markets that varied by currency and data provider, while broader studies found little robust predictive power. In a 2021 comparison, a break below the 80-day moving average proved useful only because later deterioration confirmed it.
The real dangers are false breakouts, confirmation bias and treating approximate lines as hard walls. A short checklist helps:
- Identify the boundary you are watching.
- Wait for a close beyond it on above-average volume.
- Check whether other markets confirm.
- Define what would prove your read wrong.
That fourth step matters most, because a range alone cannot separate accumulation from distribution.
A range bound market hides its most useful signals at the edges, where closes, rising volume, breadth and multi-session follow-through separate a genuine break from a brief probe.
What a range changes for you, and what it does not
A range tells you the market has not made a decision. It does not tell you the market lacks information. The boundaries spell out what a decision would look like: a reclaim of the broken trend line, or a move through gap levels such as SMH’s 536 and 563.
The variables worth watching are already named. Meta and Tesla earnings, Fed expectations, Strait of Hormuz headlines and the path of the 10-year yield could each test those edges. None of them guarantees a direction.
Your decision point is simple: pick the boundaries that matter to you and the evidence that would change your mind before price gets there.
This article is for informational purposes only and should not be considered financial advice. Investors should conduct their own research and consult with financial professionals before making investment decisions. Past performance does not guarantee future results.