Five clean setups from your volatility and trend screen can look like five separate trades. They might actually be one position. Stock correlation trading starts with that uncomfortable check: are your candidates genuinely independent bets, or one theme wearing five tickers?
When you screen for volatility and price trend, your attention goes to strategy and probability. You rarely stop to ask whether every candidate comes from the same industry. Semiconductor, software and energy names often move in unison.
That blind spot has a cost. You can end up with an oversized long-delta position in a sector that keeps selling off, or a large short-delta position in one that refuses to stop rallying. Delta is a measure of how much an options position gains or loses when the underlying stock moves.
Because you sell premium, you need to know how delta changes as expiration approaches; the same short put spread can carry far more directional exposure in its final days than it did at entry, which magnifies any sector stacking.
This guide shows you how to read a correlation value, how to test a new symbol against your current holdings in a few steps, and how to judge when a correlated trade is still worth taking.
How can a volatility and trend screen quietly stack one sector?
Think about how your screen actually works. Most premium sellers run some version of these two setups:
- Bullish premium: selling puts or put spreads on sold-off stocks with high implied volatility (the market’s expectation of future price swings) that are trading near their lows.
- Bearish premium: selling bearish put spreads or call spreads on rallying stocks with low volatility.
Both filters select on behaviour. Stocks in the same industry tend to show that behaviour at the same moment.
Where the concentration comes from
When one catalyst hits a sector, every name in it starts to look the same on your screen. Software stocks fall together. Semiconductors rally together, then drop together. Energy names move as a pack.
So a screen built for sold-off, high-volatility stocks can hand you four bullish trades from one battered sector, stacking up long delta. A screen built for steady rallies can do the same on the short side. None of these is a bad trade on its own; the problem is accidental exposure you never chose.
Holding count is not diversification According to Morningstar (March 2026), counting holdings is not enough. A fund can own many stocks yet remain heavily exposed to one return driver.
Why index weights make it worse
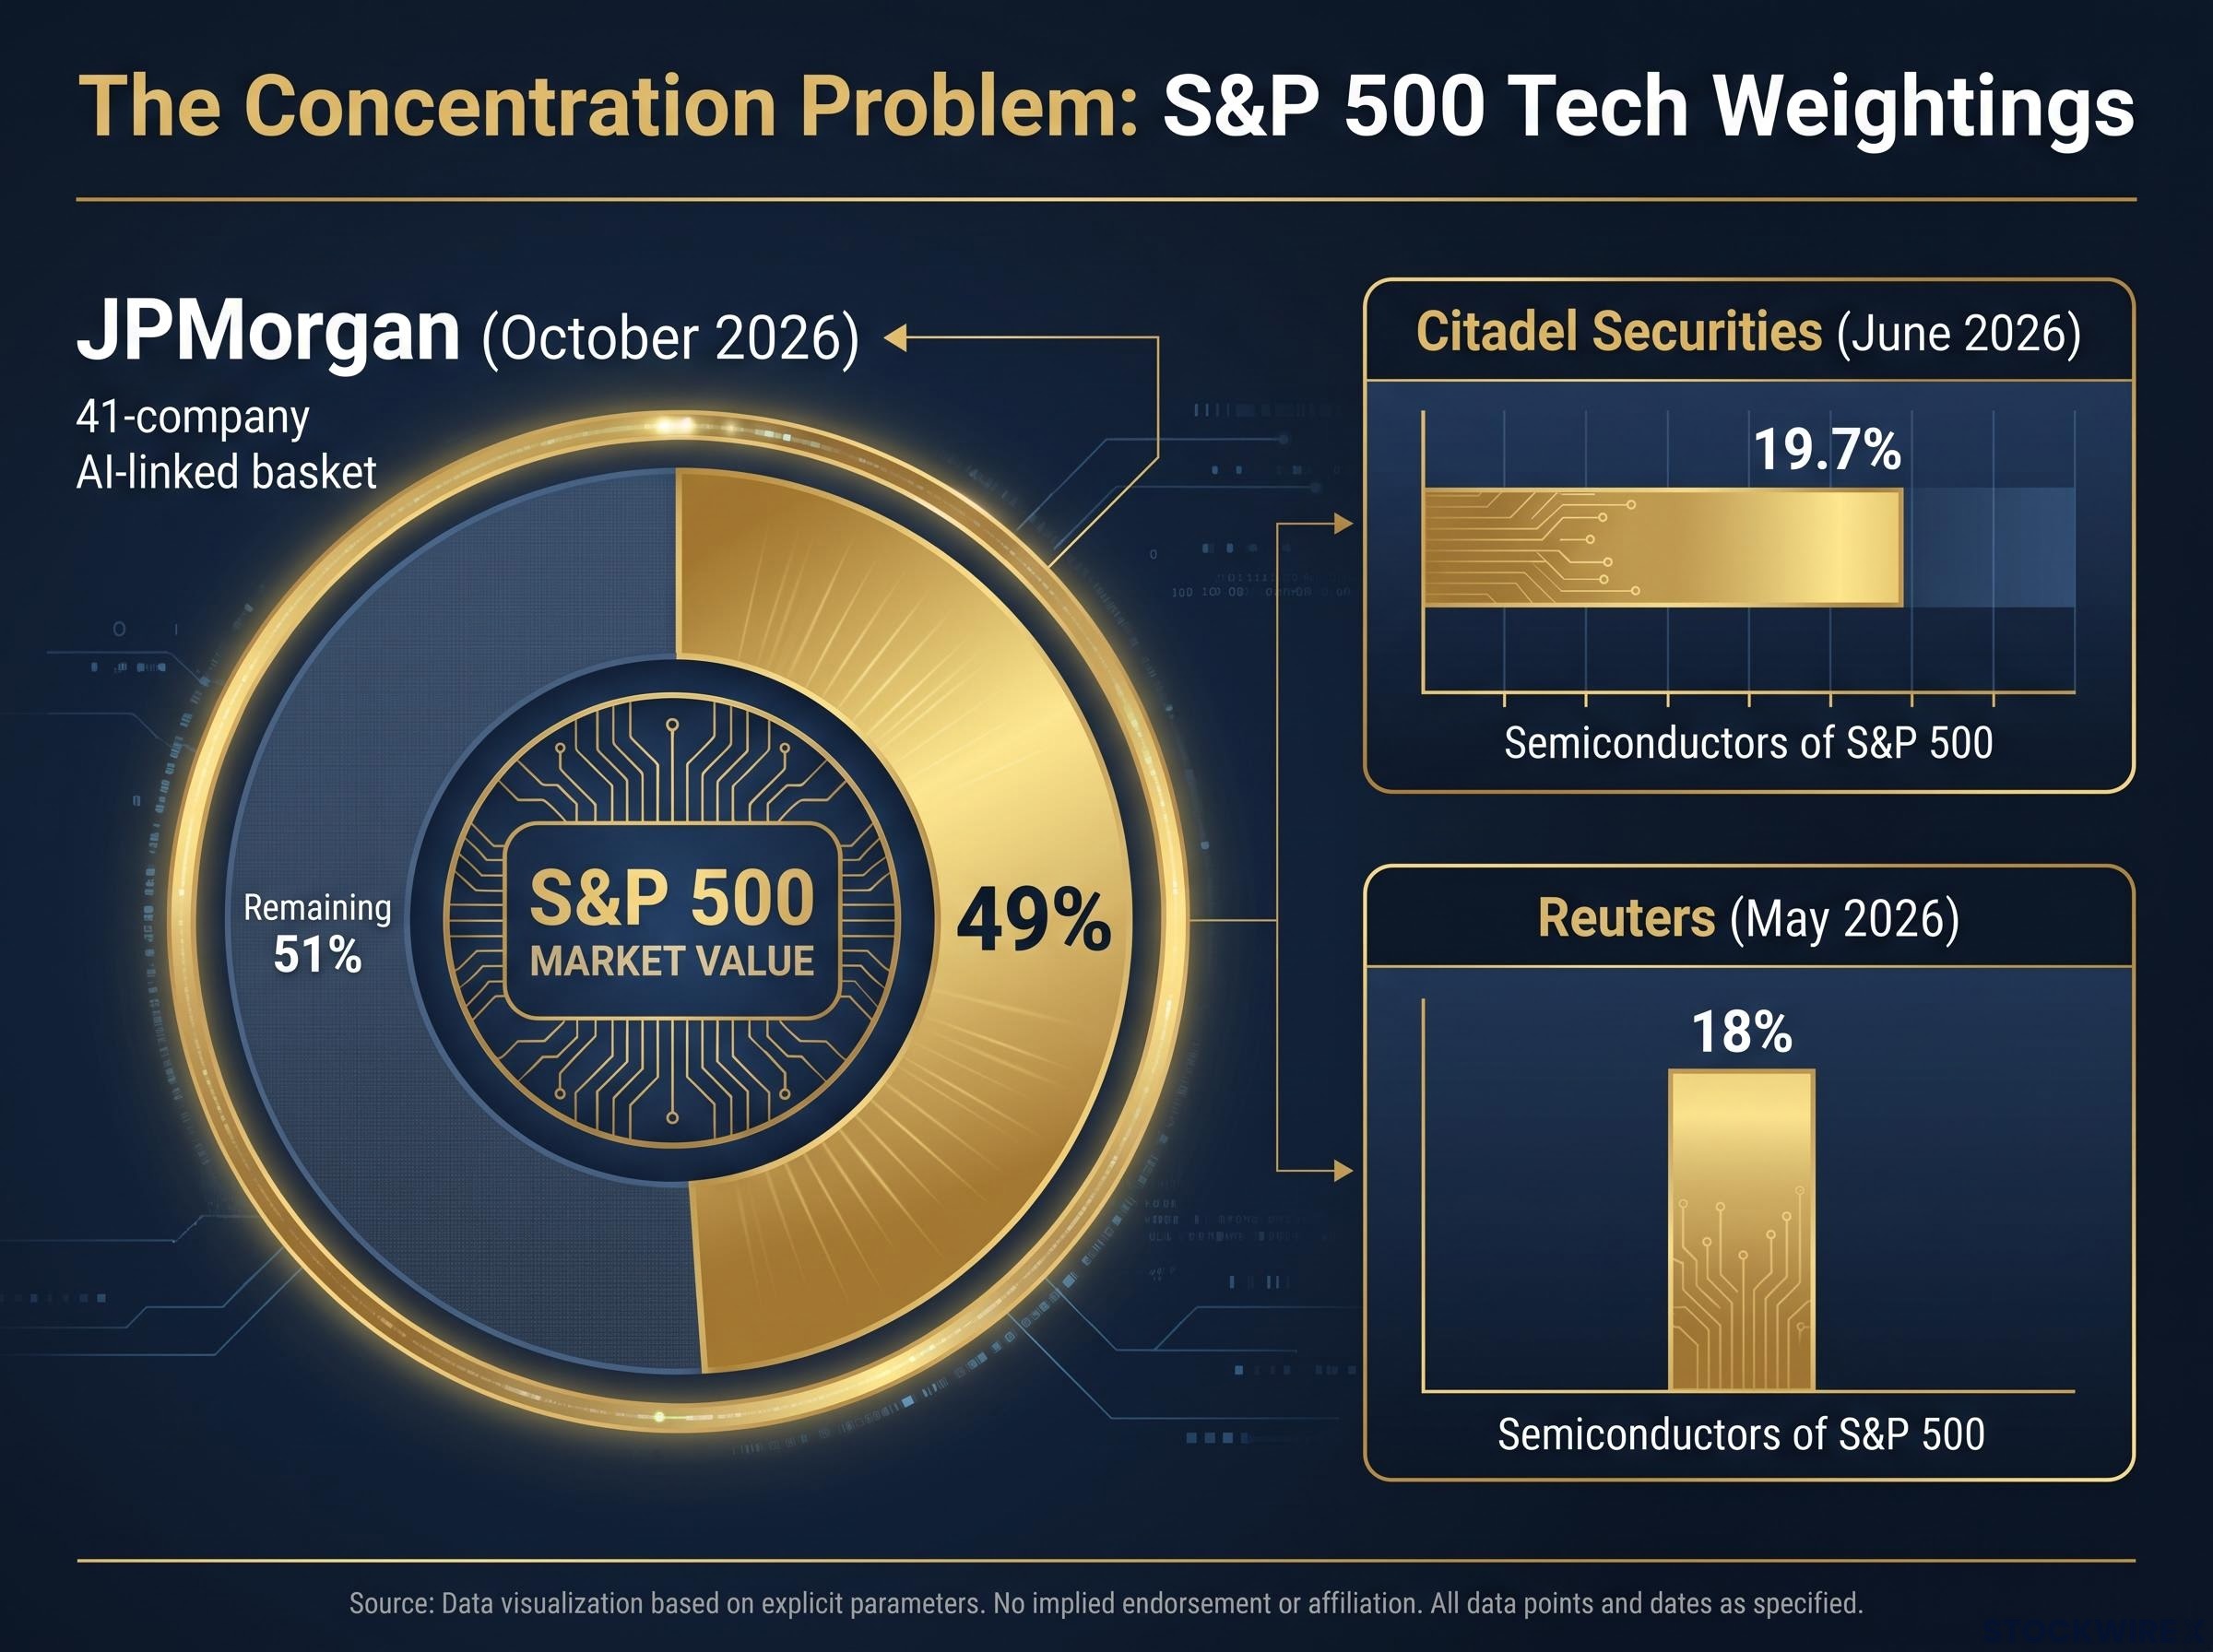
In the US market, the clustering problem has grown. Citadel Securities strategist Scott Rubner put semiconductors at 19.7% of the S&P 500 in June 2026, while Reuters measured 18% in May 2026. The figures differ by basket and date.
The broader theme is larger still. JPMorgan’s 41-company AI-linked basket accounted for 49% of S&P 500 market value in October 2026, though that is a custom basket, not an official sector classification. Chip designers, foundries, equipment makers, memory producers and cloud platforms all ride one AI spending cycle.
The number of open trades on your sheet tells you very little about how many independent bets you actually hold. Your screen’s output can be one theme in disguise.
When big ASX news breaks, our subscribers know first
What does a correlation value actually tell you?
On a charting platform, correlation usually appears as a single line or a percentage. That number summarises how closely two assets’ returns have moved together over a chosen period.
The scale runs from -1 to +1 (often shown as -100% to 100%). The sign tells you direction. The size tells you how strong and reliable the co-movement has been.
Imagine plotting one stock’s daily returns against another’s on a scatter chart. If the dots cluster tightly around a straight line, the reading is high. If they spread out like a cloud, it sits near zero.
| Reading | What it means | Example from the research |
|---|---|---|
| Positive | Returns tend to move the same way, both up or both down | Nvidia vs SPX at 77%; QQQ vs SPX at 82% |
| Negative | Returns tend to move in opposite directions on the same day | One asset rises while the other falls |
| Near zero | Little consistent linear relationship between returns | Scatter points spread with no clear line |
| Near +1 | Almost lockstep movement | SPY vs SPX, very high but not 100% |
SPY is an exchange-traded fund built to track the SPX index, yet even that pair falls short of a perfect reading. Tracking differences, dividends, expense ratios and trading hours all create small gaps.
In the demonstration, the presenter treats QQQ’s 82% against the SPX as a more reliable relationship than Nvidia’s 77%. A reading in that range tells you a stock moves with the market most days. Anything clearly higher against a peer signals extra clustering, not ordinary market exposure.
Keep one limit in mind. Correlation measures the linear relationship between returns; it does not imply causation or guarantee future performance.
Choosing a lookback window
The lookback window is the number of past trading days the calculation uses. Each choice has a trade-off:
- 10-day: the platform default; responsive to new shocks but noisy.
- 30-day: a tactical compromise, and the setting used in the demonstration.
- 90-day: more stable, but it can hold on to stale pre-shock data.
Compare windows rather than hunting for one correct period. If a pair shows low 90-day correlation but sharply rising 10- and 30-day readings, your diversification may be disappearing in real time.
How do you test a new trade against what you already hold?
Now turn that vocabulary into a routine you can run before your next entry.
Running the correlation study
The demonstration platform makes the test quick:
- Load the symbol you are thinking about trading.
- Open the indicators menu.
- Select the correlation study.
- Change the comparison symbol to the holding you want to test against.
Check the lookback setting before you read anything. The default is 10 days, while the demonstration switched to 30 days.
Run Nvidia through that process and a pattern appears quickly.
| Pair | Correlation (30-day) | Read-through |
|---|---|---|
| Nvidia-TSM | 84% | Tighter link than the broad market; same semiconductor and AI chain |
| Nvidia-AMAT | 83% | Equipment maker moving almost as closely as the foundry |
| Nvidia-SPX | 77% | Baseline market exposure |
Both peer readings sit above the index figure. If you hold a bullish Nvidia trade and add a bullish TSM trade, you are not opening a second idea. You are building a larger bullish semiconductor position.
Turning the number into a sizing decision
A high reading does not mean skip the trade. It means size it as if you are doubling one position rather than opening a new one. You have three choices: accept it, resize it, or skip it, and several small correlated positions can add up to an acceptable total.
Before entry, run this short checklist:
- Group your holdings by economic theme, not just industry label.
- Total the position weight in each theme.
- Check beta (how much a stock tends to move relative to the market) and volatility.
- Reduce size when short-window correlation is climbing.
What happens when a whole theme sells off together?
The Nvidia readings above are not an abstraction. The past two years show what they look like on a bad day.
| Date | Trigger | SOX move | Named stock moves |
|---|---|---|---|
| 27 January 2025 | DeepSeek’s lower-cost AI model | -9.2% | Nvidia down almost 17% |
| 15 January 2026 | TSMC growth forecast | +1.8% | TSMC +4.4%; Nvidia, Broadcom, Applied Materials higher |
| 17 July 2026 | Reversal fears in AI and chip shares | Not reported | Nvidia -2.2%, Intel -2%, Applied Materials -5.6% |
| 14 September 2026 | AI-industry risk warnings | -5.2% | Nvidia -3%, AMD -4.5%, Micron -5.4% |
The SOX is the Philadelphia Semiconductor Index, a benchmark of chip stocks. All figures come from Reuters reporting, several from single-source accounts.
One headline, one session On 27 January 2025, Nvidia lost about $593 billion in market value, and the SOX suffered its largest one-day drop since March 2020, according to Reuters.
In September 2026, Applied Materials and Lam Research each fell more than 6%. On the way up, Reuters reported the SOX gained 64% from the end of March 2026 against about 17% for the S&P 500. Short premium sellers felt that side too.
The way chip stocks swing from record gains to bear-market territory within months is a reminder that a crowded theme can punish both sides of the book.
These companies do not all share direct business links. The market trades the AI capital spending chain as one risk.
Why correlations climb in a sell-off
- Common-factor repricing: higher rates hit long-duration growth stocks at once.
- ETF flows: selling one thematic fund sells every constituent.
- Deleveraging: margin calls force cuts across holdings.
- Narrative contagion: one shock changes expectations for a whole supply chain.
Cboe reported in October 2026 that stock correlations roughly doubled from 7.4 to 15 after the Federal Open Market Committee (FOMC) meeting, though from a low base. Morningstar found cross-asset correlations rose in early 2025.
If your screen picked three AI beneficiaries, one headline can hit all three in a single session. Judge your exposure by the worst shared day, not the average one.
Where correlation falls short as a risk tool
Correlation earns its place in your routine. It flags clustering in seconds. But it can mislead you in specific ways:
- Not causation: Nvidia and TSMC may both respond to AI demand without one driving the other.
- Backward-looking: it summarises past returns and predicts nothing.
- Unstable: Morningstar (April 2026) put the three-year correlation of non-US developed equities with US stocks at 0.74, down from as high as 0.93 in earlier periods.
- Window and outlier sensitive: one crash day can dominate a short window.
- Ignores magnitude: two stocks can share a high reading, yet the more volatile one adds more portfolio risk.
- Understates tail risk: standard Pearson correlation can miss how likely joint extreme losses are.
The stakes are real. Morningstar (March 2026) found highly concentrated portfolios had deeper maximum drawdowns and higher volatility.
The practical consensus Treat correlation as a diagnostic, not a stand-alone buy or sell signal. Read it alongside position weights, beta and drawdown behaviour.
What to pair it with
Combine the reading with beta, volatility and your total weight per theme. Then stress-test a simultaneous shock: if every name in that theme fell together tomorrow, could you live with the loss?
A high correlation is a reason to ask how big your combined position is and why the stocks move together. It is not an instruction to buy or avoid.
Adding positions knowingly: the habit that replaces guesswork
Your screen finds setups. Correlation tells you whether those setups are really one bet. Sizing decides whether that bet is one you want.
Real independence is rare: Ray Dalio argued that 15-20 truly uncorrelated return streams are needed to cut volatility meaningfully, which sets a high bar compared with five tickers from one theme.
Keep three habits in place. Test every new candidate against what you already hold. Compare short and long windows rather than trusting a single reading. Treat the number as a changing estimate, not a forecast.
Your next step is simple: run the correlation study on the next symbol your screen produces, before you enter. Then decide consciously whether to add, resize or skip.
This article is for informational purposes only and should not be considered financial advice. Investors should conduct their own research and consult with financial professionals before making investment decisions. Past performance does not guarantee future results.