Most investors assume the hard part of space investing is picking the winner. It usually isn’t. The bigger losses tend to come from buying a stock that a five-minute check would have ruled out, such as Quantum Space, which carries a headline valuation of roughly $1.2 billion against about $24 million of projected 2026 revenue.
New space listings keep arriving. Recent debuts, a fresh batch of SPAC deals, a class action against AST SpaceMobile and a sharp guidance cut at York Space Systems all landed within months of each other. In this sector the story is usually louder than the financials, and skipping a first-pass screen means you are trading on the story.
This guide gives you a screen that rules stocks out first, a valuation ratio you can calculate yourself and a way to size whatever survives. It is a repeatable approach to space stock valuation that you can run on the next listing before you read a single analyst note.
Why start by disqualifying: the six red flags that cut the list fast
The original analysis behind this framework covered 11 recent or upcoming listings: six debuts and five SPACs. Two names were cut before any valuation work began. Starfighter Space went because it raised money through Reg A+, and Japan’s Axelspace went because it was too small.
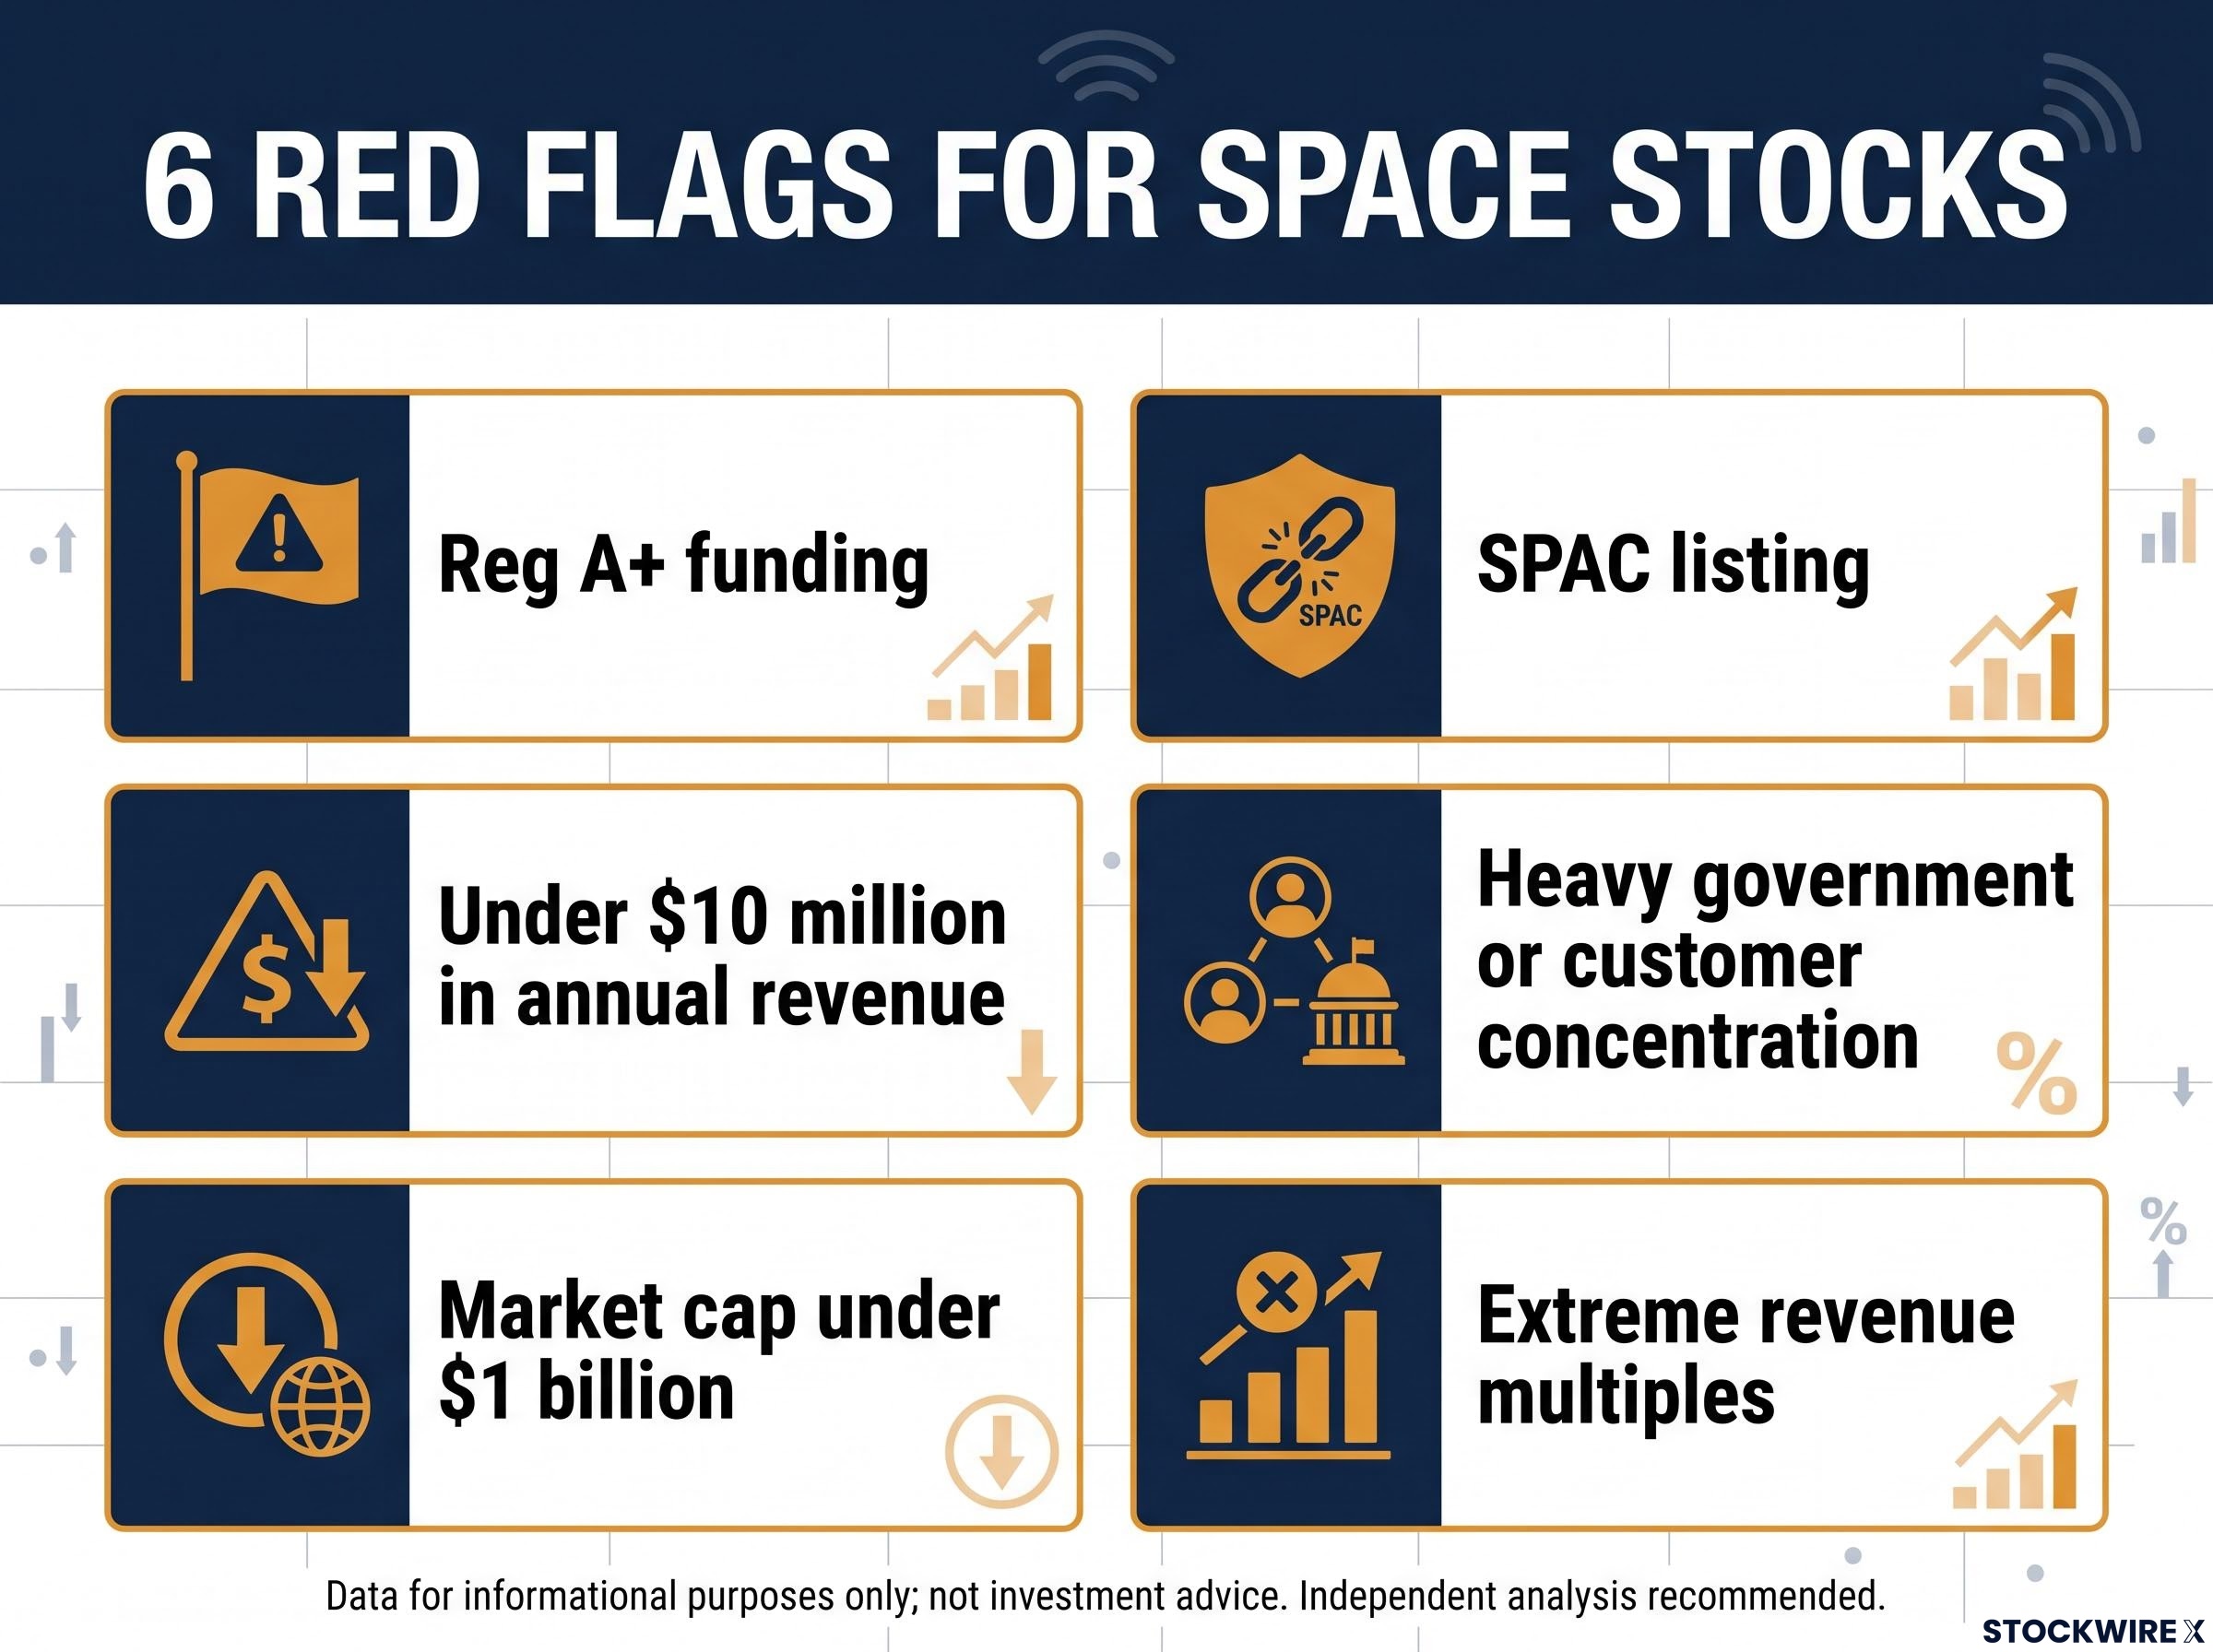
That is the point of the screen. You do the cheap work first, and these six filters remove most of the noise:
- Reg A+ funding. It relies on retail money, and a route built around retail demand tends to attract weaker businesses.
- Under $10 million in annual revenue. Below this level you have little evidence that customers will actually pay.
- Market cap under $1 billion. The analysts call the range around a few hundred million dollars a “danger zone”.
- SPAC listing. This route lets companies go public earlier and with less scrutiny.
- Heavy government or customer concentration. If one buyer changes its mind, revenue can disappear.
- Extreme revenue multiples. At very high prices, years of perfect execution are already assumed.
The analysts apply the same discipline to SpaceX. They consider it highly overvalued, so their approach is to set a target ratio and wait for the price to reach it. They also caution against social media accounts that relentlessly promote names like ASTS and Voyager.
When a rigid screen gets it wrong
The fair criticism is that blunt rules can reject real winners. Space companies often spend years on development before launch or constellation revenue arrives, so “no revenue” can sometimes mean “early” rather than “bad”.
The pressure valve A stock that fails the screen is not automatically rejected. It is reclassified as a venture-style position, with smaller sizing, milestone gates and a scenario-based valuation.
A failed screen does not prove the company is poor. It does mean you should stop treating it as an ordinary investment and give it a smaller, separate slot in your portfolio.
When big ASX news breaks, our subscribers know first
How to calculate the simple valuation ratio without fooling yourself
The simple valuation ratio (SVR) is market capitalisation divided by annualised revenue. It tells you how many dollars of company value you are paying for each dollar of yearly sales. It is a screening tool, not a forecast of what the business is worth.
For benchmarks, the analysts put SpaceX at about 60, with a low of about 45 when the share price was $108. Across roughly 200 stocks in their disruptive tech catalogue, the average is about 8.7.
The catch is that one company can produce several very different numbers. Build the habit of calculating three:
- Market cap divided by trailing (last 12 months) revenue
- Market cap divided by annualised current-quarter revenue
- Enterprise value divided by forward revenue (enterprise value is market cap plus debt, minus cash)
| Company | Numerator | Revenue basis | SVR |
|---|---|---|---|
| Rocket Lab | $31B-$33B market cap | Q2 2026 annualised, $936M | 33-35× |
| Voyager | ~$1.8B market cap | Q2 2026 annualised, ~$210.8M | ~8.5× |
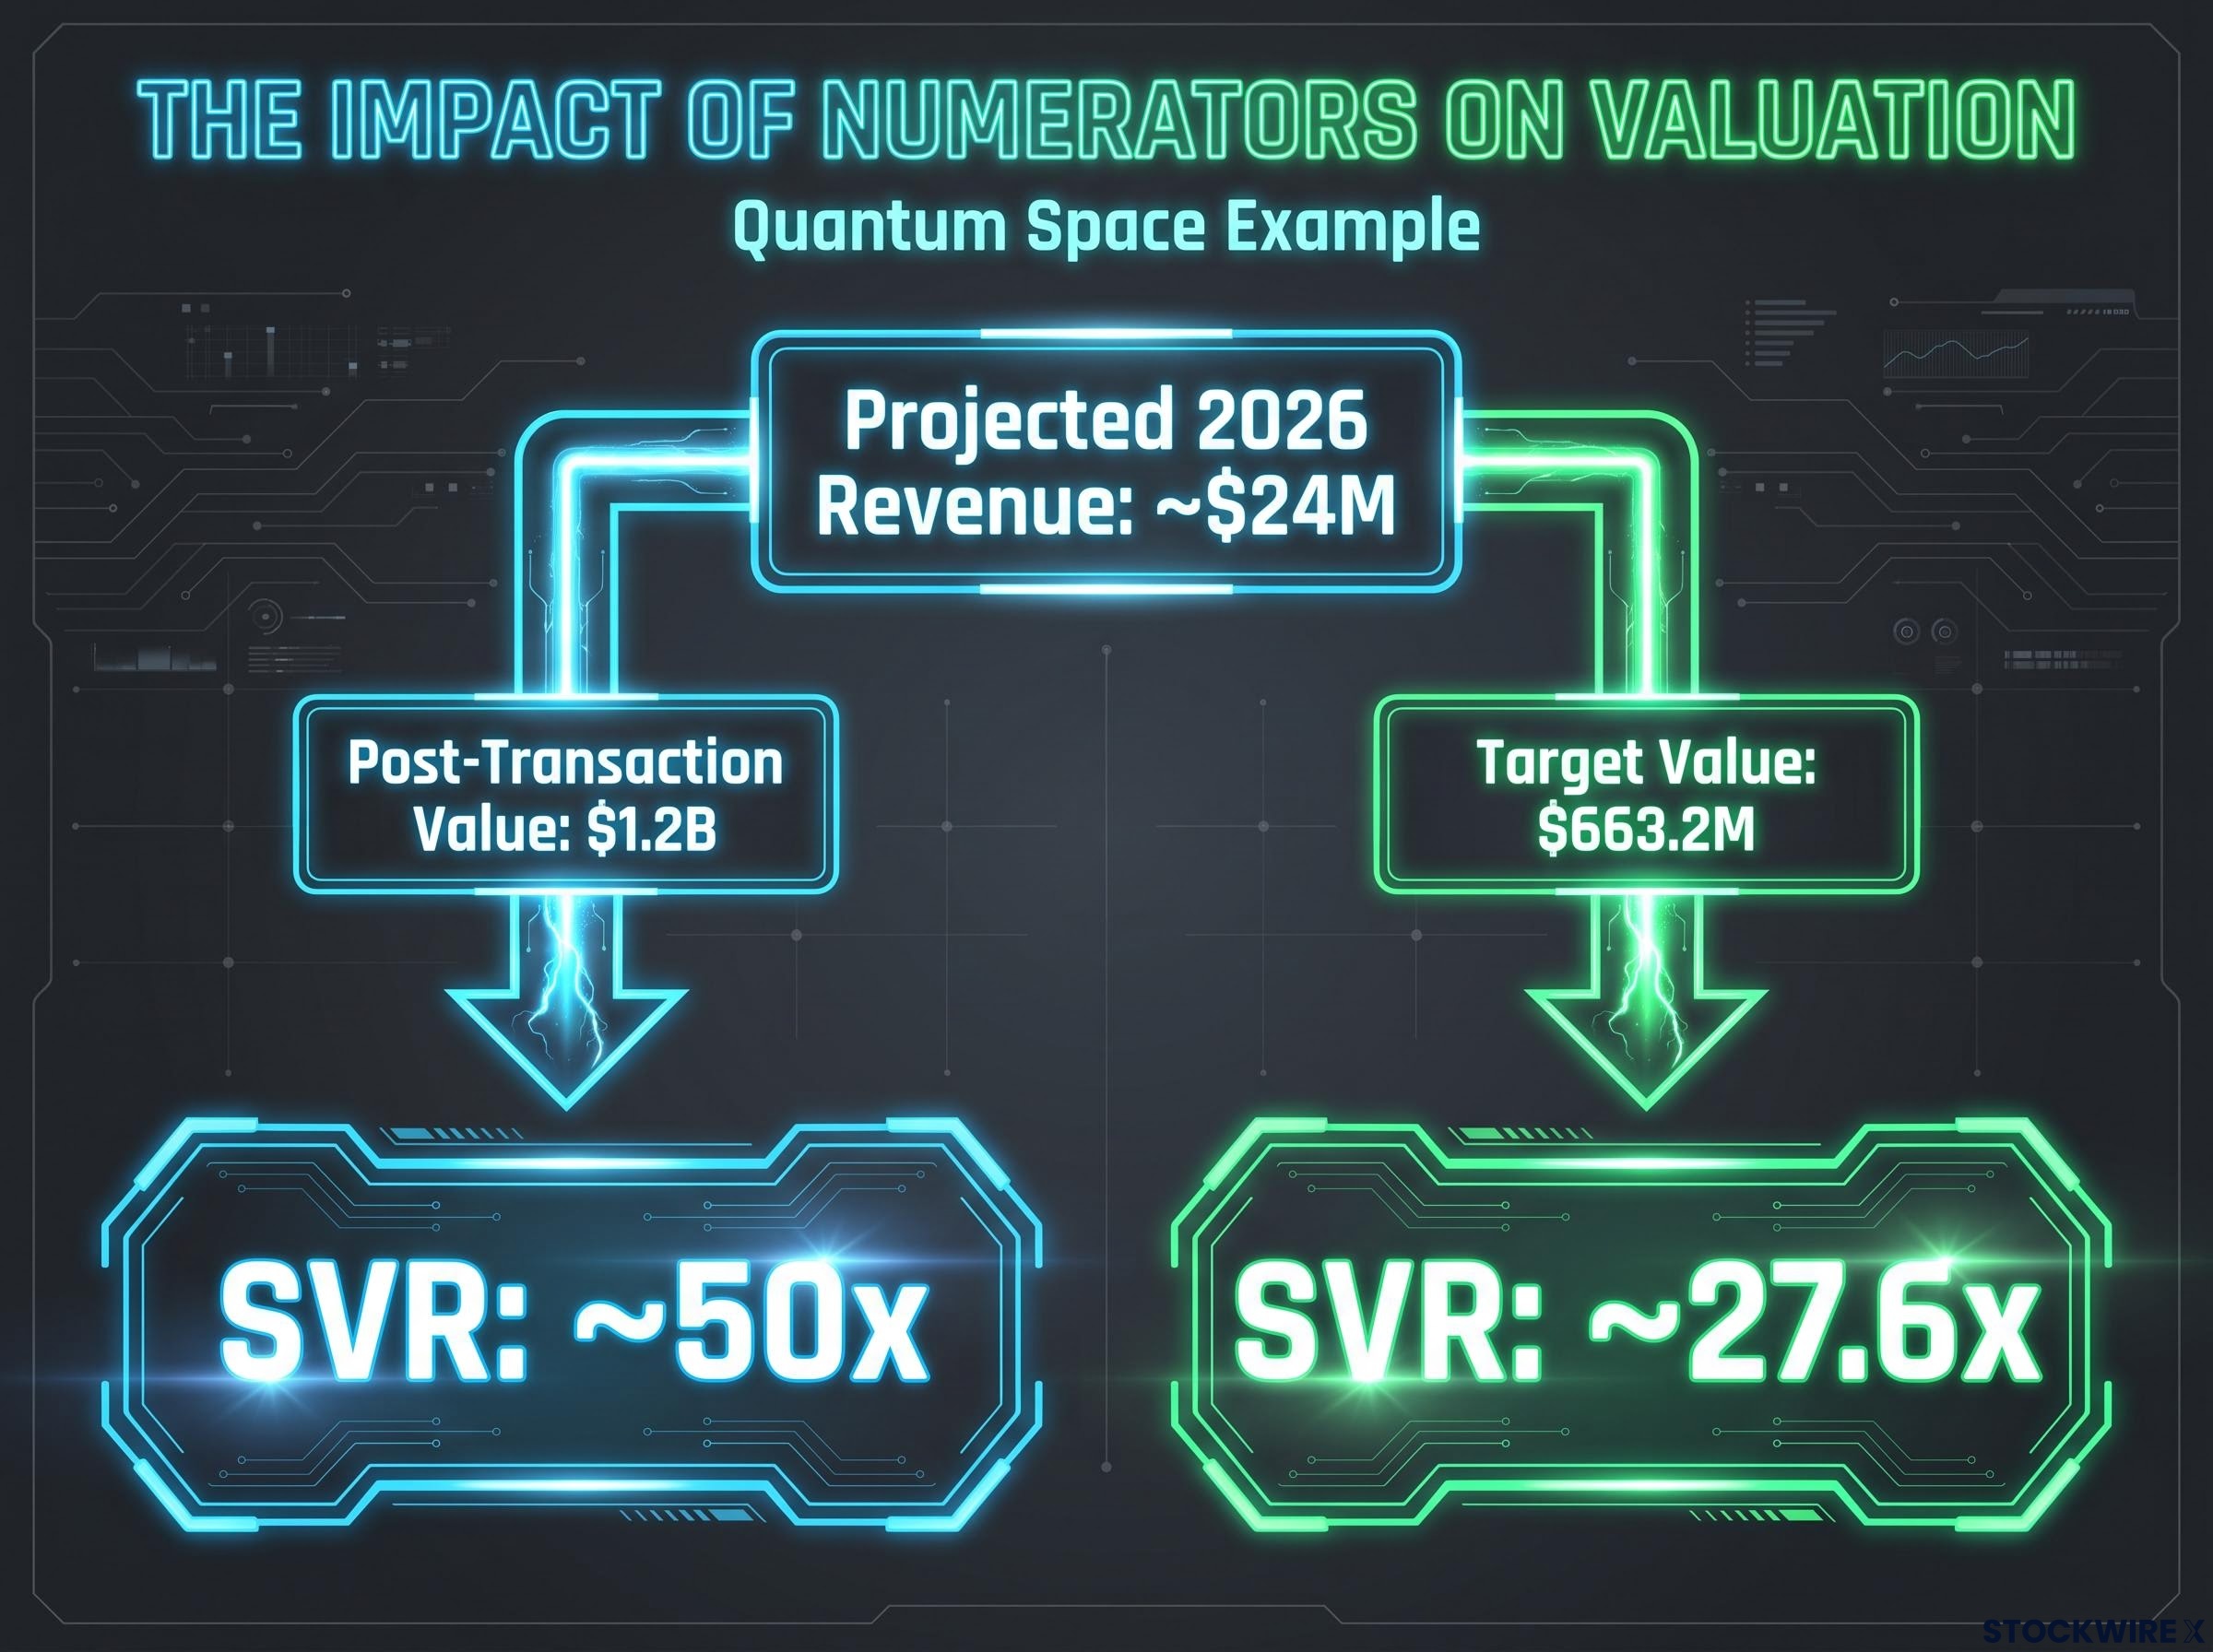
| Quantum Space | $1.2B post-transaction value | ~$24M projected 2026 | ~50× |
| Quantum Space | $663.2M target value | ~$24M projected 2026 | ~27.6× |
| Catalogue average | Market cap | Annualised | ~8.7 |
The same Quantum revenue figure gives you either 50× or 27.6×, depending only on the numerator. Rocket Lab shows how much the revenue basis matters too. The original source cited an SVR of about 40, while annualising $234 million of Q2 revenue gives 33-35×. MDA Space is quoted at about 3×, but there are no verified current figures behind that number.
A ratio without a stated numerator, revenue basis and share count is a marketing number. Rebuild it yourself before you trust it.
Count every share, not just the headline count
Fully diluted shares include warrants, options, convertible notes, sponsor shares and earn-outs. AST SpaceMobile shows why this matters. It has $1.075 billion of 2.25% notes due 2036 and $1.0 billion of 1.625% notes due 2034, and both could turn into new shares if the stock climbs. A 2024 Harvard Law School Forum summary adds a caution of its own: simple dilution ratios can mislead, so you should check them against the full share register (the cap table, which lists who owns what).
Even a company with strong revenue growth can leave you worse off per share, because share dilution from options, warrants and convertibles compounds quietly, so every valuation denominator you use should be the fully diluted count.
Why SPACs and Reg A+ listings start with a handicap
A SPAC is a listed shell company that raises cash and then merges with a private business to take it public. Reg A+ is a US exemption that lets smaller companies raise money from the public with lighter requirements than a full IPO. Each route carries its own built-in pressures:
- Sponsor promote and costs. The SEC lists sponsor compensation, underwriting fees, warrants and PIPE financing as sources of dilution.
- Redemptions. Public holders can cash out near trust value. SEC-filed academic commentary found that de-SPACs with redemptions above 25% were worth less than the redemption price in their first weeks.
- Forecast incentives. Before the SEC’s 2024 rules, deals could lean heavily on long-range projections. The reforms required fuller dilution and projection disclosure and removed key safe-harbour protections.
- Selection effects. A SPAC can take a company public earlier, with little revenue and large forecast growth.
- Reg A+ limitations. These offerings come with less operating history and less institutional price discovery.
A 2026 university study summary, which has not been independently confirmed, reported that SPAC mergers trailed traditional IPOs by about 18-30 percentage points over six months. The same summary found median revenue projections were nearly three times realised outcomes, and only about 35% of targets met or beat them. The original analysts covered more than 100 SPACs and say nearly all of them hurt retail investors.
The recent wave of de-SPAC deals shows why the PIPE commitment is worth checking first, since the presence and size of institutional PIPE investors is one of the few public signals of real conviction behind a listing.
Projection is not revenue Quantum’s roughly $24 million projection against a roughly $1.2 billion headline valuation is not the same as valuing an established $24 million-revenue company.
The Harvard summary does argue that headline dilution measures can overstate the damage. There is also no post-listing performance data yet for the newest space SPACs or for Reg A+ space offerings. Even so, when a company chooses one of these routes, the burden of proof sits with the company. Ask for audited revenue, cash runway and a full dilution table before you go any further.
Worked examples: running recent space listings through the screen
The real test is to run the same filters across thirteen names and see where each one lands.
| Company | Key figure | Main flag | Screen result |
|---|---|---|---|
| Rocket Lab | Q2 revenue $234M, up 62% | Multiple | Passes operating, fails value |
| Voyager | Q2 gross margin 8% | 88% govt/Starlab | On hold |
| York | Guidance $375M-$405M | Guidance cut | Borderline |
| MDA Space | Over 70% commercial | Unverified data | Lower risk, unverified |
| AST SpaceMobile | ~300M shares | Dilution, litigation | Venture-style only |
| HawkEye 360 | US govt ~61% of revenue | Acquisition growth | Insufficiently verifiable |
| Firefly | ~$400M yearly burn | Reliability | Avoid for now |
| Quantum Space | ~50× projected revenue | Projections only | Fails |
| Astro Digital | ~$587M pro forma EV | SPAC, competition | High risk |
| Astrum Space | ~$1.0B equity value | No audited figures | Fails verification |
| NorthStar | No valuation available | No data | Fails verification |
| WISeSat | Pre-revenue | No data | Fails verification |
| Astramm | Pre-revenue | No revenue | Avoid |
Operating companies: Rocket Lab, Voyager, York, MDA Space
Rocket Lab passes the operating screen, with a GAAP gross margin of 36.1%, but its Q3 guidance drops to 29%-31%. Reports that link this margin pressure to the Mynaric integration, and Berenberg’s reported $83 Buy target, are unverified. Voyager has $585.5 million of liquidity and $275-305 million of guidance, but 88% of its revenue comes from the US government and Starlab. York posted $92.5 million of Q2 revenue and then cut its guidance from roughly $545-595 million, implying about 1% growth. MDA lists on the TSX and reports in Canadian dollars (the original source’s NYSE reference conflicts with this), and its current figures are unverified.
Speculative or hard to verify: AST SpaceMobile, HawkEye 360, Firefly
ASTS’s share count has risen about 50% in a couple of years. It also faces a class action covering 4 March 2025 to 15 July 2026. Berenberg reportedly sees $92 a share while Piper Sandler reportedly cut its target to $54, and neither figure is verified. HawkEye 360’s 85% growth falls to about 30-40% once the ISA acquisition is stripped out. Firefly has roughly 1.5 years of liquidity and a 43% full success rate.
The SPAC batch
Quantum fails a conservative screen. Astro Digital grew revenue from $25 million in 2024 to $34 million in 2025 and expects $50 million this year, which makes it the most compelling of the group but still a high-risk SPAC. Astrum, NorthStar and WISeSat all fail verification.
A pass on the operating screen is not a buy signal, and Rocket Lab proves it. “Unverifiable” is a legitimate answer too, and it should keep you out until the data arrives.
How to size positions and set milestone gates once a stock survives
Sizing is the one part of this process you control completely. Start by splitting each holding into two parts. The core is value backed by revenue and liquidity you can already see. The optionality is value that depends on future launches, contracts or approvals.
Size each position so that losing all of it would not damage your portfolio. That commonly means a small single-digit percentage, or less for the most speculative names. Then add only when the company clears milestone gates such as:
- Launch success
- Satellite deployment
- Customer activation
- Backlog conversion
- Gross-margin improvement
- Cash-burn reduction
Apply a penalty for government or customer concentration, unfunded backlog and growth that comes mainly from acquisitions. Government contracts can be terminated for convenience, which means the buyer can cancel without the company doing anything wrong. York illustrates the scale problem: it reports $592 million of backlog, $1.85 billion of potential on awarded contracts and an $11.5 billion pipeline. Split figures like these into funded backlog, unfunded options, IDIQ ceiling value and a probability-weighted pipeline.
Long-duration government contracts with high switching costs can create more predictable revenue than commercial technology models, which is why you should weigh revenue mix and geopolitical sensitivity alongside the concentration penalty when you size a position.
Timing matters Backlog conversion and revenue timing are not interchangeable.
SpaceX adds pressure from outside. Its direct-to-cell service is a competitive risk for ASTS, and a SpaceX IPO could pull capital towards the category leader. Morgan Stanley’s reported $300 target for SpaceX is unverified. Put the whole process into four steps:
- Classify each holding as core or venture-style.
- Size it so that a total loss would not hurt your portfolio.
- Set the milestone gates that would justify adding to it.
- Rebalance when the price rises faster than the operating evidence.
A small position with clear gates beats a large one held on conviction. This is educational material, not personalised advice.
A short checklist to run before the next space listing, and what to watch for
Run the same sequence on every new name. Check the route to market, the revenue threshold, the market cap and the concentration. Then calculate the multiple with its numerator stated, and the dilution. Finally, classify the stock and size it.
The framework is built to reject quickly and size carefully. Treat unverified data as a reason to wait, not a gap to fill with optimism.
The commercial space economy is already worth around US$630 billion with 80% of revenue earned commercially, so the useful question for you is whether a company has moved from build-out to recurring, high-margin operations.
Over the coming months, watch for:
- York’s next guidance update
- Voyager’s margin and organic growth delivery, plus Starlab decisions due in early 2027
- ASTS’s launch schedule and developments in the litigation
- How the new SPAC batch trades after listing
Before you read any analyst story about the next space listing, run it through the screen first.
This article is for informational purposes only and should not be considered financial advice. Investors should conduct their own research and consult with financial professionals before making investment decisions. Past performance does not guarantee future results, and projections are subject to market conditions and various risk factors.