President Donald Trump has said the US will not strike Iran before the 3 November midterms, and that talks with Tehran are productive. Brent still closed near US$103 a barrel, up nearly 9% since 29 September. Any serious oil price analysis right now has to start with that gap, because it points to a market that has stopped weighing statements and started counting tankers.
The physical backdrop explains why. The number of attacks on shipping in the Strait of Hormuz each week is now the highest recorded since the conflict started on 28 February. At the same time, Hurricane Isaias forced producers to shut in output across the Gulf of Mexico.
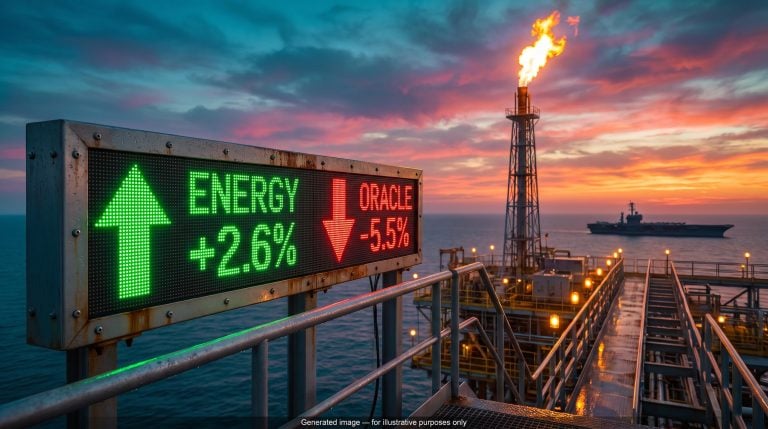
For Australian portfolios, this is already showing up in prices. The ASX 200 Energy index has climbed 3.3% from its 1 October low.
Here is what is actually moving oil, how that pressure travels into bond yields, and where local energy stocks sit in that chain.
Why are oil traders trusting tankers over political statements?
On paper, the president’s Truth Social post should have cooled prices. In practice, oil trimmed some gains and then held near its highs. Brent rose 2.5% to about US$103, WTI reached US$91.18 (up 3.29%), and US diesel futures jumped 5.6% to sit within 3% of their 15 September record.
The statement also followed an earlier suggestion from the same president that renewed strikes were under consideration. When the rhetoric swings both ways within days, each new post tells traders very little.
The shipping data tells them a lot more. According to UKMTO figures reported by Iran International, four tankers were struck in the strait between 1 and 4 October, and traffic fell to single-digit movements each way. In the preceding 72 hours, roughly 32 vessels had been passing through daily.
Anadolu Agency counted at least eight tanker attacks between 1 and 5 October and pointed to elevated Baltic Exchange earnings on Gulf-to-China routes for very large crude carriers (VLCCs, tankers that carry about two million barrels). Reuters and CNBC describe Hormuz shipping as slowed to a trickle under repeated attacks and a US naval blockade.
Where traders are looking Bloomberg reports that oil traders are discounting the president’s statements and giving more weight to physical supply and cargo flows.
The tallies themselves vary, and that matters. Sources draw different geographic boundaries, use different time windows and count different types of incident.
| Source | Figure | Scope | Period |
|---|---|---|---|
| Argus Media (UKMTO) | 42 attacks | Strait of Hormuz only | Early July to 30 September |
| Ahram Online (UKMTO) | 63 vessel damage incidents | Hormuz, Arabian Gulf, Gulf of Oman and adjacent waters | 28 February to 7 October |
| Middle East Eye (UKMTO) | 91 vessel damage incidents | Hormuz reporting area | February to 4 October |
Treat any single number as indicative. The direction is consistent across all of them, and that is the point you should take away: a price premium backed by documented shipping disruption is far more durable than one built on headlines, so one reassuring post is unlikely to unwind it alone.
Goldman Sachs estimates roughly US$14 a barrel of the crude price is a geopolitical risk premium, which is why a durable shipping disruption matters more than any single statement.
When big ASX news breaks, our subscribers know first
How much supply is actually at risk from Hormuz and the Gulf of Mexico?
The research describes the Hormuz disruption as significant but not fully quantified, which sounds almost calming. It should not. Two separate supply shocks have landed in the same week.
Hormuz is best understood as a flow and insurance problem rather than a confirmed loss of barrels. Ships are not moving because the risk of moving is too high. Ahram Online, citing UKMTO, records three confirmed total vessel losses and 25 injuries or fatalities since February, and some attacks have only been disclosed late, so visibility remains incomplete.
Gulf of Mexico: a shut-in that kept growing
The early reporting put Hurricane Isaias outages at about 500,000 barrels per day (bpd). That figure aged quickly. On 7 October, around 25% of US Gulf oil output and 16% of gas was shut in.
By 8 October, data from the Marine Minerals Administration reported by Reuters showed roughly 63% of US Gulf offshore oil production offline, about 1.28 million bpd, plus 57% of gas output (about 1.13 bcf/d, or billion cubic feet per day). Operators evacuated 121 platforms and five rigs.
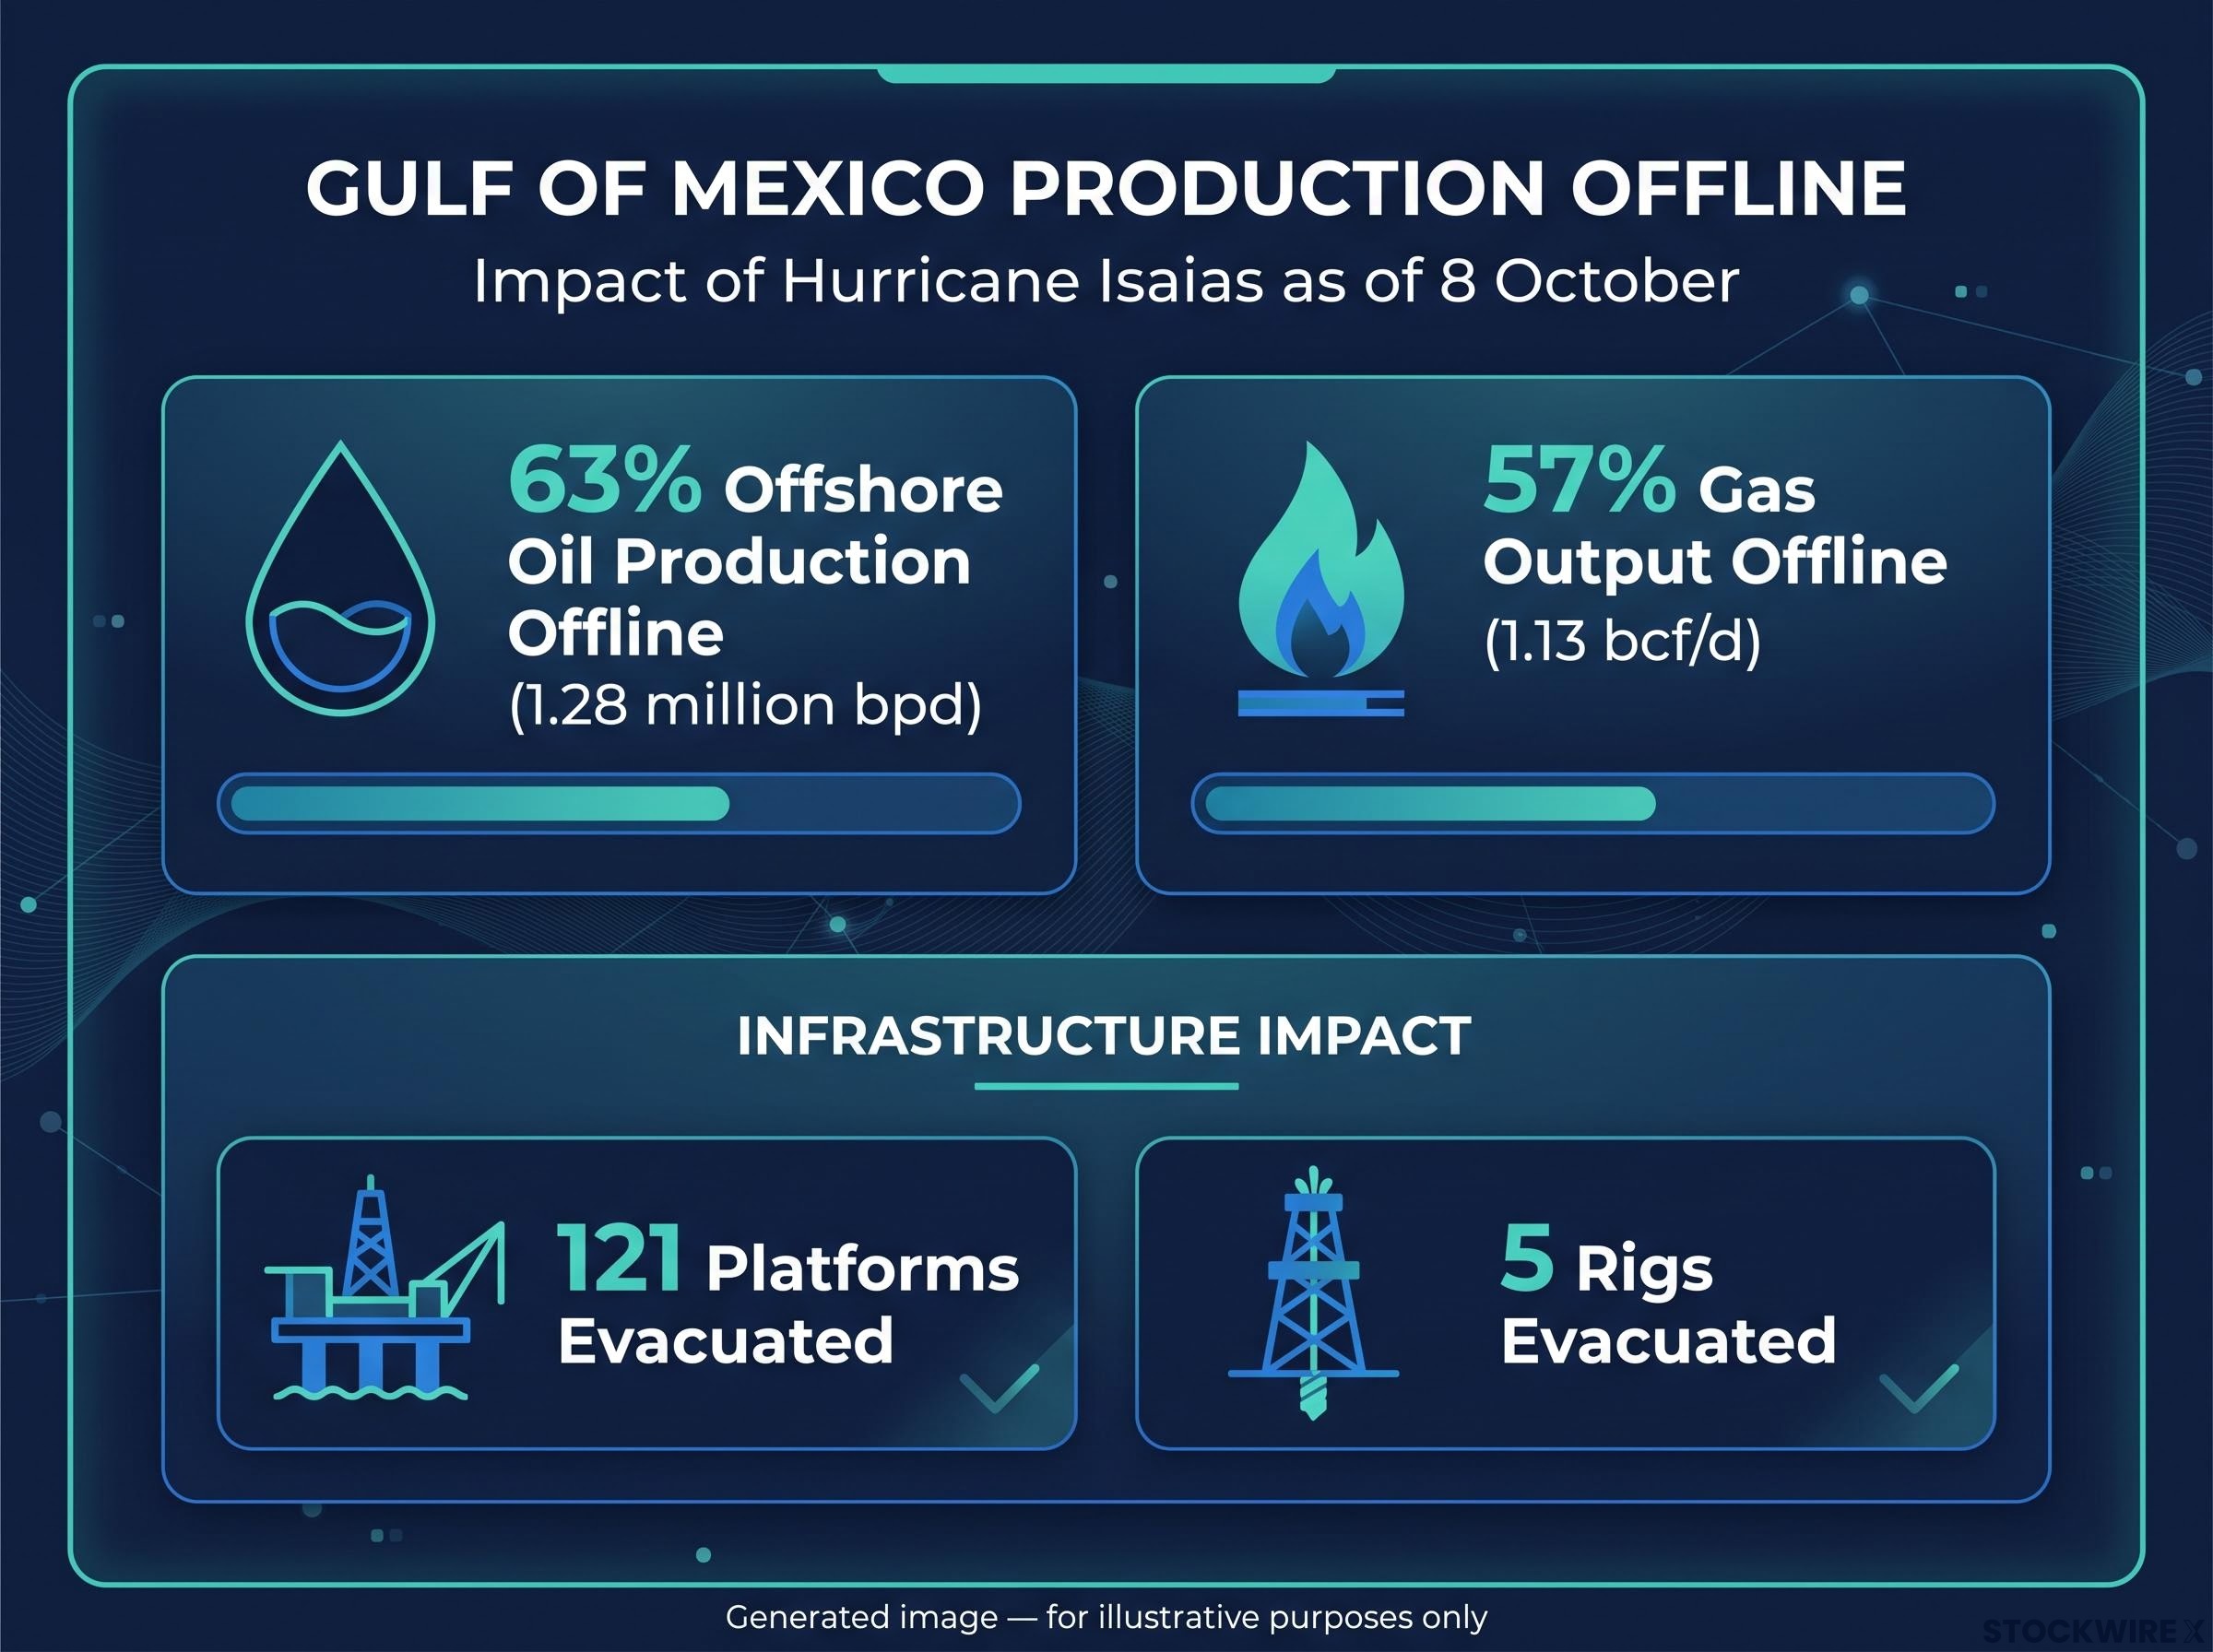
The later number is the better guide to peak impact, and it is more than twice the first headline.
BSEE hurricane activity updates track shut-in oil and gas production and platform evacuations daily during storm events, which is why the Gulf of Mexico outage estimate kept climbing as operators reported in.
Storm outages typically restore faster than conflict disruptions, though. Platforms come back once weather clears; a contested chokepoint has no forecast date. Several forces could also cap prices:
- De-escalation through the reported US-Iran talks or stronger naval protection
- OPEC+ spare capacity being brought to market
- Strategic petroleum reserve releases, none confirmed as of 8 October
- Demand destruction, where prices near US$100 start weighing on fuel use and growth
For your purposes, the split is simple. The Gulf of Mexico shut-in explains the short-term spike, while Hormuz decides whether triple-digit oil lasts.
How does a $103 oil price reach Treasury yields and inflation?
The link is visible on any market screen. Early in the week, energy eased and US Treasury yields drifted lower; by 8 October, oil was rising again and yields followed for a second session.
That pattern is not coincidence. It runs through three channels:
- Inflation expectations. Fuel lifts headline inflation directly, and transport-heavy goods lift it indirectly. If the move persists, investors demand higher yields to compensate.
- Growth and term premium. The term premium is the extra return investors want for holding longer-dated bonds. It can rise if an oil shock looks stagflationary, meaning higher prices alongside weaker growth.
- The policy-rate path. Central banks usually look through temporary energy spikes but may hike, or hold rates higher for longer, if oil feeds into expectations and wages.
| Maturity | Early Oct | 8 Oct | Change |
|---|---|---|---|
| US 2-year | 4.75% | 4.82% | About +7 bps |
| US 10-year | 5.231% | 5.305% | About +7 bps |
| US 30-year | 5.6% | 5.666% | About +7 bps |
The 8 October readings come from the Federal Reserve’s H.15 release and Reuters, and they are the more current set. Policymakers are leaning hawkish: Fed Governor Christopher Waller said additional hikes will likely be needed to return inflation to 2%, and St Louis Fed President Alberto Musalem said more tightening is needed, ahead of the Federal Open Market Committee (FOMC) meeting in late October.
The concern is not limited to Washington. Accounts of the European Central Bank’s September meeting showed all policymakers saw upside inflation risks, while the Bank of England’s Huw Pill and Megan Greene have flagged inflation and wage pressures.
A warning on speed Strategists at Macquarie noted that across the last 50 years, rapid surges in long-term yields have preceded almost all of the big financial crises.
For an Australian investor, US yields shape global borrowing costs and the discount rates used to value shares. That means your energy exposure and your rate exposure are more connected than they look.
What does this mean for ASX energy stocks and geopolitical risk?
The market’s verdict on 8 October was clear. The ASX 200 fell 0.8% to 8,661, while energy rose about 1.3%, led by Woodside Energy, up 2.57% to $32.31, and Santos, up 1.52% to $8.67.
Upstream producers gain from higher realised oil and LNG prices. Downstream names such as Viva Energy and Ampol face a trickier equation, as refining margins depend on crack spreads (the gap between crude costs and refined product prices), and retail margins can be squeezed by competition and political scrutiny during price spikes.
| Company | Segment | 8 Oct move | Sensitivity to higher oil |
|---|---|---|---|
| Woodside | Upstream oil and LNG | +2.57% | Direct benefit via realised prices |
| Santos | Upstream oil and LNG | +1.52% | Direct benefit, more leveraged |
| Viva Energy | Refining and retail | Not reported | Conditional on crack spreads and pricing power |
| Ampol | Refining and retail | About +1% | Conditional on crack spreads and pricing power |
Morningstar offers useful restraint. In March 2026, with Brent up about 40% and Asian spot LNG up about 75%, it left its long-term sector valuations broadly unchanged, because those valuations rest on mid-cycle price assumptions. Spot spikes mainly lift near-term cash flow.
Earlier in this conflict, sector allocation explained more of the gap between ASX winners and losers than market direction did, with energy up 16.1% while the broader index fell 9%.
Motley Fool Australia has described Woodside as backed by a diversified portfolio and conservative balance sheet, and Santos as a leveraged but disciplined exposure. That difference matters if prices reverse.
Lessons from 1990, 2019 and 2022
The 1990 Gulf War spike faded as supply routes normalised. The 2019 Abqaiq attack was short-lived thanks to rapid repair and spare capacity. The 2022 surge after Russia’s invasion of Ukraine cooled through demand adjustment, reserve releases and policy responses.
None matches today exactly, because a physical chokepoint is still under attack. Holding energy stocks here is partly a bet that Hormuz stays impaired, so position sizing should reflect that risk rather than the oil headline alone.
This is general information only and does not consider your personal circumstances.
Reading the next move: what would change the oil picture
The central finding holds across every data set: physical flows, not political statements, are setting the price. Until those flows change, the premium is likely to stay.
Four markers will show whether it does:
- Hormuz transit counts and new UKMTO alerts
- The pace of Gulf of Mexico production restarts
- The late-October FOMC meeting and its signal on further hikes
- The 3 November midterms and any shift in US posture towards Iran
For Australian investors weighing geopolitical risk, the useful question is not whether oil is high, but how much of your portfolio depends on it staying high. The next few weeks of shipping data are likely to answer that more clearly than any speech.
For readers wanting to judge when flows might recover, our detailed coverage of Hormuz normalisation signals sets out five verification steps, from a signed agreement to mine clearance.
This article is for informational purposes only and should not be considered financial advice. Investors should conduct their own research and consult with financial professionals before making investment decisions. Past performance does not guarantee future results. Financial projections are subject to market conditions and various risk factors.