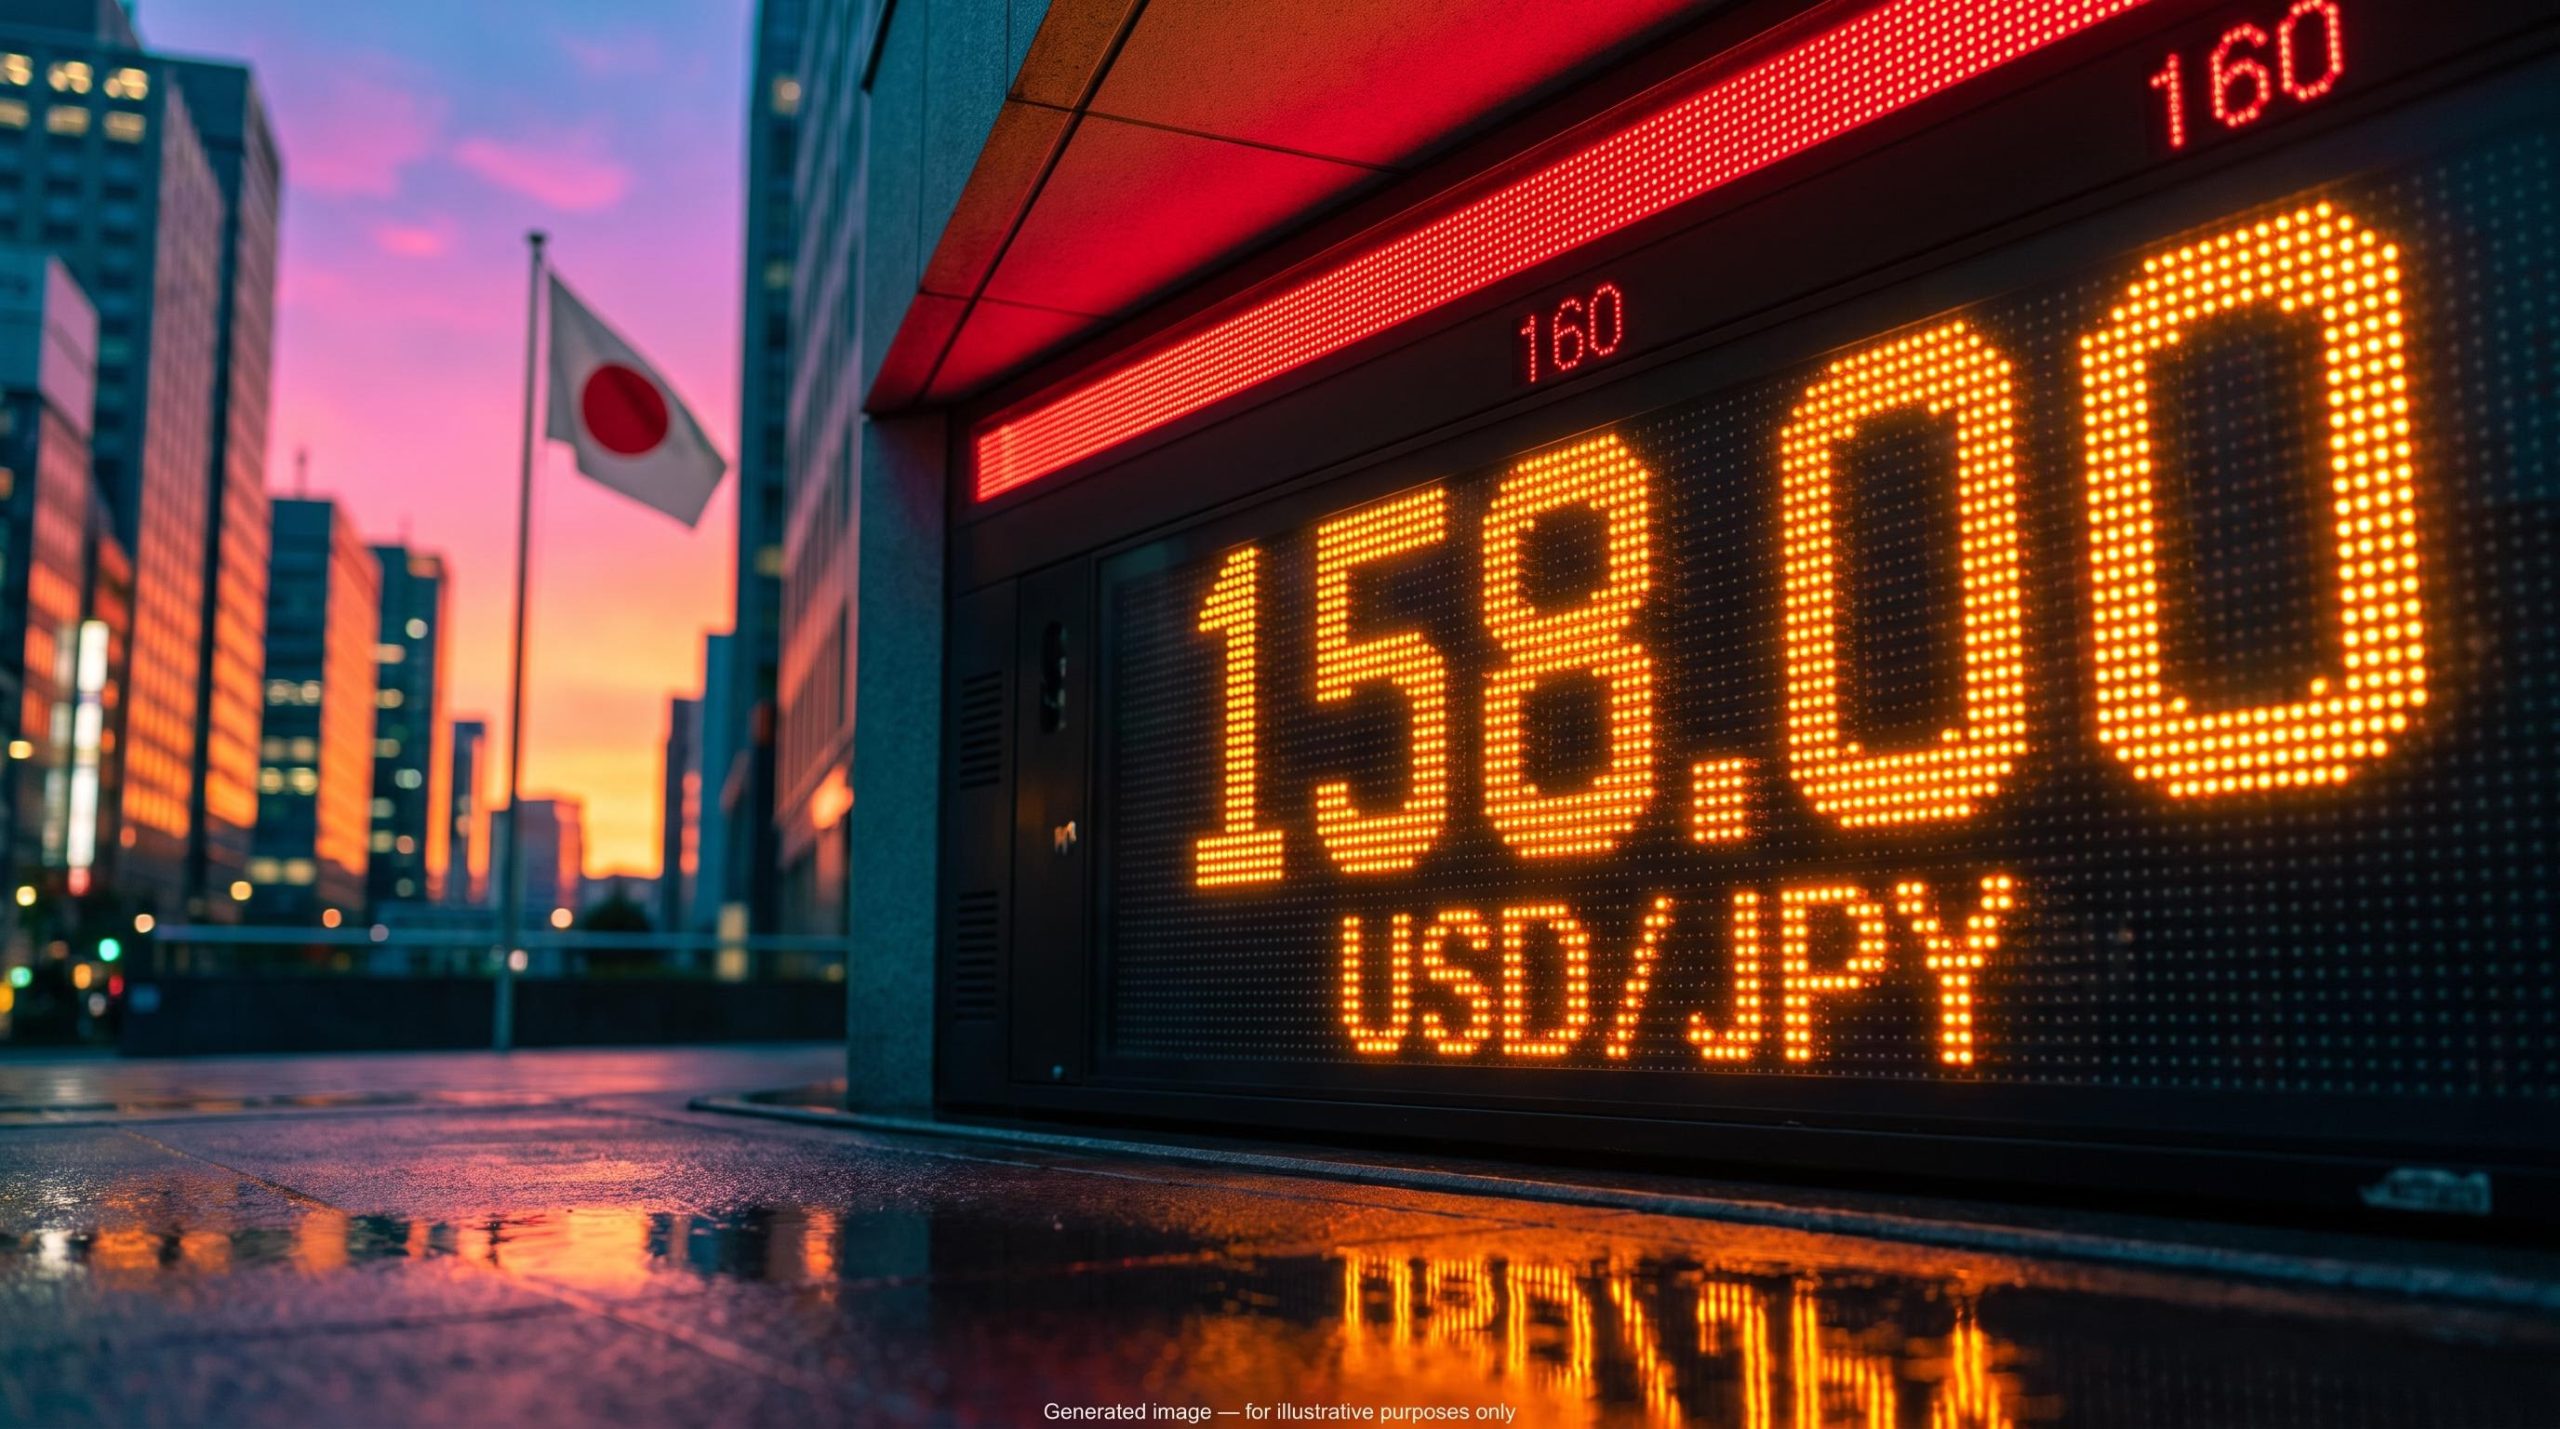
USD/JPY has closed within about 20 pips of 158.00 in every session since 1 October. In that same stretch, the US 10-year Treasury yield hit its highest level since 2002 and Donald Trump made a headline-grabbing pledge on Iran. On the surface the pair looks quiet, but the forces holding it in place are pulling hard in opposite directions, and any near-term USD/JPY forecast has to start there.
Trump’s assurance that the US would not strike Iran before the midterm elections pulled Treasury yields off their peaks. Oil, however, stayed stubbornly high. The pledge also carries an expiry date of 3 November.
That mismatch matters if you follow the dollar, the Federal Reserve or the risk of Japanese intervention near 160. A pair this tightly pinned tends to move sharply once one side gives way.
Here is what is holding the range, which levels deserve your attention, and which releases could break it: US CPI on 14 October, then retail sales and producer prices on 15 October.
Why did an Iran pledge move yields but not oil?
The textbook-tidy assumption runs like this. De-escalation means less risk to oil supply, so crude falls. Cheaper energy cools inflation, the Fed has less reason to hike, and yields drift lower.
The chain has real logic behind it. Food and energy add about one percentage point to headline US inflation, which is why August CPI came in at 3.4% headline against 2.4% excluding food and energy. Earlier this year the chain worked in reverse: on 17 August, when Trump cast doubt on extending an Iran ceasefire, Brent pushed above $91 and the 10-year moved toward its session highs.
This week, the pattern broke.
Trump posted on Truth Social that the US would not strike Iran before the midterms. He described the discussions with Tehran as productive, yet the US blockade stayed as it was, and the assurance runs only to 3 November. The 10-year yield, which had peaked at 5.34% according to Reuters and as high as 5.36% according to NBC News, eased to about 5.22% by Thursday’s close.
Oil is where the accounts diverge. The original FXStreet report described Brent dropping quickly after the post. NBC News reported on 8 October that Brent closed at $104.28, about 4% higher, with WTI at $91.49, up roughly 3.6%.
| Source | Date | Metric | Level |
|---|---|---|---|
| FXStreet | After Trump’s post | Brent reaction | Dropped quickly (no level given) |
| NBC News | 8 October 2026 | Brent close | $104.28 (about +4%) |
| NBC News | 8 October 2026 | WTI close | $91.49 (about +3.6%) |
| Reuters | 1 October 2026 | 10-year intraday peak | 5.34% |
| NBC News | 7 October 2026 | 10-year intraday peak | 5.36% |
The likeliest explanation is timing. A brief dip within the session and a higher close measured against a different baseline can both be true.
Oil staying elevated fits a wider pattern: the crude oil bear case treats current prices as a supply squeeze, with front-month WTI sitting about 20.6% above the contract twelve months out.
Trader behaviour check Bloomberg reported on 8 October that oil traders have increasingly “tuned out” Trump’s Iran rhetoric, with prices driven more by actual disruptions and fundamentals.
What this tells you is that the bond market priced a lower term premium and less war risk, not cheaper energy. The term premium is the extra yield investors demand for holding a long-dated bond instead of rolling short-term ones. Because oil never cooperated, the yield relief rests on sentiment rather than on inflation actually easing, so it may prove less durable than it looks.
When big ASX news breaks, our subscribers know first
What the 158.00 range, the rate gap and 160 intervention risk tell you
Lower US yields fed straight into the currency. USD/JPY tracks the gap between US and Japanese interest rates, and when that gap narrows, the dollar loses part of its appeal over the yen.
The session showed both forces at work. The pair dipped toward 157.50 once on Japanese intervention speculation. A second drop followed Trump’s statement, starting from a peak just below 158.50 and ending beneath the 200-day moving average.
Later, St. Louis Fed President Alberto Musalem told an audience in New York that rate rises should come within the next six to nine months. USD/JPY won back about one third of its fall and finished a touch under 158.00. Both dips held above Monday’s low.
The technical levels
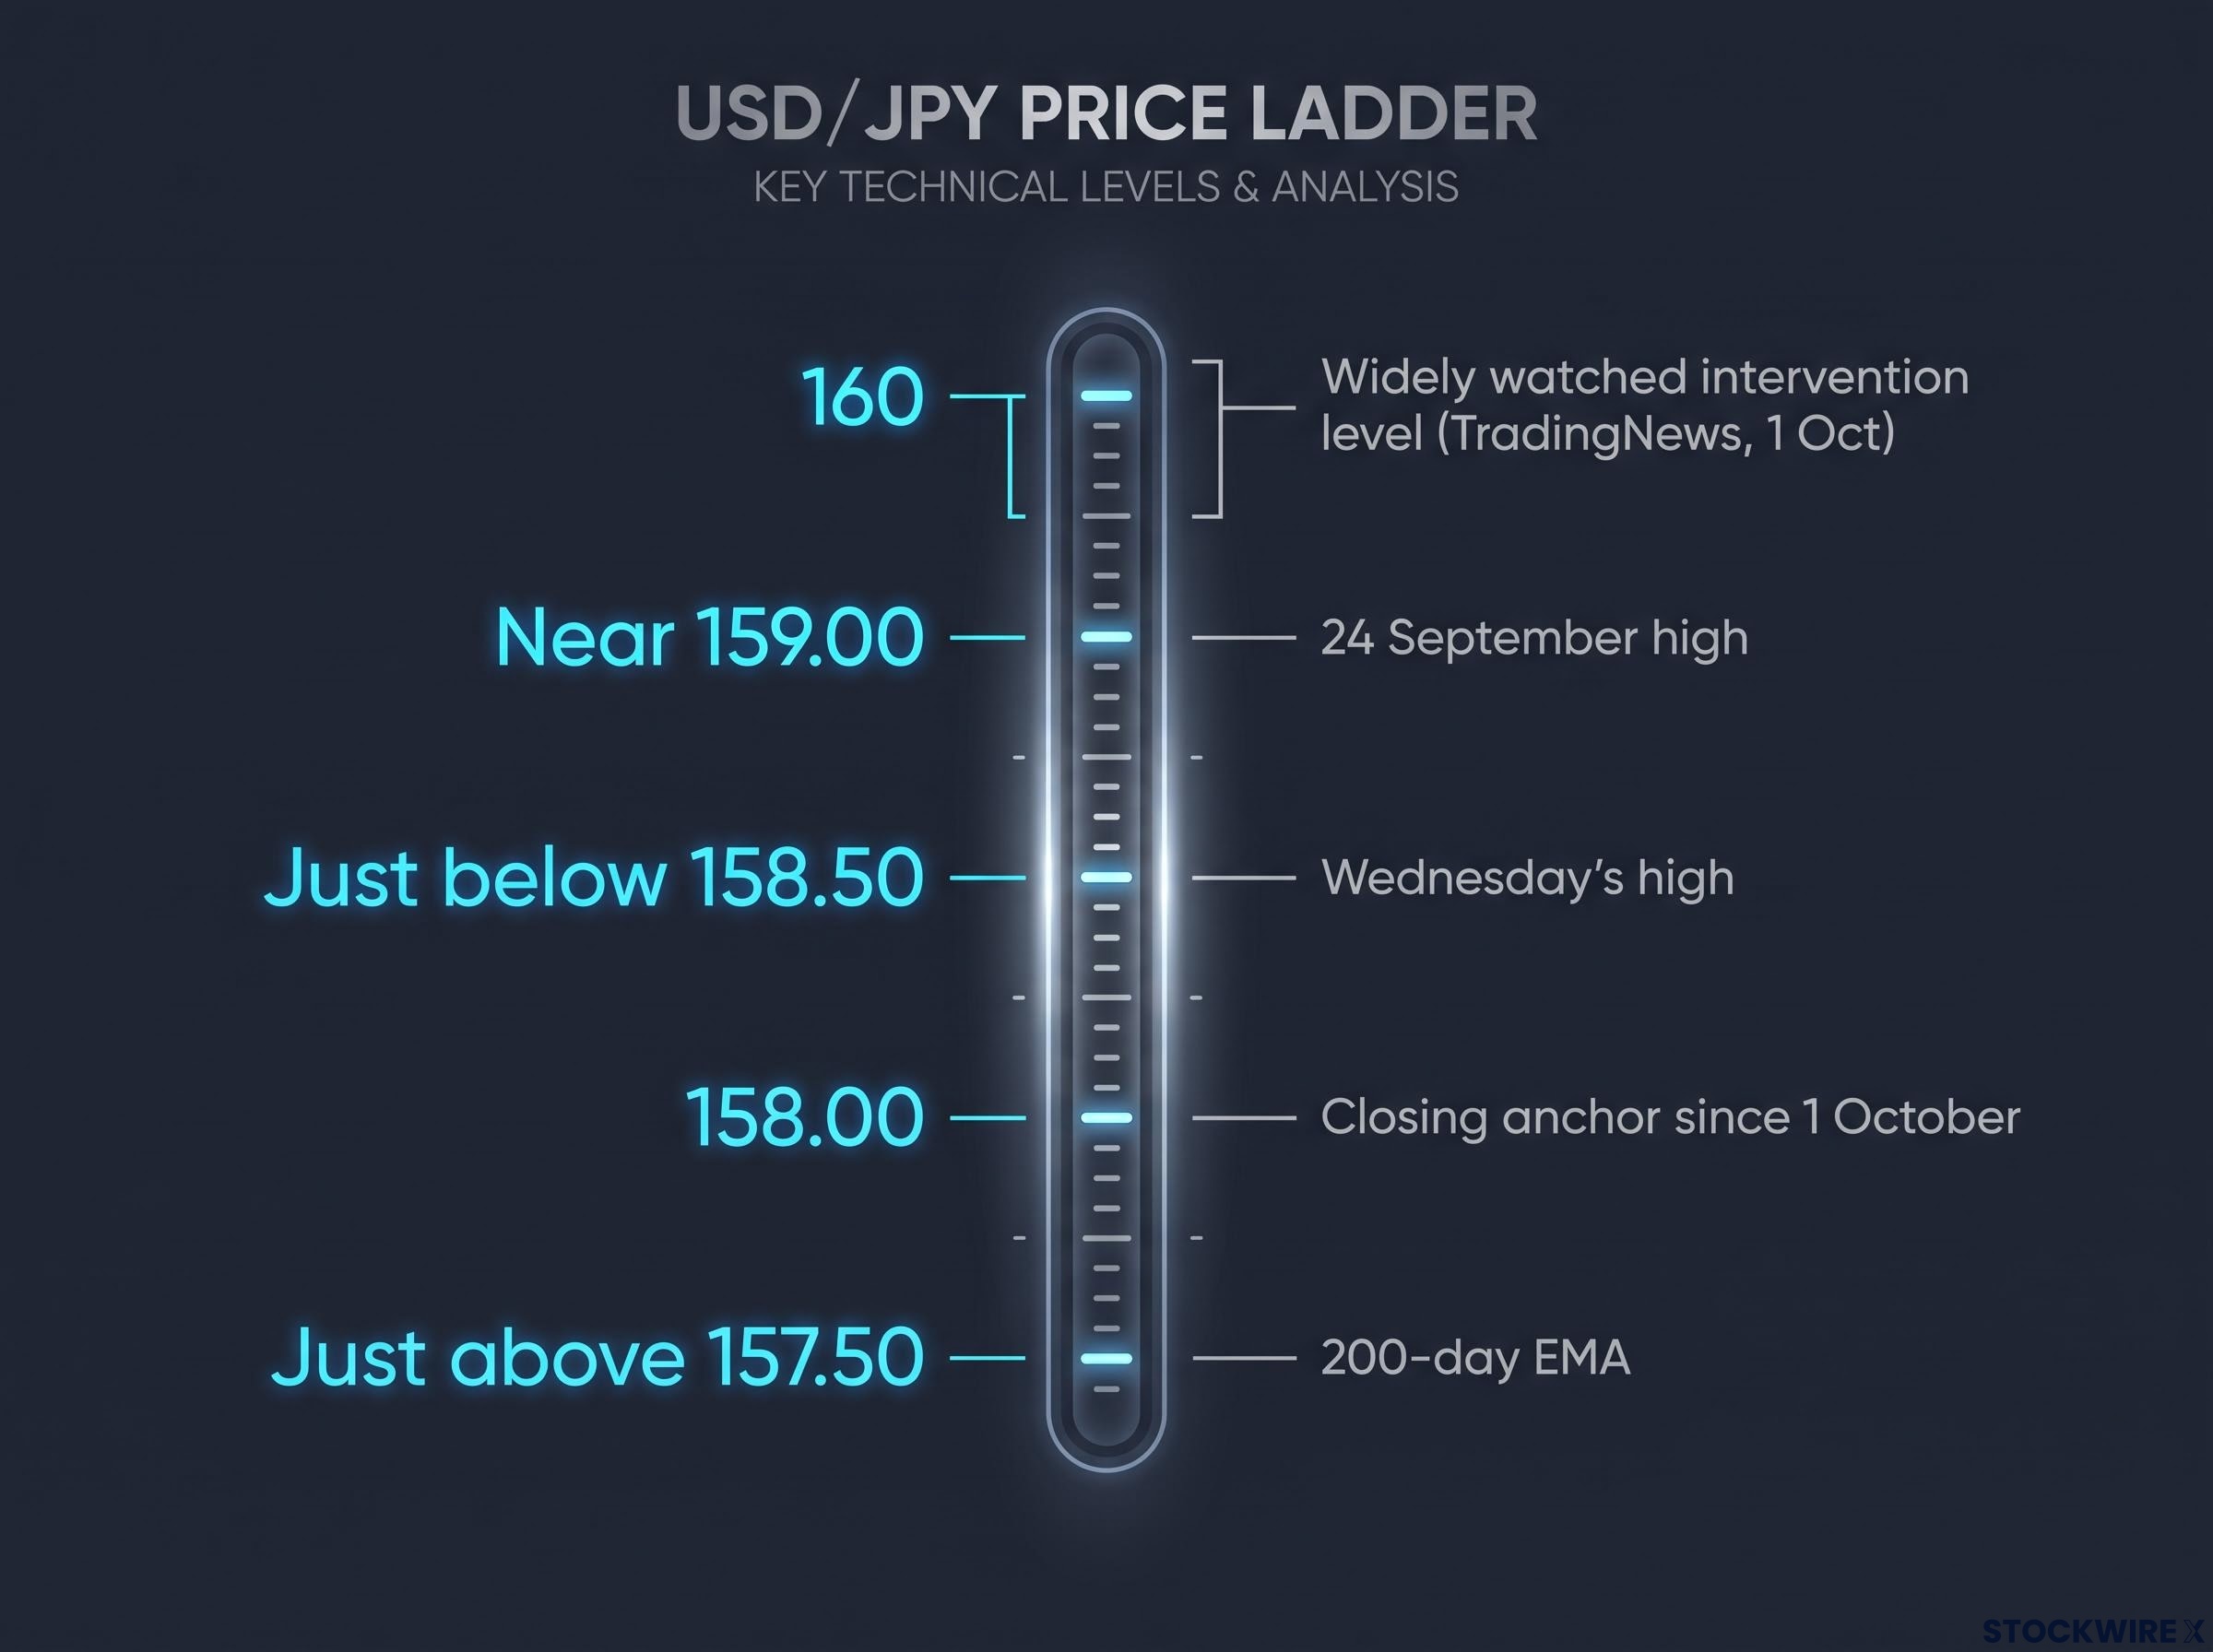
An exponential moving average (EMA) is an average of recent prices that gives more weight to the latest sessions. The 200-day EMA sits just above 157.50, with the 50-day EMA above it. The pair closed between the two.
| Level | What it represents | What a move there would signal |
|---|---|---|
| Just above 157.50 | 200-day EMA, tested twice | Sustained break would suggest the rate-gap squeeze is winning |
| 158.00 | Closing anchor since 1 October | Continued balance between Fed and intervention risk |
| Just below 158.50 | Wednesday’s high | Break would point to renewed Fed hike bets |
| Near 159.00 | 24 September high | Momentum building toward the intervention zone |
| 160 | Widely watched intervention level | Rising risk of official yen buying and sharp reversal |
Why 160 is the ceiling traders fear
TradingNews reported on 1 October that market participants increasingly see 160 as the level where Japanese authorities would likely step in. Japan’s Ministry of Finance directs intervention and the Bank of Japan (BoJ) carries it out.
The threat caps the upside. A push through 160 could trigger an abrupt reversal and squeeze carry trades, which are positions that borrow cheaply in yen to buy higher-yielding dollar assets. Rapid unwinding of those positions can spill into global risk appetite.
The rate gap explains why buyers keep returning: the Fed funds rate sits at 3.75%-4.00% against the BoJ’s 1.25%, a gap of 2.50-2.75 percentage points. With hawkish Fed talk supporting the floor and intervention fear capping the top, you are looking at a range to respect, not a trend to chase, until a catalyst forces the issue.
The rate differential of roughly 250-275 basis points explains why every Tokyo hike so far has failed to lift the yen; until that gap closes, Bank of Japan moves are largely structurally irrelevant to the pair.
How the Yen’s core drivers help you read these moves
The single mechanism behind most of this is the rate gap. If you can borrow yen near zero and earn far more in dollars, you sell yen, and the pair rises.
That gap does not act alone. Four forces shape the yen:
- Japan’s economy: growth and inflation at home influence how far the BoJ can lift rates.
- BoJ policy: tighter policy tends to support the yen, looser policy weakens it.
- US-Japan yield differentials: wider gaps favour the dollar.
- Risk sentiment: the yen tends to strengthen when markets are under stress.
The BoJ’s ultra-loose policy from 2013 to 2024 shows these drivers in action. While the Fed raised rates, Japan held its own near the floor, and that divergence weakened the yen and fuelled yen-funded carry trades. The gradual unwinding since then has offered the currency some support.
History adds one warning. Past interventions have produced abrupt reversals worth several yen when officials judged the currency’s weakness excessive.
Past action has not been only unilateral: the 31 July coordinated intervention, with the US Treasury selling euros to buy yen, was only the second joint operation since 1973 and pulled the pair sharply lower.
Those forces combine into three competing ways of reading the pair.
| Lens | What it implies for USD/JPY | What would trigger it |
|---|---|---|
| Carry trade | Supports a higher pair | US 10-year holding above 5% while Japanese yields stay far lower |
| BoJ normalisation | Narrower gap, yen rally | Credible further BoJ tightening |
| Safe haven | Yen demand spikes despite the gap | Severe global stress, including spillover from the Iran conflict |
One gap is worth flagging. The research found no named strategist and no recent Ministry of Finance statement tying the 158-160 zone specifically to BoJ normalisation or safe-haven flows, so those lenses remain frameworks rather than sourced calls.
For now, carry dominates because the US 10-year sits above 5%. A sharp risk-off event or a BoJ surprise could flip that quickly, so ask which lens a headline feeds before you react to it.
Which data and risks could break the range before November 3?
The clock is already running, and the calendar is dense.
Calendar catalysts
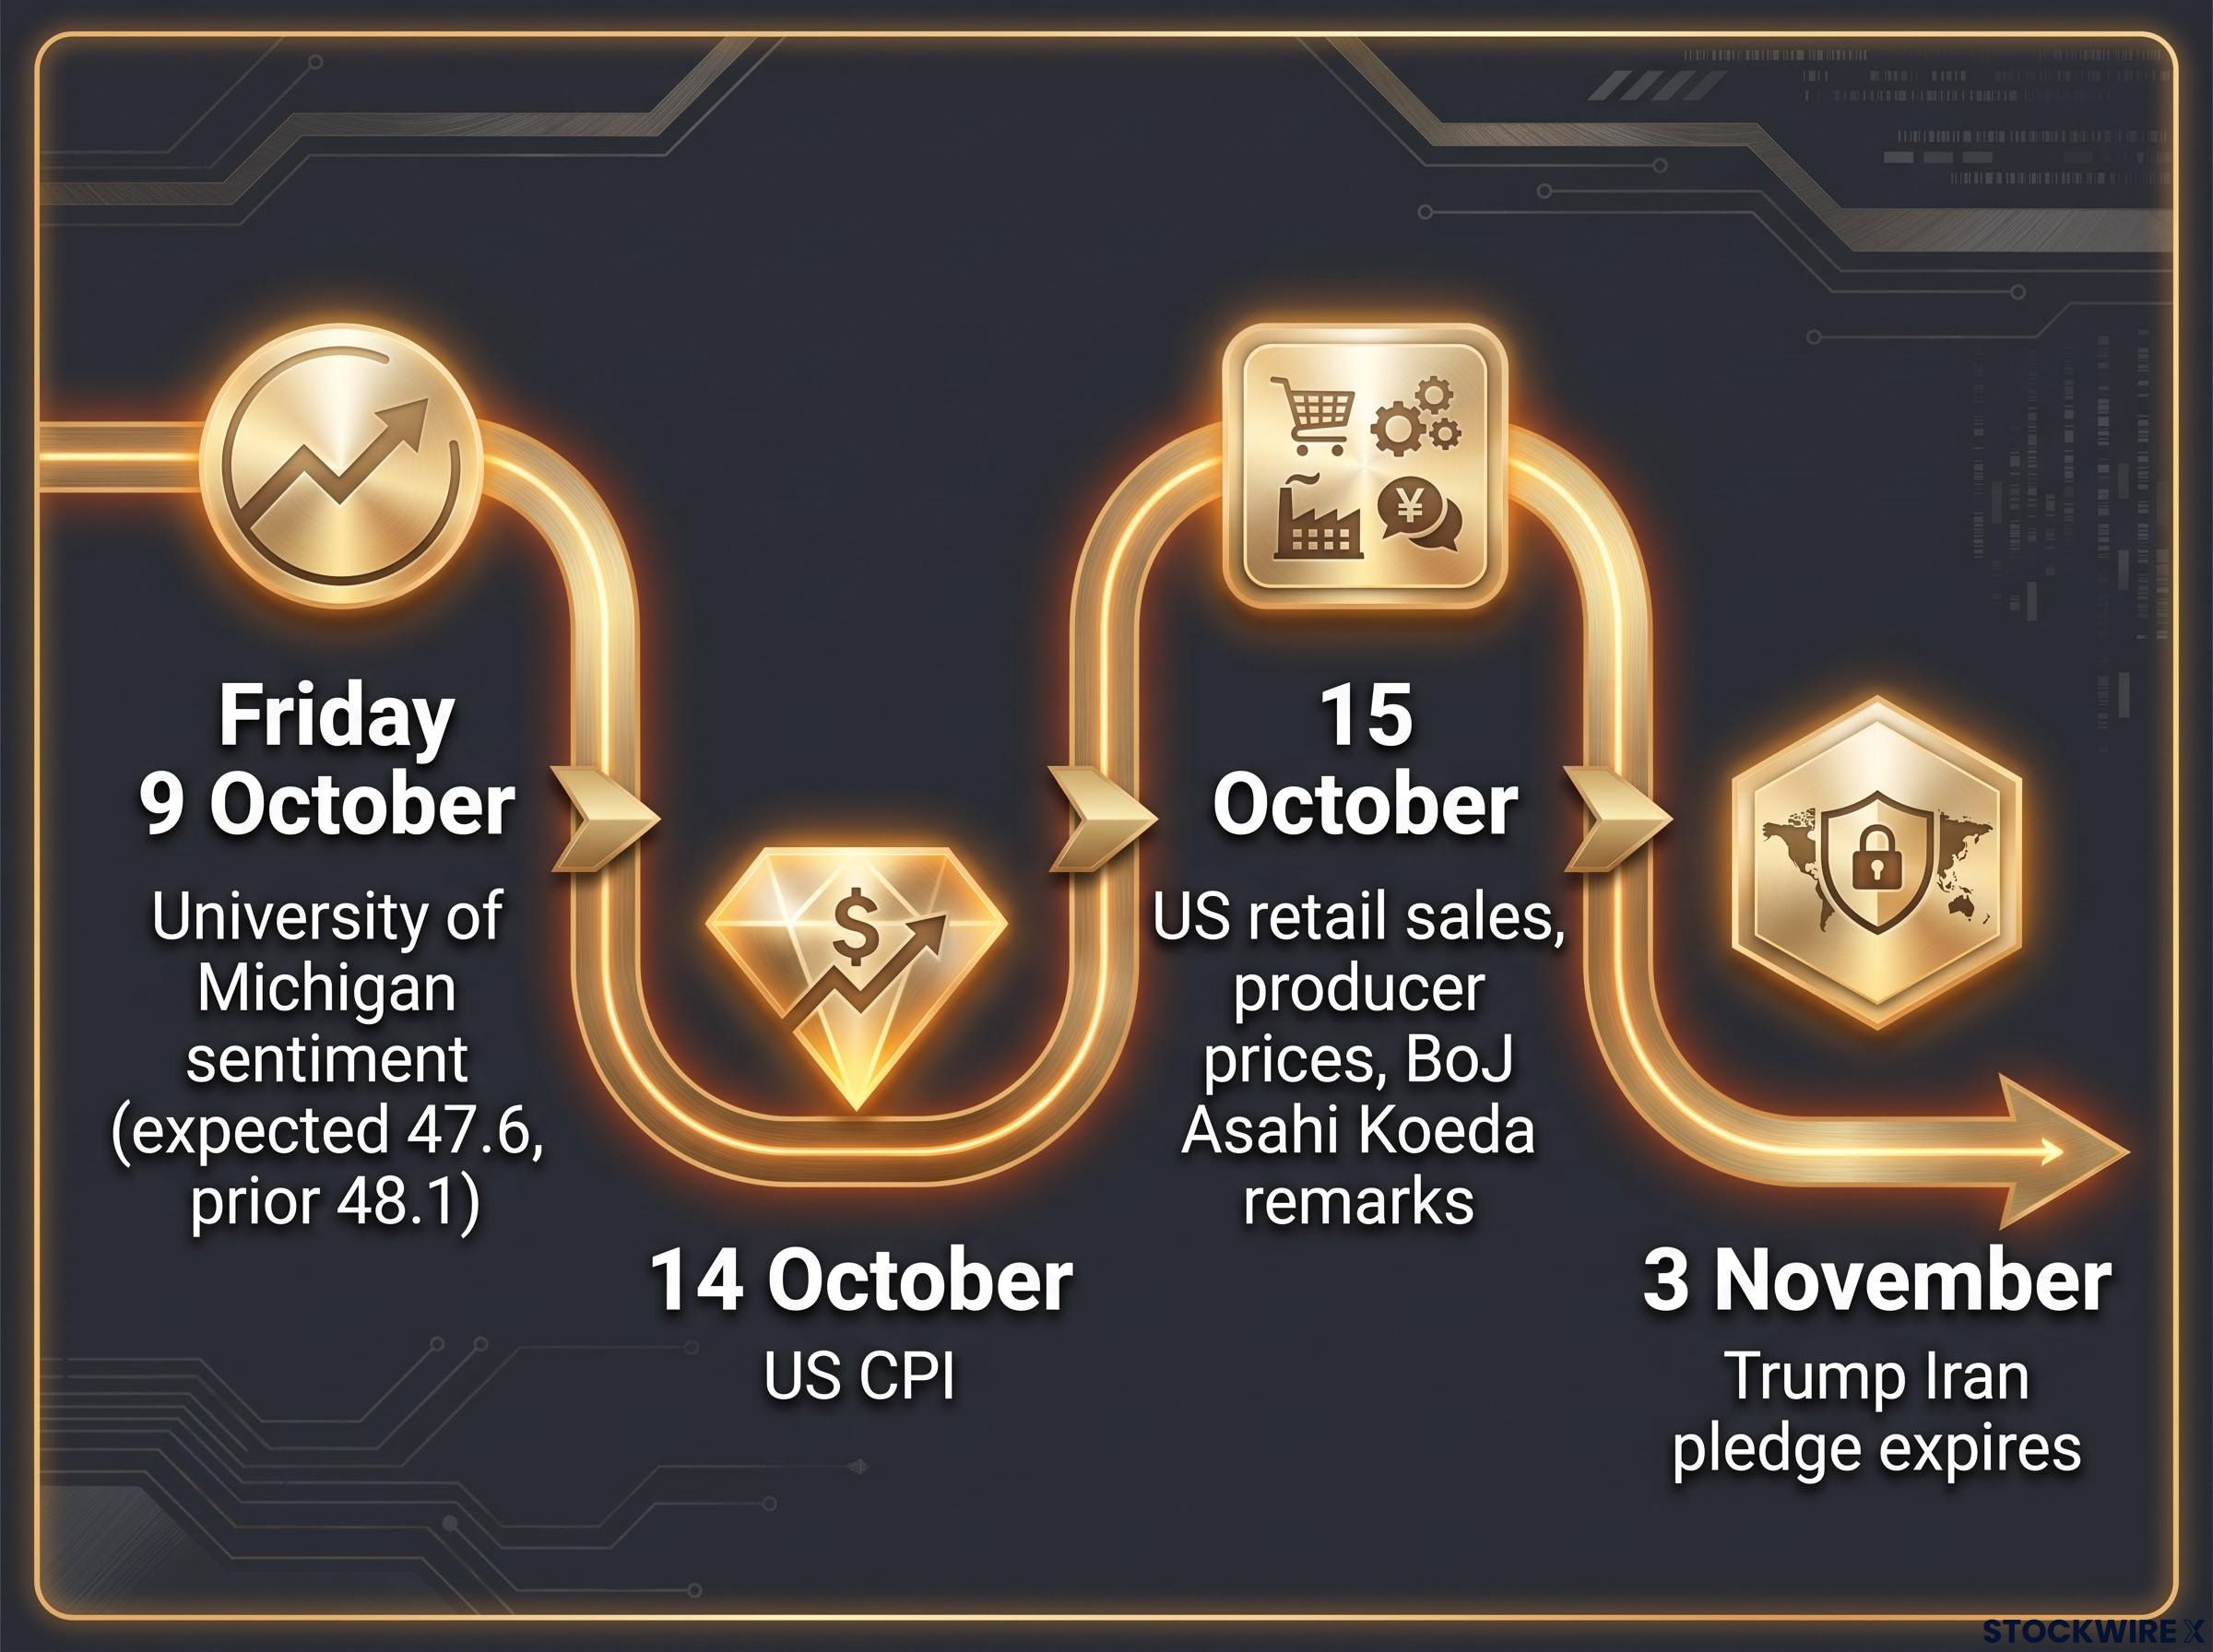
- Friday 9 October: University of Michigan sentiment, expected to dip to 47.6 from 48.1.
- 14 October: US CPI, the main event and the clearest test of Fed hike expectations.
- 15 October: US retail sales and producer prices, plus remarks from BoJ board member Asahi Koeda.
Consensus forecasts for CPI, retail sales and producer prices were not available beyond qualitative expectations, so treat the outcomes below as conditional scenarios.
| Outcome | Likely Fed read | USD/JPY implication |
|---|---|---|
| Firm core CPI | Strengthens hike bets | Could push toward 159.00 |
| Soft CPI | Eases pressure for further hikes | May keep closes near 158.00 |
CPI is the likeliest range-breaker because it speaks directly to the Fed side of the rate gap.
For readers wanting to test how firm Fed hike expectations really are, our deep-dive into the Fed rate path shows why major banks still disagree by 50 basis points on the terminal rate.
Risks that could reverse the easing
The assumptions beneath the calendar are fragile. The pledge expires on 3 November, and renewed military uncertainty after that date could reignite oil and inflation pressure and undo this week’s yield relief.
Oil has not come down. Bloomberg’s finding that traders discount rhetoric cuts both ways: markets may shrug at assurances yet react hard to an actual attack or shipping disruption.
Bonds are also exposed. Reuters and TradingEconomics place yields near 24-year highs after the worst quarterly rise in decades, so a disappointing inflation print could reprice the curve fast, and a sprint toward 160 risks disorderly moves if Tokyo acts. Treat 3 November as the point where today’s calm faces its real test.
These scenarios are speculative and subject to change with market developments. Past performance does not guarantee future results.
A range worth respecting until CPI says otherwise
The chain is now clear. Trump’s pledge cut perceived war risk, the term premium fell, the US-Japan rate gap narrowed, and USD/JPY stayed pinned near 158.00.
That range rests on two supports: Fed hawkishness below and intervention fear above. It also leans on a pledge that ends on 3 November.
Your first watch-point is 14 October CPI. If the pair clears 159.00, the next question is how close it can get to 160 before Tokyo responds. Working through conditional scenarios will serve you better than betting on a single number.
This article is for informational purposes only and should not be considered financial advice. Investors should conduct their own research and consult with financial professionals before making investment decisions.