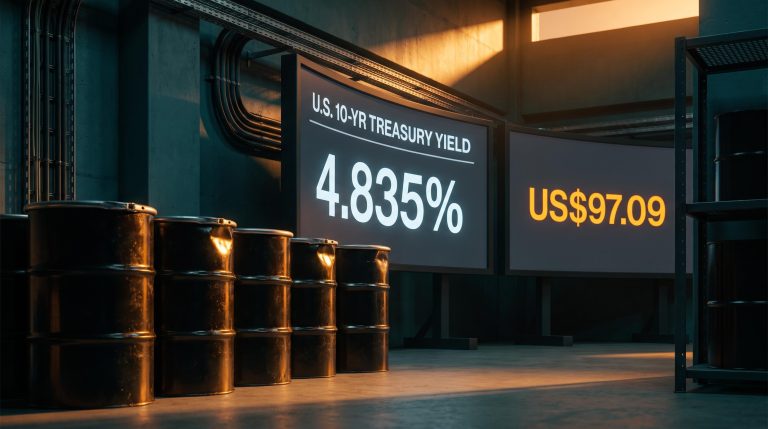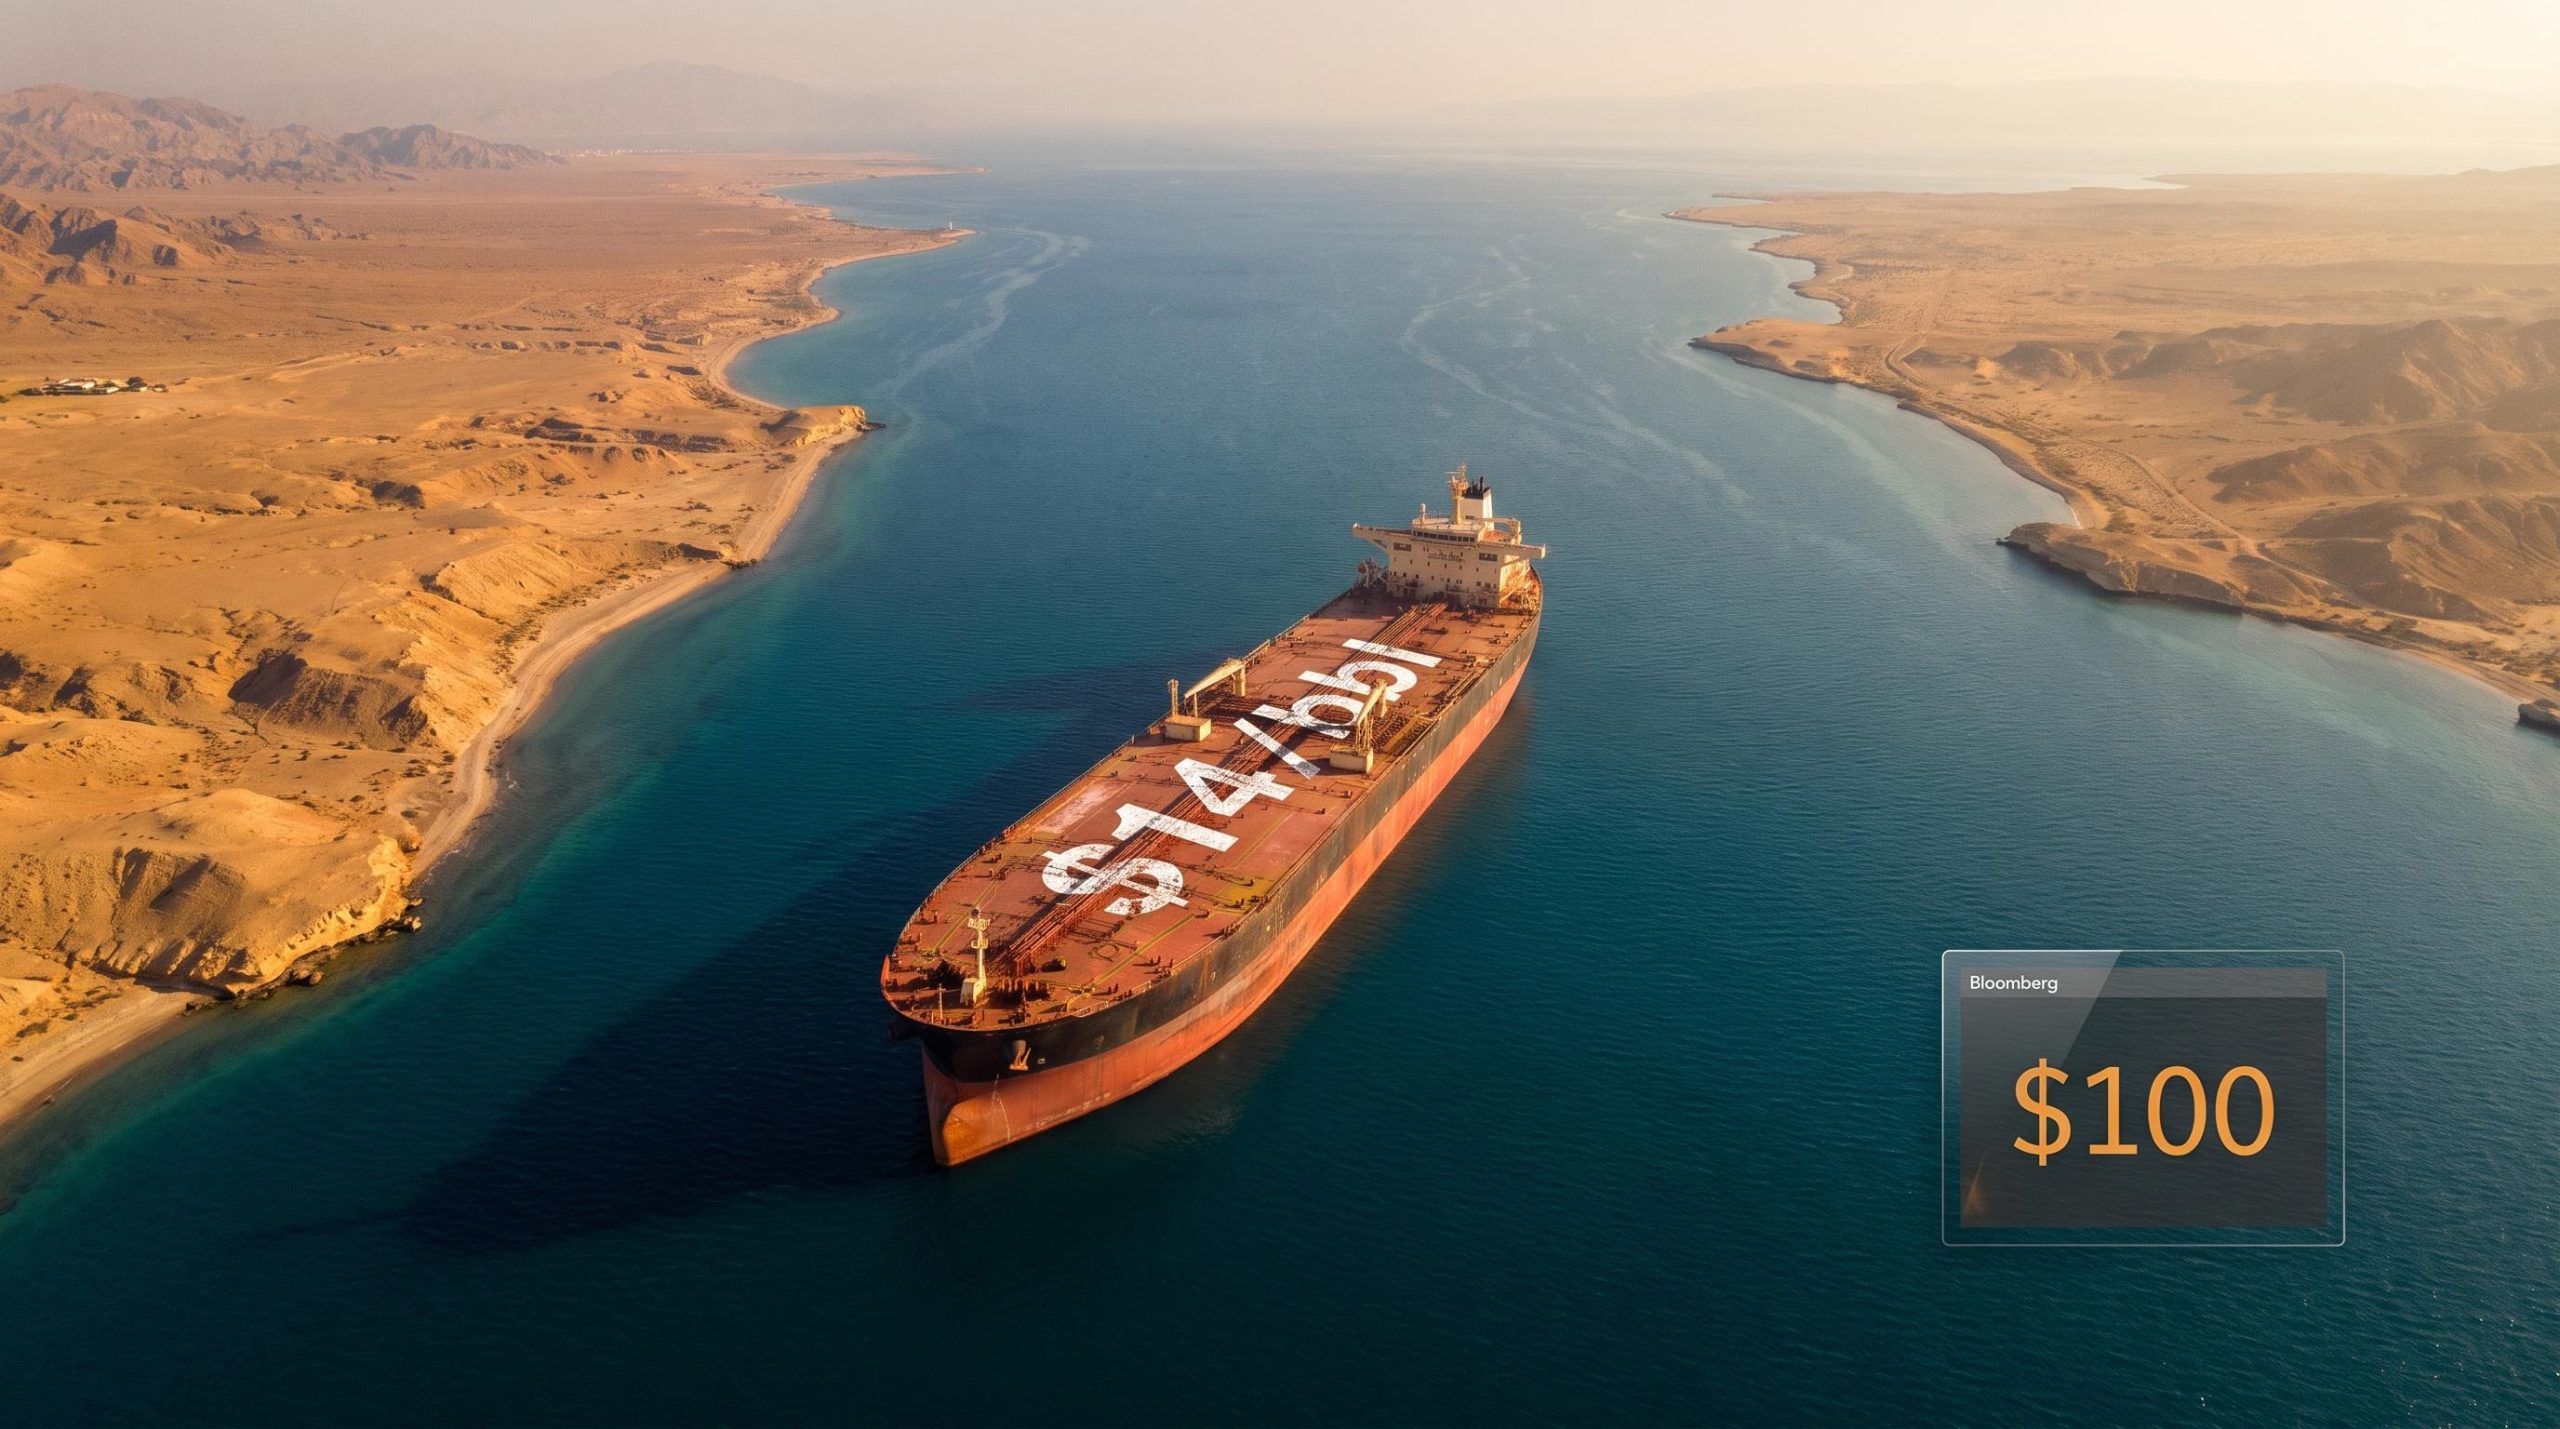
There is a number on the crude oil screens right now that carries more weight than any single data point should. That number is $100.
Oil has not settled above triple digits since March 30, 2026. When it does, a supply disruption stops being a story confined to the commodities desk and becomes something that reaches into consumer prices, central bank meetings, and the value of positions held by investors who have never once thought about the geography of a Middle Eastern shipping lane.
Here is the tension worth holding onto. This is not a demand-driven rally. According to Goldman Sachs, roughly $14 per barrel of the current price is a geopolitical risk premium, the market’s price for the possibility that the Strait of Hormuz stays constrained. That premium is severe in its cause and fragile in its nature: it can collapse within 24 hours on a single de-escalation signal, even as the structural disruption beneath it remains very real.
What follows maps the actual causal chain, from the Strait to the pump to the portfolio, so you can separate durable analytical signal from event-driven headline noise and make a more informed call on your own exposure.
Why $100 oil is a risk premium, not a fundamentals story
Start with what the market would look like if the guns went quiet tomorrow. According to the International Energy Agency (IEA), absent the current disruptions, underlying supply growth would outpace demand through 2030, with the market projected to return to surplus later in 2026. In other words, the physical balance of barrels does not justify triple-digit crude. Something else is doing the work.
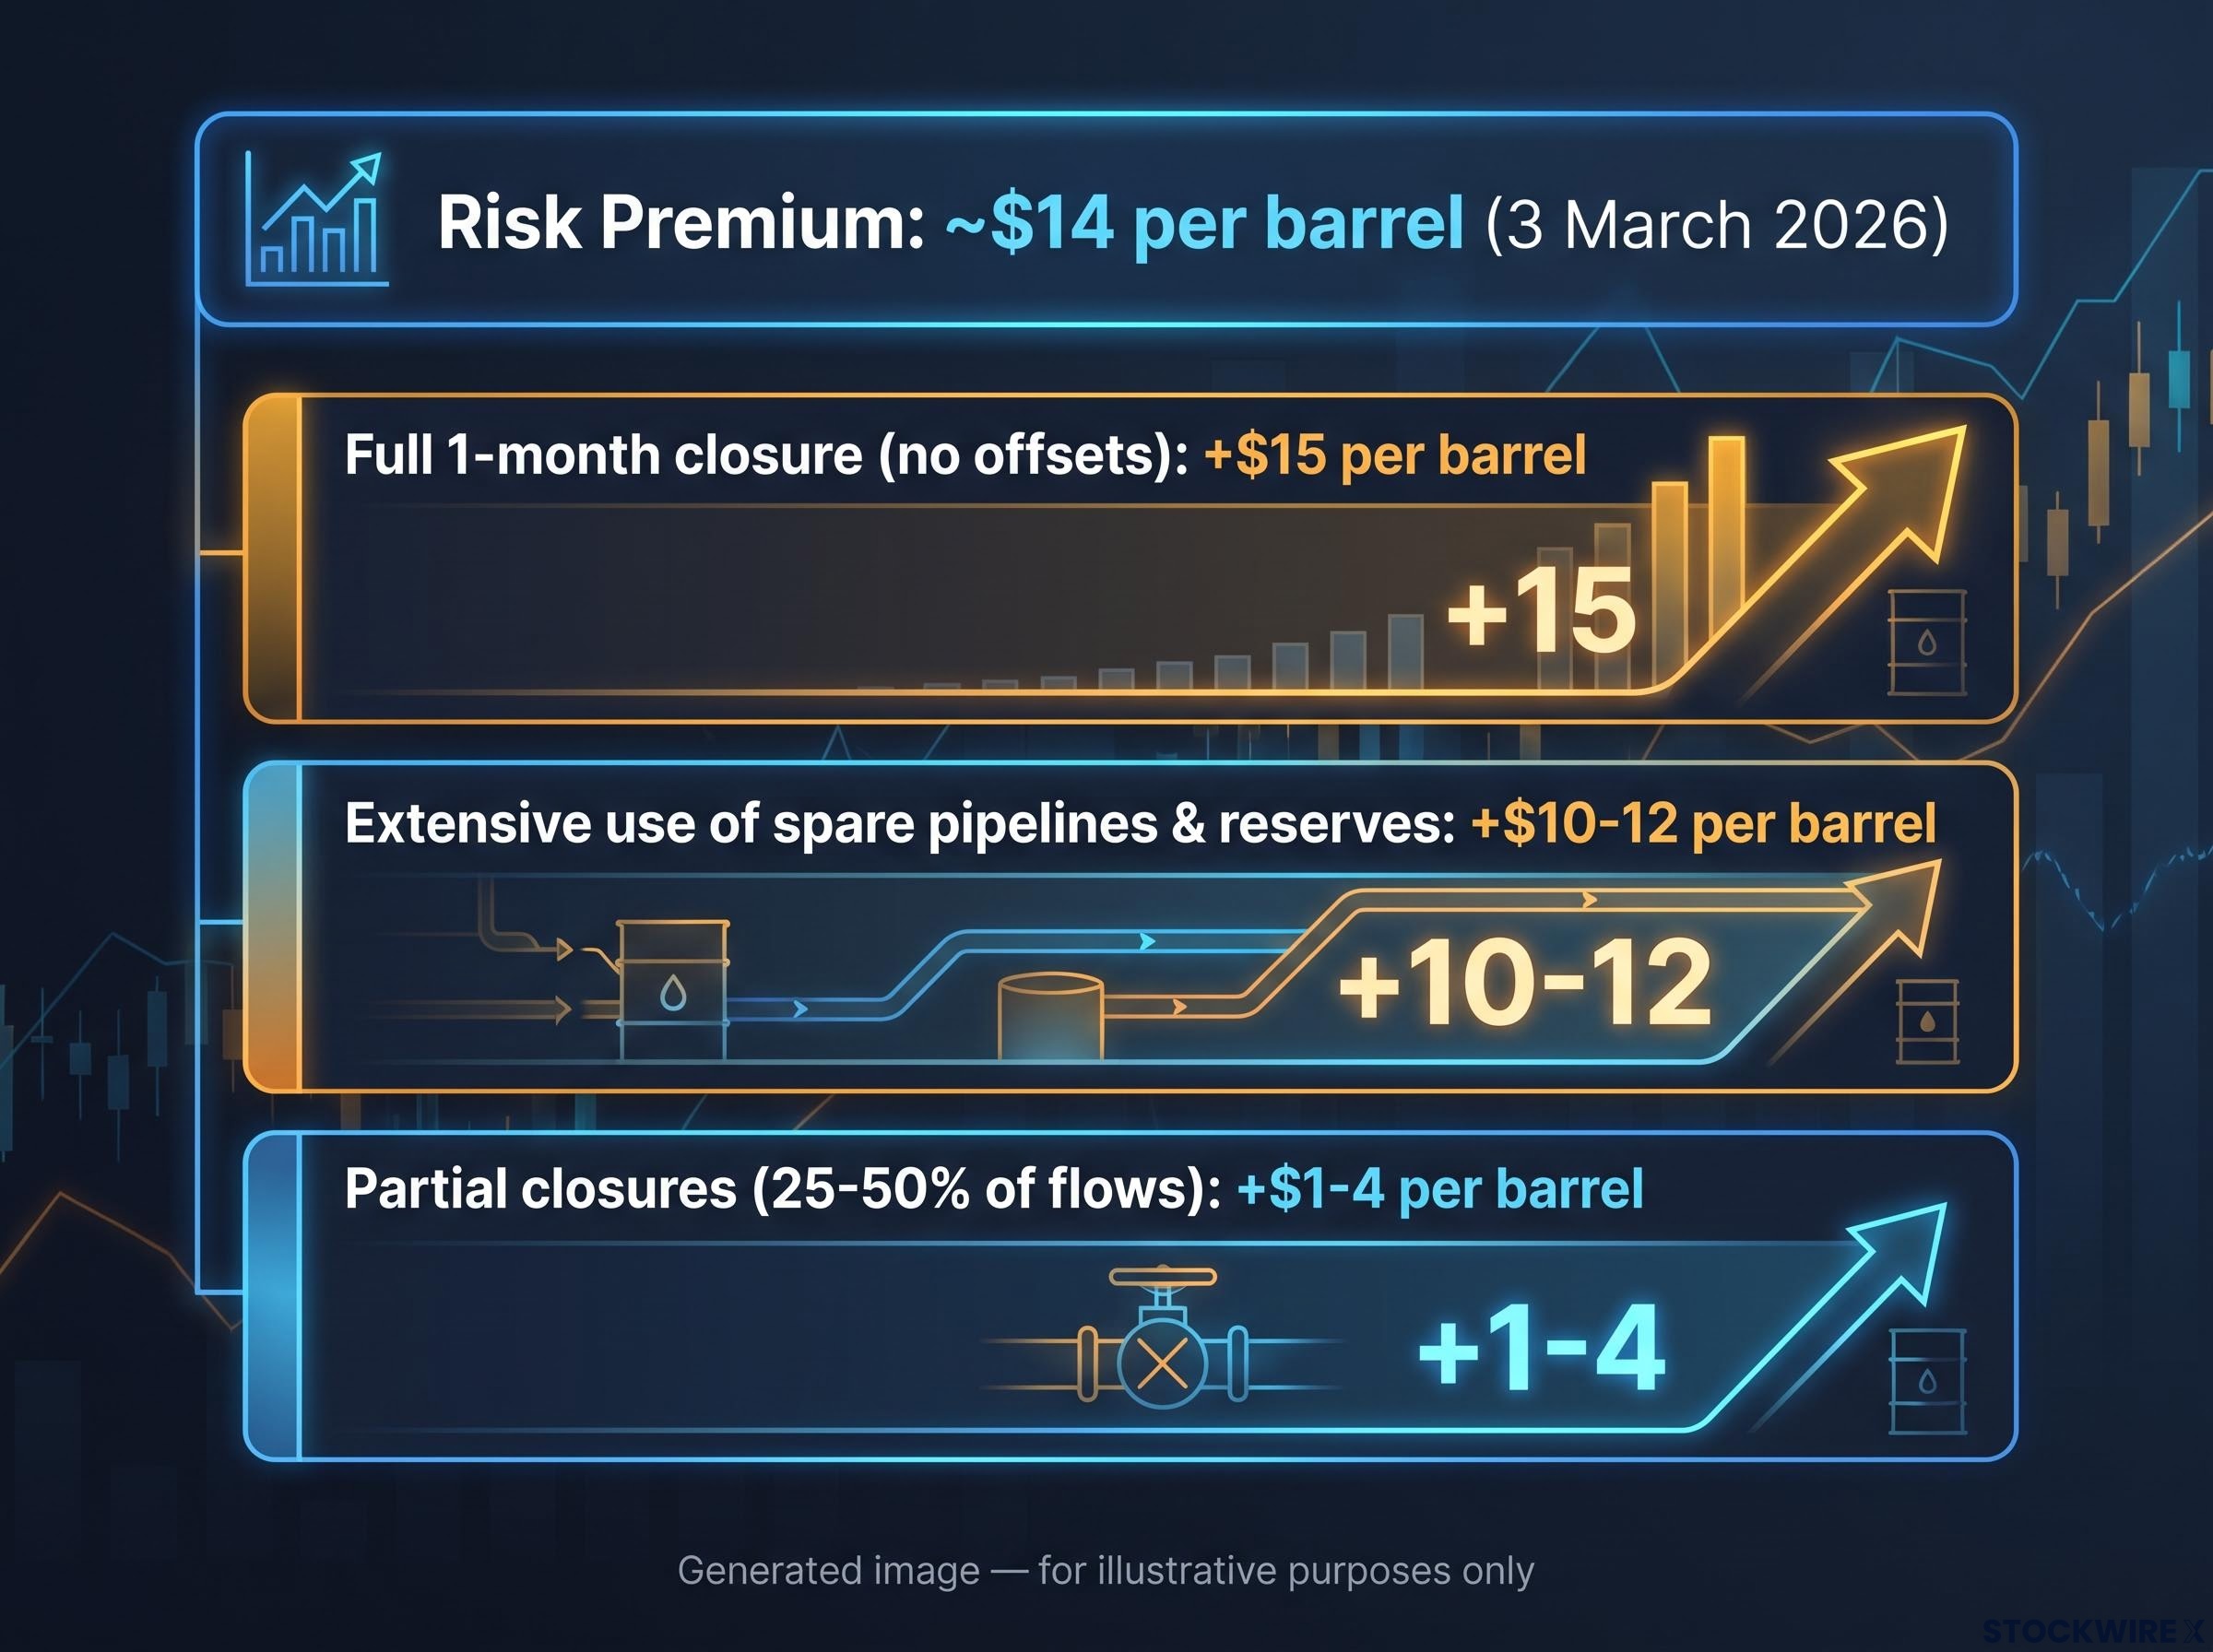
That something is a risk premium, and Goldman Sachs put a number on it: approximately $14 per barrel as of 3 March 2026. A risk premium is not a bet on certainty. It is the market pricing a probability distribution of outcomes, weighing the chance of a full Hormuz closure against the chance of de-escalation and everything in between.
Goldman’s scenario modelling makes the arithmetic of that distribution visible:
- A full one-month closure with no offsets could add around $15 per barrel.
- Extensive use of spare pipelines and strategic reserves could soften that impact to roughly $10-12 per barrel.
- Partial closures affecting 25-50% of flows might add only $1-4 per barrel.
The important quality of this premium is its instability. Historically, risk premiums that spiked above $15 per barrel have collapsed to a couple of dollars within 24 hours once de-escalation signals appear. That fragility sits underneath the current quote whether the screens acknowledge it or not.
The Hormuz risk premium carries a structural quality that distinguishes it from typical geopolitical spikes: the IEA projects a two-year supply chain recovery timeline even under a best-case resolution, meaning any diplomatic breakthrough compresses the premium slowly rather than snapping it back to pre-crisis levels.
The IEA has characterised the situation as “the largest supply disruption in the history of the global oil market.”
Here is the number to hold in your mind. The gap between the fundamentals-implied price and today’s quote is a direct read on how much of the current crude price is geopolitical anxiety rather than physical scarcity. That gap tells you exactly how exposed your energy-linked positions are to a diplomatic headline, and how quickly they could reprice if one arrives.
When big ASX news breaks, our subscribers know first
What the Strait of Hormuz crisis actually looks like on the ground
The effective closure the market is pricing did not arrive as a single shock. It was a pattern of thresholds crossed over roughly six months, each one visible and each one raising the stakes.
The escalation ran like this:
- 1 March 2026: At least three tankers were damaged off the Gulf coast in Iranian retaliation for US and Israeli strikes, sending more than 200 vessels to anchor around the Strait.
- 17 April 2026: Iran’s Islamic Revolutionary Guard Corps Navy declared the Strait closed until a US blockade on Iranian ports was lifted.
- 2 July 2026: Iran’s joint military command demanded all tankers follow Iran-approved routes or face a forceful response.
- 7 July 2026: A US-led naval coalition raised the threat level in Hormuz to “severe.”
- 6 September 2026: Analysts effectively considered the Strait shut.
The insurance market read the situation before most of the headlines did. On 2 March 2026, marine insurers including Gard, Skuld, NorthStandard and the London P&I Club cancelled war-risk coverage effective 5 March, driving shipping costs sharply higher. Chubb launched a specialist war-risk facility on 20 March. When professional risk underwriters withdraw coverage, they are signalling how seriously the people whose job is pricing catastrophe assess the odds.
War-risk insurance withdrawal is doing as much practical work as any military action: with premiums running at approximately 30 times normal rates and maritime unions classifying Hormuz as an active war zone, a diplomatic ceasefire declaration alone cannot restore commercial shipping flows regardless of what official statements claim.
The military picture hardened alongside it. By 9 July 2026, tanker traffic was at a near standstill. US Central Command permanently disabled three Iran-linked crude tankers and redirected 92 commercial vessels, after which only 12 attempted to transit the Strait in a single day.
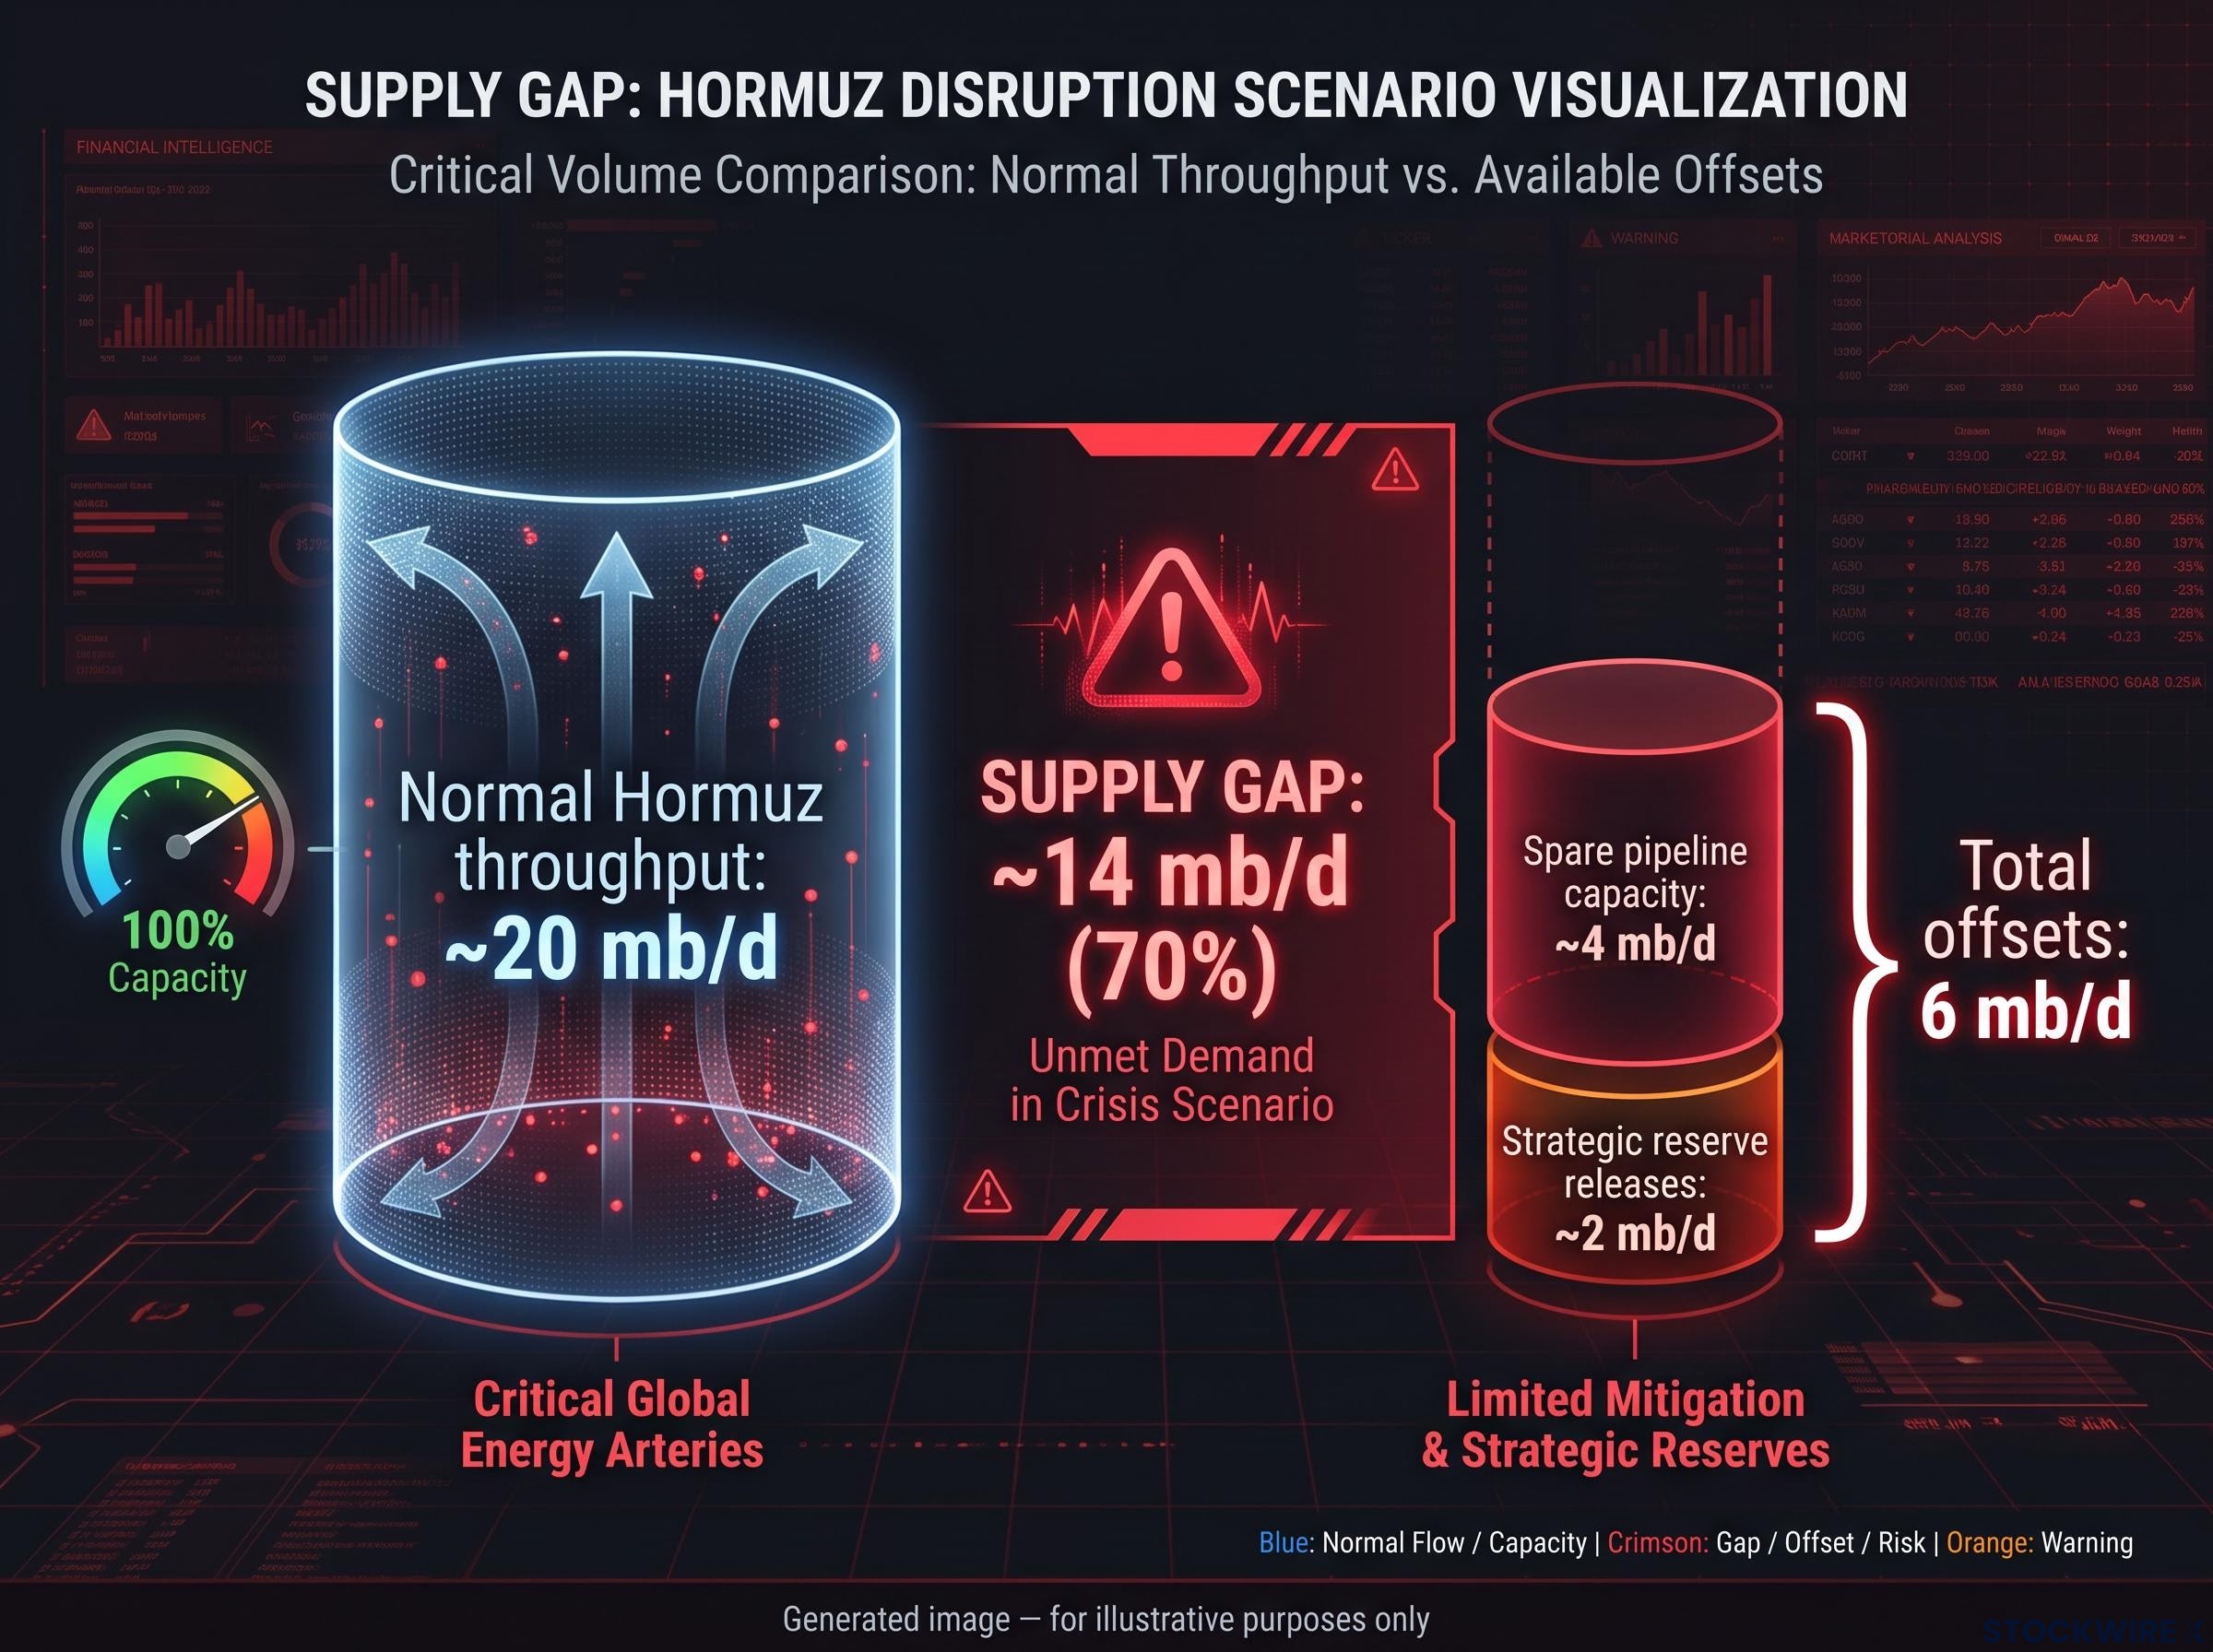
Now the structural fact that matters most. The Strait normally handles about 20 mb/d, representing 20-25% of global petroleum liquids consumption and more than a quarter of global seaborne oil trade. Against that, the available offsets are simply too small.
| Supply source | Capacity (mb/d) | Notes |
|---|---|---|
| Normal Hormuz throughput | ~20 | Roughly 15 mb/d crude, 80% bound for Asia |
| Spare pipeline capacity | ~4 | Saudi and UAE lines to Red Sea and Arabian Sea |
| Strategic reserve releases | ~2 | Sustainable for roughly one month only |
Six million barrels per day of offsets against 20 mb/d of normal flow is the single most important structural fact in this crisis. It tells you the gap cannot be bridged with existing tools, which is why the price pressure is unlikely to simply evaporate when a government announces a reserve release. When you next hear an official reassurance about alternative routes, that math is the number to test it against.
How Venezuela fits into the supply picture, and why it does not solve the problem
Faced with Middle Eastern disruption and domestic inflation pressure, Washington moved to open a new source of barrels. This was not a symbolic gesture; it was a detailed piece of policy engineering.
The US Treasury’s Office of Foreign Assets Control (OFAC) built the legal scaffolding through a sequence of general licences: GL 46 on 29 January 2026, GL 46A on 10 February, and GL 46B on 13 March, authorising established US entities to buy, transport, refine and export Venezuelan-origin crude. The Washington-Caracas deal unveiled in September 2026 then gave the US access to 17 Venezuelan oilfields holding roughly 65 billion barrels, about one-fifth of the country’s total reserves. A Chevron-Petroindependencia joint venture, with Chevron holding 49%, plans to invest over $7 billion targeting around 600,000 bpd of output.
The Treasury OFAC general licences underpinning the Venezuela deal established the precise legal perimeter for which US entities could participate in Venezuelan crude transactions, a framework that also defines the political reversibility risk embedded in those barrels.
So far this reads like a genuine buffer. The problem is what happens when you measure the promise against the physics of Venezuelan production.
The structural bottlenecks are real and slow to fix:
- Extra-heavy Orinoco crude has limited compatibility with refineries built for lighter grades.
- Midstream infrastructure has decayed after decades of underinvestment.
- Severe labour and power shortages constrain field operations.
- Export terminals face delays of up to 30 days.
- The underlying sanctions architecture remains, so any political reversal in Washington could restrict flows instantly.
The numbers close the gap for you. Venezuelan output has fallen from a 1998 peak near 3.5 mb/d to roughly 500,000-900,000 bpd in mid-to-late 2025. Under current relief, analysts estimate output could rise by around 400,000 bpd to reach 1.2-1.5 million bpd over two years.
An incremental gain of roughly 400,000 bpd over two years, against a potential 20 mb/d Hormuz disruption, is the comparison that settles the question.
The read you should take from this is precise. Venezuela is a medium-term diversification instrument, not a crisis buffer. Its ramp-up timelines are measured in years while a Hormuz closure is measured in weeks, and the political reversibility baked into the deal means these barrels are conditional. Anchoring to Venezuela as a near-term stabiliser would distort your sense of how long elevated prices could persist.
What sustained $100 oil transmits to the broader economy
Follow the price past the commodities desk and the oil story becomes a monetary policy story wearing different clothing.
Triple-digit oil functions as a consumption tax on US households. It lifts headline consumer price inflation (CPI) and squeezes discretionary spending, with the pressure passing straight through to fuel-intensive sectors. That is the transmission mechanism from a barrel of crude to a family’s monthly budget.
For the Federal Reserve, this creates a genuine dilemma. Sustained energy-driven inflation raises the probability that rates stay higher for longer, which compresses equity valuations and adds duration risk to bond holdings. The complication is that this is a supply shock, not a demand shock, so the usual monetary tools are poorly matched to the problem.
That asymmetry is the point you should not miss. Energy prices feed into headline CPI quickly, but the Fed cannot simply cut rates to offset an oil shock without risking entrenched inflation. For a US investor, that means you cannot count on a monetary policy pivot to cushion your portfolio if crude stays elevated, and rate-sensitive holdings deserve a harder look in that scenario.
The indirect transmission channel, where elevated energy costs flow through logistics, agriculture, and manufacturing supply chains, operates on a 6-12 month lag, meaning the full inflation impact of sustained triple-digit crude has not yet appeared in CPI data and the Fed’s dilemma will intensify even if crude prices plateau.
Which sectors feel the oil shock first
The pass-through is not evenly distributed. Some sectors absorb the cost directly, others capture the margin.
- Exposed sectors: Airlines, trucking, and chemicals, where fuel is a primary input cost, plus consumer discretionary names squeezed by tighter household budgets.
- Beneficiary sectors: Integrated energy majors and broad commodity producers, which see margin expansion, alongside defence and industrial names that benefit indirectly from elevated geopolitical spending.
The IEA’s projection of a return to surplus later in 2026 if disruptions ease is the reminder underneath all of this: the sector split above is real while the premium holds, but it is not a permanent feature of the map.
How to position a portfolio in a $100-plus oil environment
The instinct in a crisis like this is to rotate hard into energy. That instinct is the danger. The disciplined move is proportionate, sized so that neither a Hormuz closure nor a sudden de-escalation can inflict outsized damage.
Strategists generally frame a tactical energy sleeve at 5-10% of a portfolio, favouring integrated majors, energy ETFs such as XLE, and companies able to pass fuel costs through to customers. The names to avoid are highly leveraged exploration and production plays, which carry severe downside if oil retreats.
The empirical case for energy equities as an inflation hedge rests on a structural alignment: the same crude price action that damages bonds and cash flows directly into energy sector earnings, with NBER research associating an energy inflation shock with a 4.0 percent increase in energy sector returns.
Around that core, a diversified inflation hedge does more work than a wholesale energy pivot. Gold, broad commodities, Treasury Inflation-Protected Securities (TIPS), and short-duration sovereign debt each address a different facet of the same risk. For large existing exposures, options, collars and futures can hedge the position rather than double down on a directional bet.
| Strategy | Instrument / asset class | Rationale | Risk to watch |
|---|---|---|---|
| Tactical energy sleeve | Integrated majors, XLE (5-10%) | Margin exposure to elevated crude | Premium collapse on de-escalation |
| Inflation hedge | Gold, broad commodities, TIPS | Protection against energy-led CPI | Over-concentration in one hedge |
| Rate-risk defence | Short-duration sovereign debt | Limits duration risk if rates stay high | Lower yield versus long duration |
| Position hedging | Options, collars, futures | Protects large existing exposures | Cost of carry and complexity |
Wealth managers warn that the geopolitical risk premium is highly event-driven and can unwind rapidly on de-escalation.
Understand what that 5-10% figure is and is not. It is not a bullish call on oil staying above $100. It is a proportionate hedge against a constrained Strait, deliberately sized so that a diplomatic breakthrough collapsing the premium does not wreck the portfolio. With the IEA projecting a return to surplus later in 2026 and hydrocarbons facing structural long-term headwinds from climate policy, an overcommitted energy position held past the crisis carries its own real downside.
This article is for informational purposes only and should not be considered financial advice. Investors should conduct their own research and consult with financial professionals before making investment decisions. Past performance does not guarantee future results. Financial projections are subject to market conditions and various risk factors.
Reading the signals that will move oil next
The value now is not in restating what has happened but in knowing which headlines will actually move the price from here. Three variables carry the weight.
- Hormuz military and diplomatic activity. The trajectory of strikes, seizures, and ceasefire talk sets the base case for the entire risk premium. Any credible de-escalation signal is the single fastest way to reprice crude.
- Venezuelan production against political durability. Watch whether output climbs toward the 1.2-1.5 million bpd two-year range, and whether the Washington-Caracas deal survives the political weather in both capitals. A longer-term rise to 2 million bpd by 2030 could shave roughly $4 per barrel off global prices, but only if the deal holds.
- Federal Reserve rate-path communication. How the Fed frames energy-driven inflation will shape whether higher-for-longer becomes the working assumption, with direct consequences for rate-sensitive holdings.
Keep the downside as firmly in view as the upside. The IEA’s projected return to surplus later in 2026 and the documented tendency of premiums above $15 per barrel to fall to a couple of dollars within 24 hours mean a single diplomatic breakthrough could send crude sharply lower, punishing energy-heavy positions that leaned in too far.
That is the analytical tension to carry forward. The severity of the supply disruption and the fragility of the price level are both true at the same time. The job is not to resolve that contradiction prematurely but to position for both, because the headline that reprices everything could arrive on any given morning.