
Seagate and Western Digital each fell just over 10% on 2 October 2026. Days later, Brazil’s main US-listed ETF jumped 12.54% in a single session. All three looked stretched, and a stretched chart is where many traders reach for the short button. Those moves, however, called for very different short-side thinking.
Shorting after a big move is where traders tend to lose money fastest. Momentum often carries further than looks reasonable, and a single headline can reverse a gap within hours.
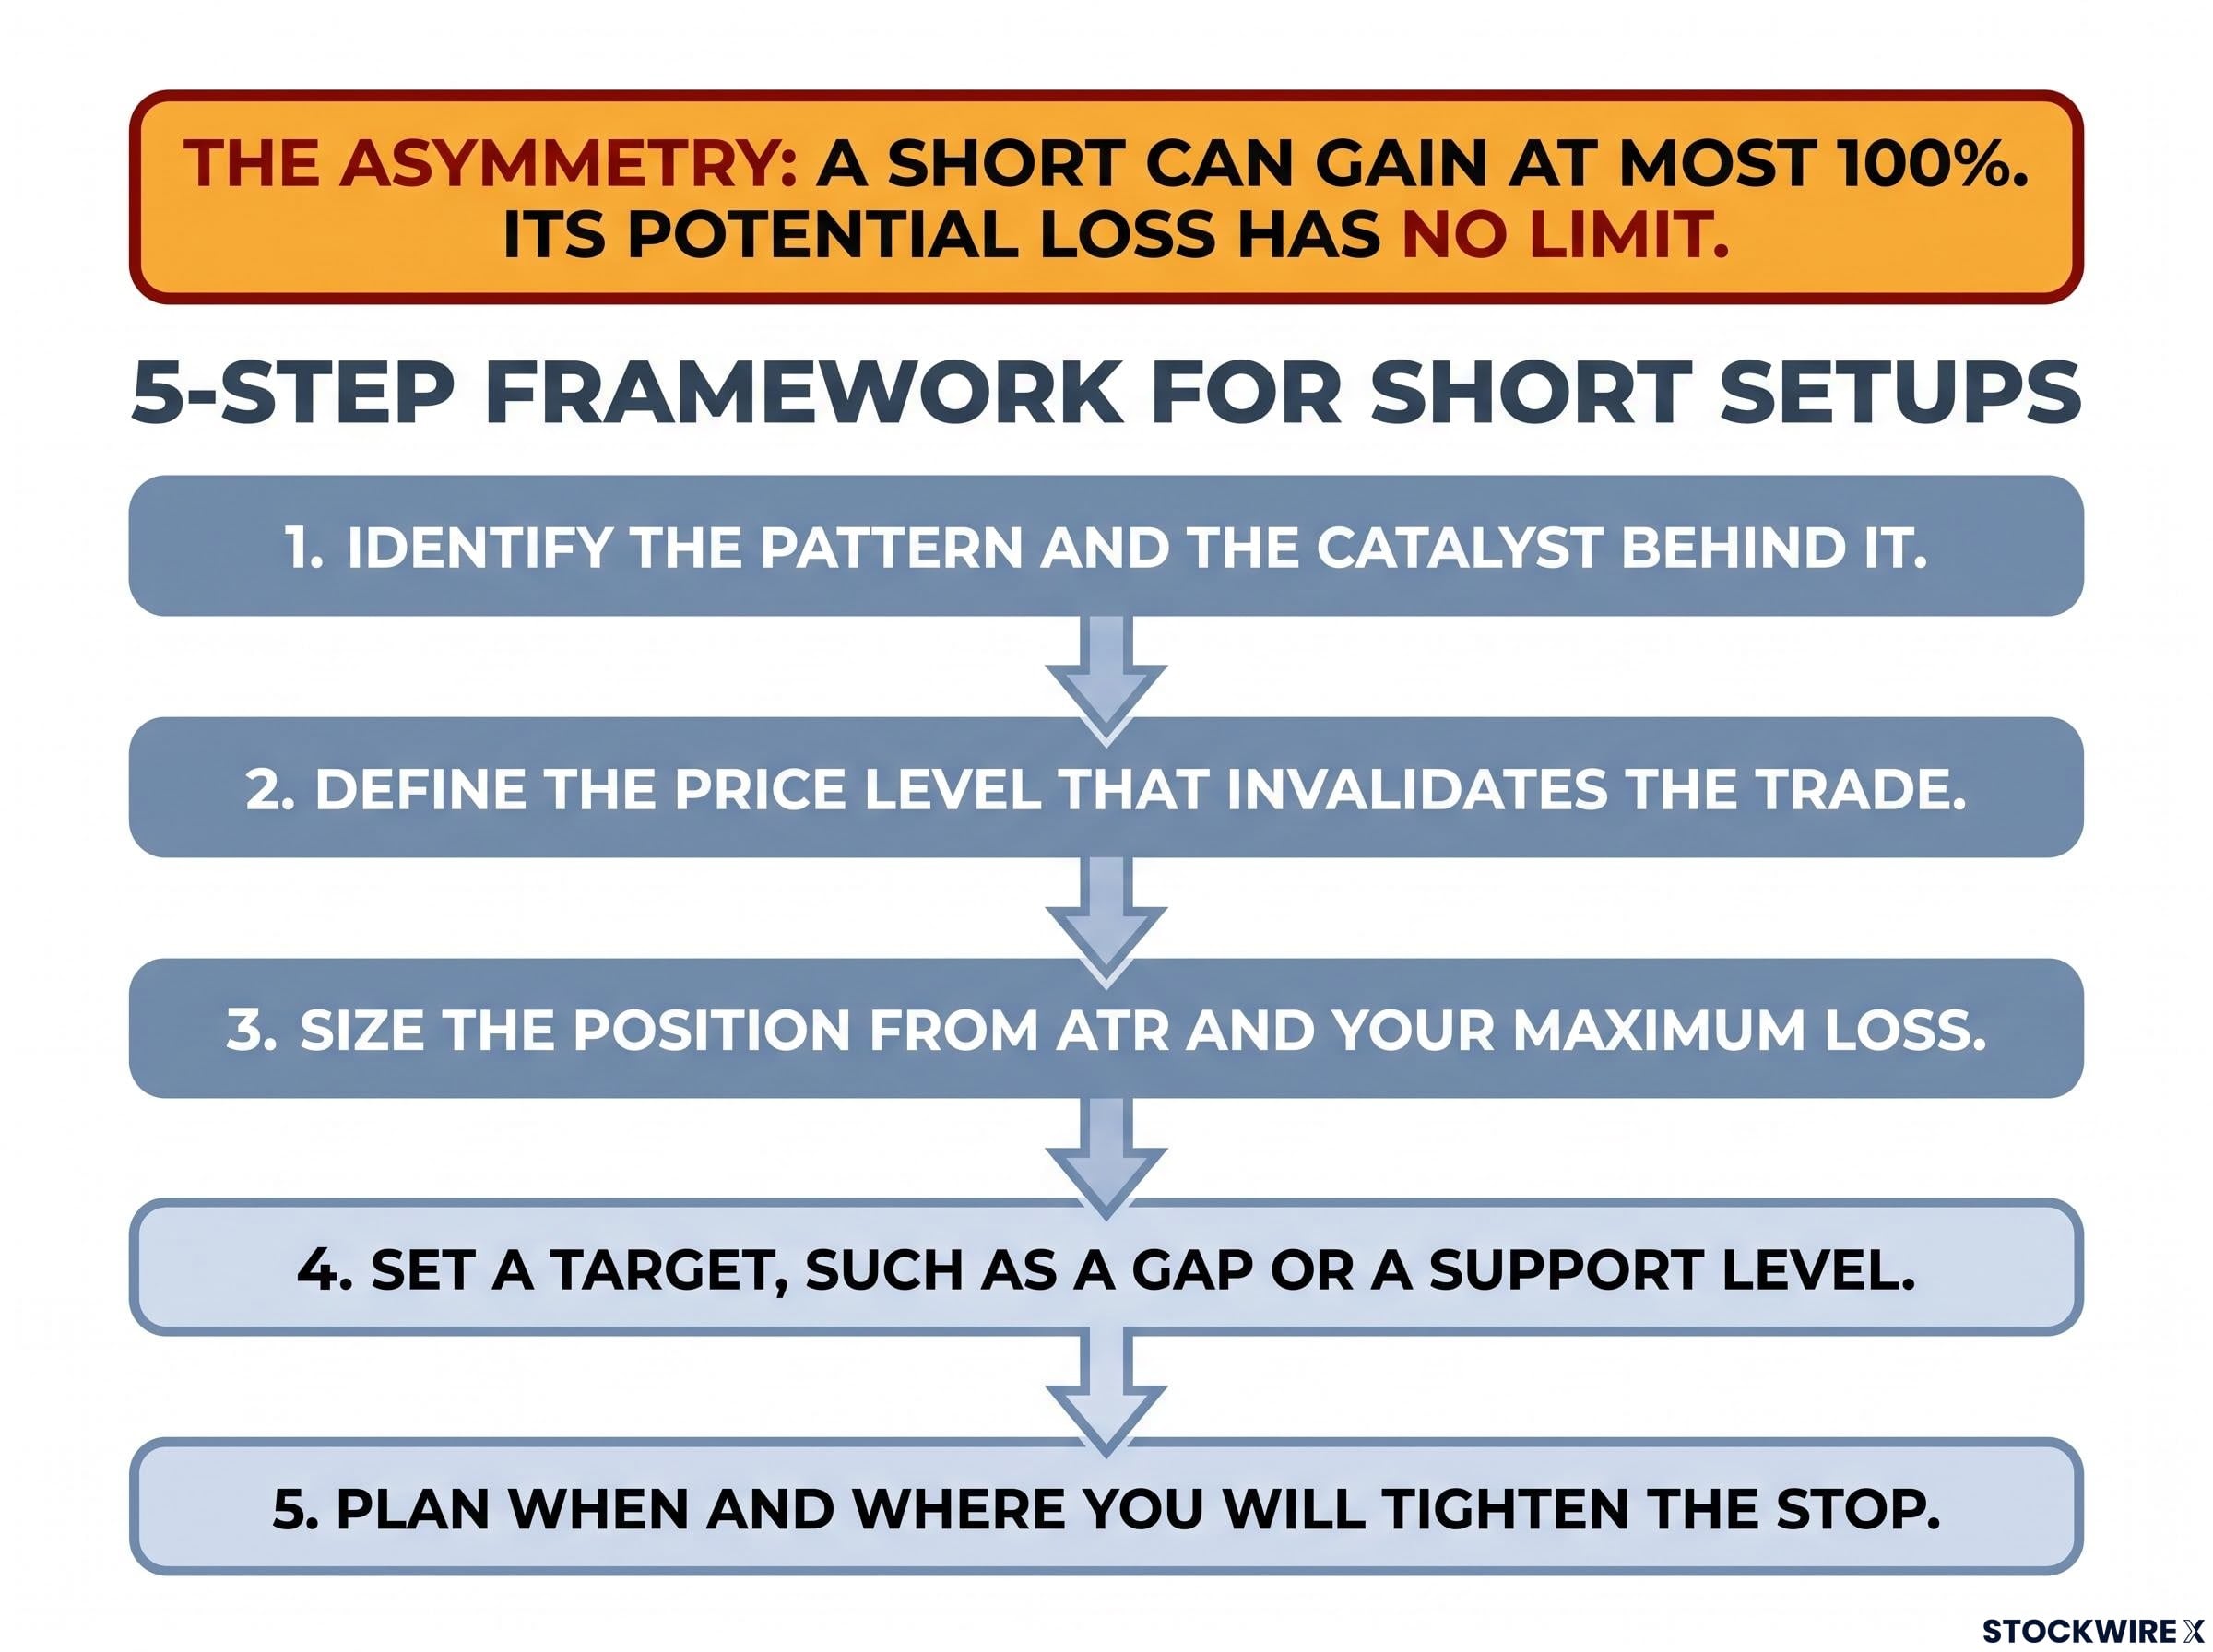
US traders face an extra trap. A short position can gain at most 100%, but its potential loss has no ceiling. Triple-leveraged ETFs also make it easy to take on far more exposure than a position’s size suggests.
This guide gives you a working framework for reading short setups, placing the stop, and recognising when to stay away entirely.
What do island reversals, triangles and shooting stars actually tell a short seller?
All three patterns are attempts to spot the moment buyers run out of energy. None of them proves it. Each one is evidence you weigh alongside volume, trend and news.
Completion rates for bearish patterns improve markedly when volume and trend filters are applied, which is why the same island or triangle can be a strong setup in one chart and a poor one in another.
Island reversal tops
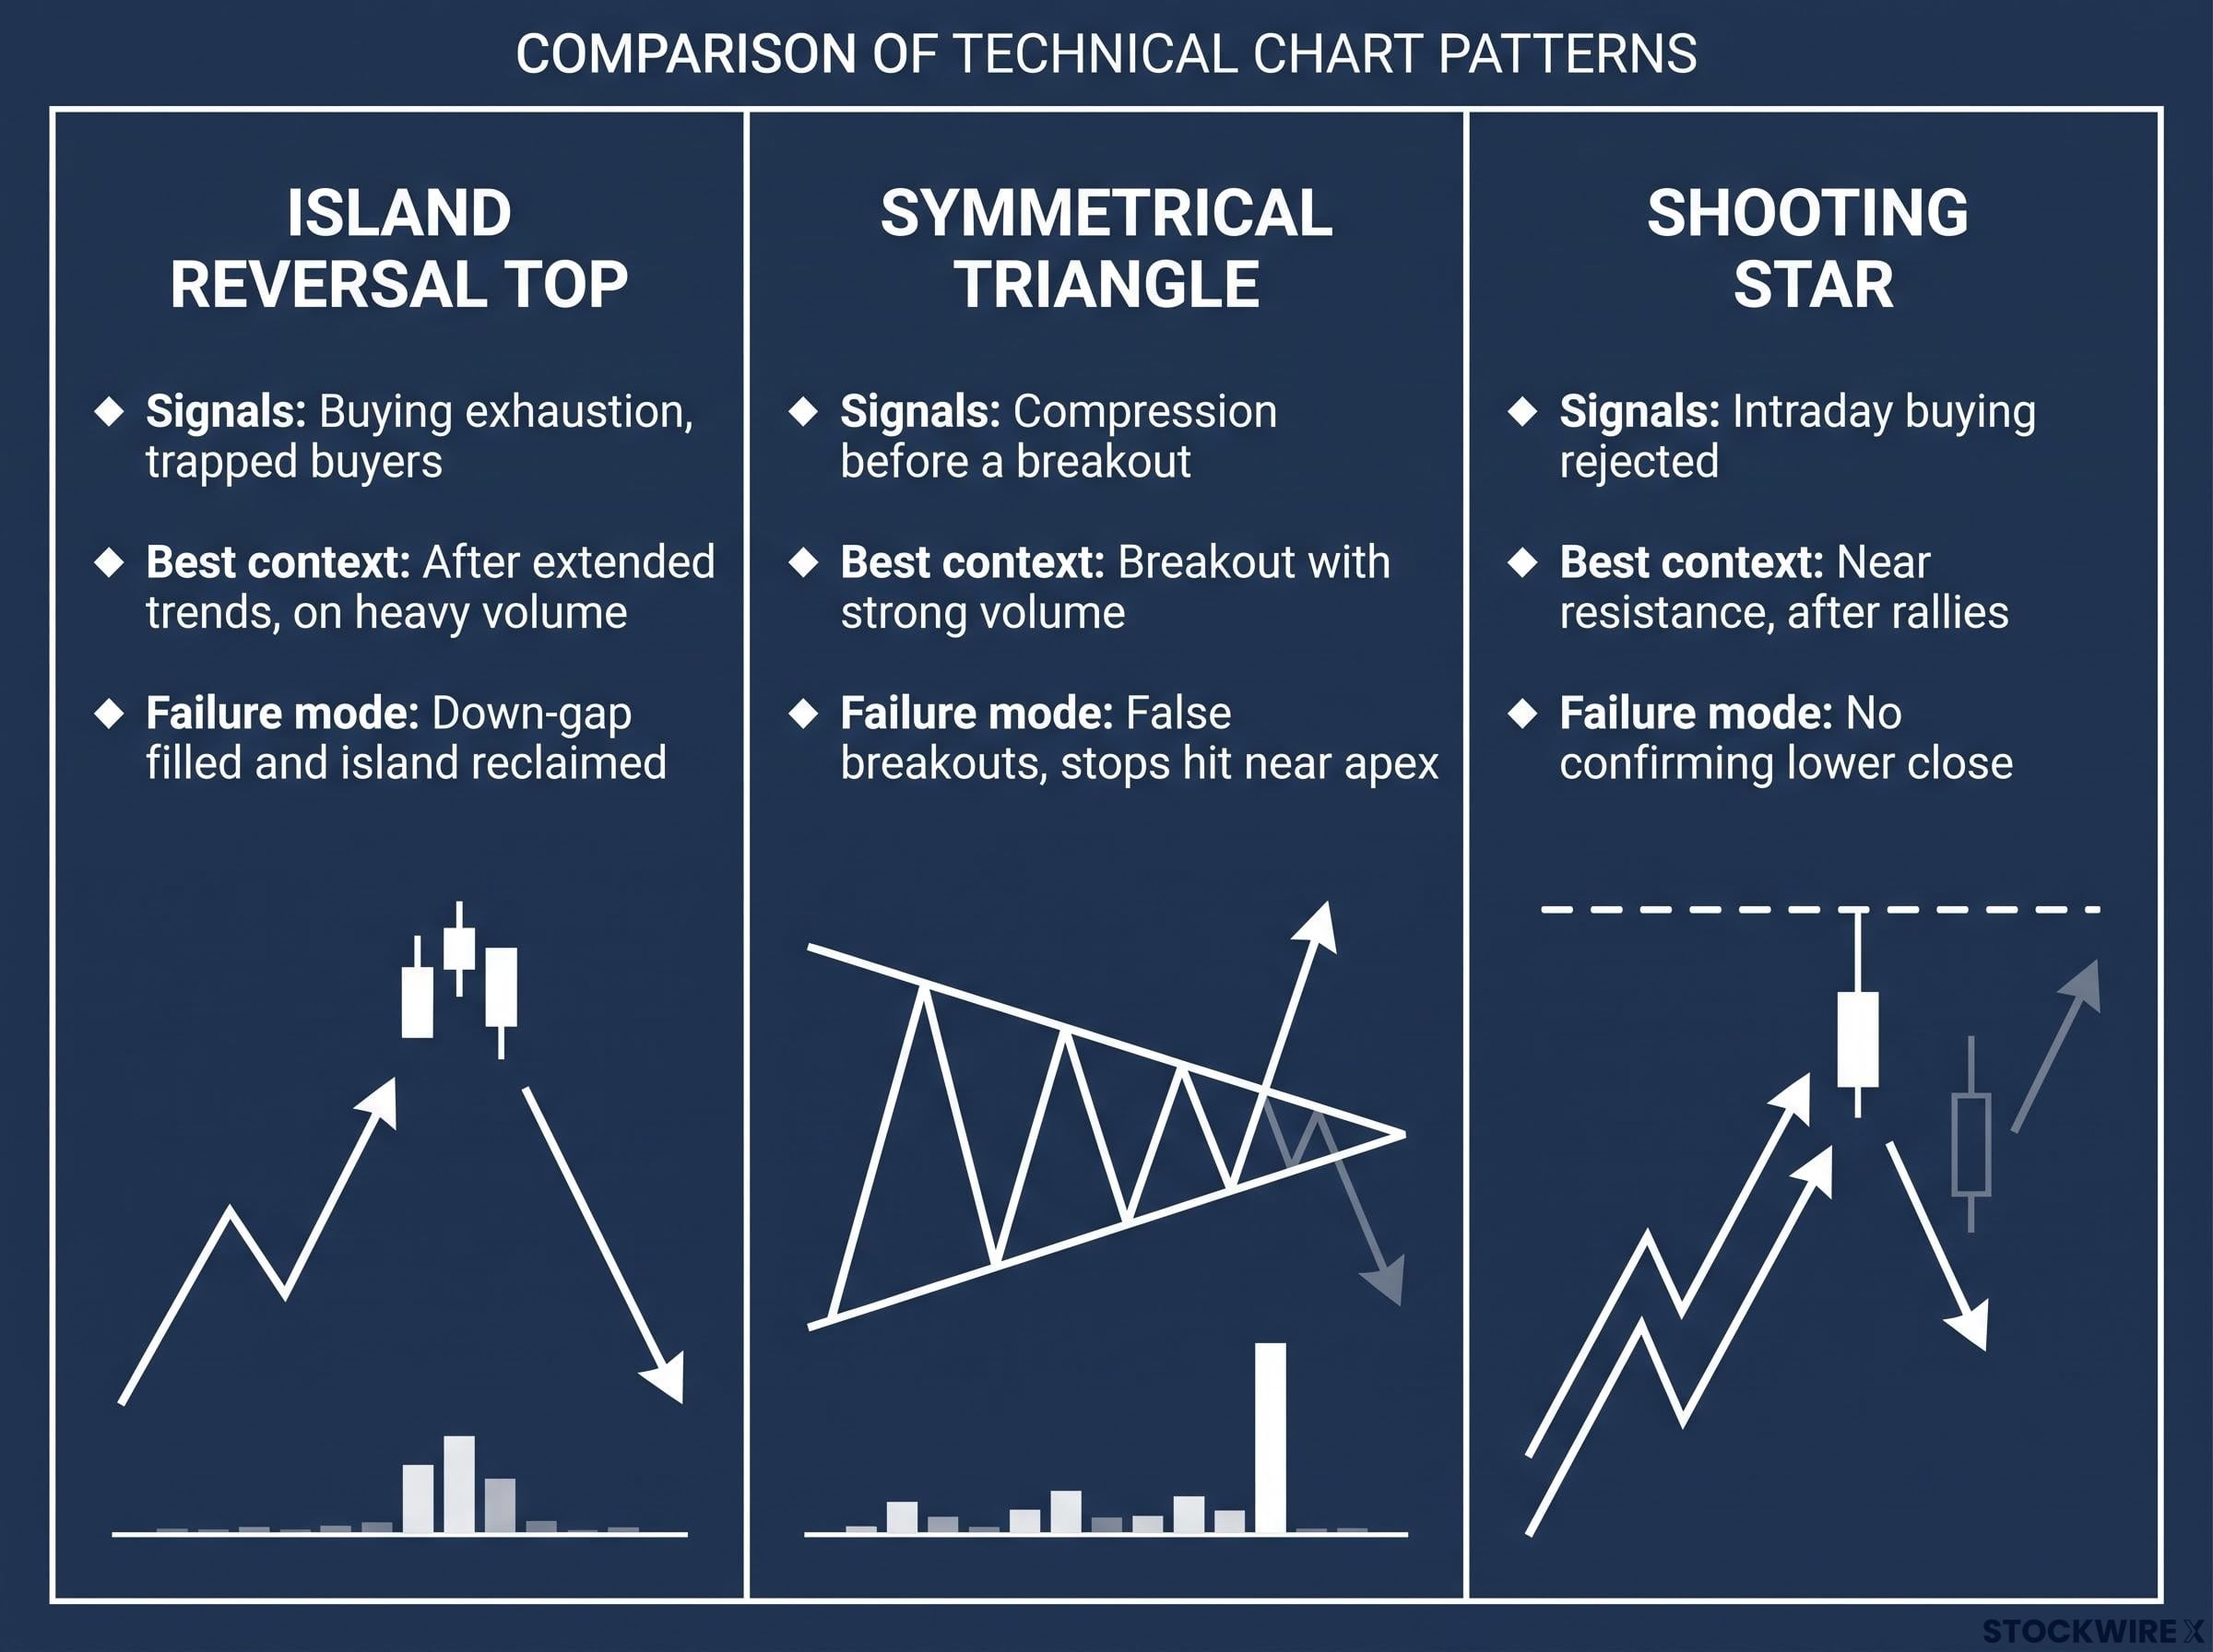
An island reversal forms when price gaps up, trades in a tight cluster of bars, then gaps down. The cluster is left stranded, like an island cut off on both sides. Everyone who bought inside that cluster is now holding a loss, and those trapped buyers can become sellers.
According to the CMT Association and other technical-analysis authors, the pattern carries more weight after an extended trend, on above-average volume and near resistance. It fails if the market quickly fills the down-gap and climbs back into the island. That is where shorts get squeezed. Because gaps are often driven by news, better headlines can cancel the signal.
Symmetrical triangles
A symmetrical triangle forms from lower highs and higher lows. Two trendlines converge toward a point called the apex. Fidelity and Schwab both describe the pattern as neutral: it tends to break in the direction of the existing trend, but it can break either way.
False breakouts are common, and price often comes back to retest the broken line. Near the apex you face a real dilemma. A tight stop gets hit by ordinary noise, while a wide stop weakens the trade’s reward compared with its risk.
Shooting star candles
A shooting star has a small body near the session low, a long upper shadow and little or no lower shadow. The shadow records buyers pushing price higher during the day and then losing control by the close.
Unconfirmed shooting stars often fail. The usual confirmation is a lower close the following day.
| Pattern | What it signals | Best context | Main failure mode |
|---|---|---|---|
| Island reversal top | Buying exhaustion, trapped buyers | After extended trends, on heavy volume | Down-gap filled and island reclaimed |
| Symmetrical triangle | Compression before a breakout | Breakout with strong volume | False breakouts, stops hit near apex |
| Shooting star | Intraday buying rejected | Near resistance, after rallies | No confirming lower close |
A pattern only improves the odds of a decline. Your real skill lies in deciding, before you enter, what price action would prove the pattern wrong.
When big ASX news breaks, our subscribers know first
How did traders apply these setups to STX, WDC, Brazil and KORU?
These patterns are easier to judge on real charts. The trades below come from one trader’s live commentary in early October.
STX and WDC: shorting a news-driven gap
The sell-off began with a Nikkei Asia report. It said Toshiba plans to invest about ¥60 billion (about $380 million) to roughly double its hard-drive capacity by fiscal 2027. Investors worried that the extra supply would erode the pricing power storage makers had enjoyed.
| Stock | Prior close | 2 Oct close | Change | Intraday low |
|---|---|---|---|---|
| Seagate (STX) | 945.57 | 848.99 | -10.21% | ≈791.75 |
| Western Digital (WDC) | 462.56 | 415.29 | -10.22% | ≈396.57 |
Both stocks traded at more than double their average volume. Sources disagree on the size of the drop. Official closes show about -10.2%, while intraday reports ranged from roughly -7% to more than -14%, and the trader was speaking when STX was down about 7.8% and WDC about 7%.
The trader had shorted STX the previous day. He read the chart as an island reversal top, with a possible triangle break if price fell below Friday’s lows. WDC showed its own symmetrical triangle, with support near 400.
Room to fall WDC traded at about double that level in the summer, which, in the trader’s view, shows that a stock already down 50% can still be a good short.
The weakness in this trade is its catalyst. Some analysts described the reaction as possibly excessive. If the market reassesses the Toshiba news, a news-driven gap can close quickly.
Brazil: fading an event rally
The iShares MSCI Brazil ETF (EWZ) jumped 12.54% to 42.98 after Brazil’s first-round presidential vote produced no outright winner (Pomegra put the gain at about 12%). The trader compared the move to the Dow gaining 7,000 points. His transcript named the ticker as EWC, but EWC is the Canada ETF.
He shorted after a shooting star formed, and he treated the open price gap as his most ambitious target. The overhang is the runoff, roughly three weeks away. The rally priced in a likely result, not a final one, and investors still disagree on whether it will fade or mark a lasting re-rating.
Traders fading a sharp surge often look for confluence, where unfilled gaps and prior pivot highs sit near the same price, because that overlap can mark where late buyers turn into sellers.
KORU: a leveraged short
KORU, a 3x South Korea ETF, was the trader’s third short, opened a couple of days earlier. It fell about 4.5% on the day even as semiconductors rose. He tightened his stop and expected the ETF to drop faster if chip stocks sold off. Specific KORU performance data was not available.
In each case, a chart signal came paired with a concrete reason for sellers to appear. The risk changes sharply depending on whether that reason is news, a scheduled event or leverage.
Where do you place the stop and how do you size a short?
Most new short sellers pick a round number, such as 5% above entry. That number has nothing to do with the chart.
Professional frameworks place the stop where the thesis fails: above the island, or above key resistance. If price gets there, the pattern is broken and you have no reason to stay in. Targets follow the same logic. The Brazil gap is an ambitious objective, while WDC’s support near 400 is a natural first stop for profits.
Size comes next. Base it on the stock’s volatility, measured by average true range (ATR), which is the average distance a stock moves in a typical day. Liquidity matters too, as does the maximum dollar amount you are willing to lose on a single trade. With triangles, accept the trade-off openly: a wider stop means a smaller position.
- Identify the pattern and the catalyst behind it.
- Define the price level that invalidates the trade.
- Size the position from ATR and your maximum loss.
- Set a target, such as a gap or a support level.
- Plan when and where you will tighten the stop.
Tightening as the trade works
The KORU trade shows the final step in action. As the position moved in his favour, the trader tightened his stop to lock in part of the gain. Because a short can gain no more than 100% but can lose without limit, protecting open profit matters more on the short side.
Your stop and your size, not the pattern, decide whether a wrong call costs you a little or a lot. The rule to take into your next trade: work out where you would be wrong before you work out how much to buy or sell.
What can go wrong when you short strength?
The case against a stock that has run hard feels obvious. STX was still up roughly 200% year to date even after its fall. Surely it had gone too far?
Feeling right about direction is not the same as getting paid.
Borrow fees and timing errors are the usual reasons a correct directional call still loses money, and both grow more costly when volatility spikes after a sharp move.
- Short squeeze: When crowded shorts rush to cover, their buying pushes price higher still. Volkswagen in 2008 and GameStop in 2021 are the cautionary cases.
- Unlimited loss: A stock can keep rising indefinitely, so there is no natural floor to your loss.
- Borrow costs: To short, you borrow the shares. Borrow fees and hard-to-borrow status tend to rise as volatility rises.
- Buy-in risk: Your broker can force you to close the position if the shares you borrowed are recalled.
- Trends that ignore overbought readings: Index shorts after policy surprises often run into sustained trends.
The asymmetry A short can gain at most 100%. Its potential loss has no limit.
The Brazil trade sits squarely inside this debate. One view holds that event rallies fade as debt, growth and governance problems return. The other holds that when an outcome changes the expected policy path, the re-rating can last. Historical precedents point both ways, and the pending runoff keeps the question open.
A short that is squeezed out before the decline arrives earns you nothing. Timing and sizing matter more than conviction, and sometimes the right choice is to skip the trade.
Why are triple-leveraged ETFs like KORU a different kind of short?
The promise sounds simple. A 3x fund aims to deliver three times the daily move of its benchmark. Direxion’s materials state that 2x and 3x funds target 200% or 300% of daily performance and are not designed to track the benchmark over periods longer than one day.
That one-day limit changes everything. The fund resets every day, so returns compound along whatever path the index takes. According to Direxion, moves against the fund raise its effective leverage, while moves in its favour reduce it. In choppy markets, this process can erode value even if the index finishes flat. That loss is called volatility decay.
- Daily reset: The leverage applies to each day’s move, not to your whole holding period.
- Compounding: Gains and losses build on each other, so multi-day results drift from 3x.
- Volatility decay: Choppy trading erodes value over time.
- Borrow costs: Shorting the fund adds its own borrowing fees and availability risk.
Direxion describes these products as riskier than non-leveraged alternatives and meant for sophisticated investors who manage positions actively. The Securities and Exchange Commission (SEC) and FINRA have warned that 3x products can behave unpredictably over several days and may not suit buy-and-hold investors. KORU’s 1x counterpart, EWY, is a calmer alternative, though the trader found it harder to chart.
Competing views among active traders
Some active traders use 3x funds for short-term trades that are modestly sized, monitored closely and closed quickly. Others argue the funds are unsuitable even for many traders, especially when combined with options or margin, which stacks leverage on leverage.
When you short a leveraged ETF, you are betting on the path the index takes, not just its direction. A flat index can still deliver a surprising result.
Investors exploring how a flat index can still hurt a 3x fund will find our full explainer on leveraged ETF volatility drag, which shows how path dependence changes outcomes.
Turning short-side setups into a repeatable process
Before any short, run five questions. Is there a clear pattern? Is there a catalyst giving sellers a reason to act? Have you defined the price that proves you wrong? Is the position sized to that level? Does the product suit your holding period?
The October cases each add a lesson. STX and WDC show that news-driven gaps can reverse if the news is reassessed. Brazil shows that event rallies carry an unresolved catalyst. KORU shows that leverage turns direction into a question of path.
These trades are illustrations, not signals, and market conditions have already moved on. Short selling and leveraged products are not suitable for every investor.
This article is for informational purposes only and should not be considered financial advice. Investors should conduct their own research and consult with financial professionals before making investment decisions. Past performance does not guarantee future results.