When the International Monetary Fund (IMF) and Moody’s measure how much private credit US life insurers hold, they arrive at roughly one-third of investments. When the International Center for Law & Economics (ICLE) uses a narrower definition built on regulator data, it finds about 6% of general-account assets. Before you judge whether private credit poses a systemic risk to the financial system, you have to accept an uncomfortable fact: the headline number depends on who is counting.
The question carries weight right now. The National Association of Insurance Commissioners (NAIC) is tightening rules on roughly $1.2 trillion in insurer private credit. Treasury has met with the NAIC, and Senator Elizabeth Warren wrote to regulators last month.
Investor Nick Nemeth, publisher of Mispriced Assets, argues that stress amplified by insurers owned by asset managers could become systemic. Treat his case as one investor’s thesis under examination, not settled fact.
You will come away with a way to test the claim yourself: where the exposure sits, where valuations are hard to verify, and what would have to break for stress to spread.
How did insurers end up holding so much private credit?
The build-up follows a chain of incentives, and each link makes sense on its own. After the Dodd-Frank reforms restricted bank lending, demand for high-yield credit moved to non-banks. Asset managers stepped in. Apollo co-founded Athene around 2009-2010, and KKR, Blackstone, Carlyle and Sixth Street followed by buying or building insurers.
Demutualisation had already pushed insurers towards profit-seeking. Demutualisation is the process by which a policyholder-owned insurer converts into a shareholder-owned company.
Then comes the spread problem. Nemeth says an insurer selling annuities with a high cost of capital (he cites about 8% for a BBB-rated insurer) and 10-15% sales commissions needs yield. In his framing, only private credit and mezzanine tranches of collateralised loan obligations (CLOs) deliver enough yield, roughly 9-11%, with low capital charges. A CLO is a pool of corporate loans sliced into layers, or tranches, that take losses in a set order.
The mainstream counterpoint is simple. Moody’s notes that insurers’ stable, long-dated liabilities genuinely suit illiquid assets that cannot be sold quickly.
Why the numbers differ
Broad definitions from the IMF and Moody’s capture most privately originated or illiquid debt. ICLE counts only direct loans plus non-mortgage structured finance carrying private ratings. NAIC-linked reporting sits in between.
| Source | Definition | Figure | Year | Share of assets |
|---|---|---|---|---|
| Moody’s | Broad, rated US life insurers | About one-third of ~$6T | End-2024 | ~33% |
| NAIC-linked reporting | All US insurers | $1.2T | End-2025 | 13% of cash and invested assets; 21% of bonds |
| ICLE | Narrow, privately rated direct loans and structured finance | $483.5B | 2025 | ~6% of general-account assets |
| Nick Nemeth | Rough estimate | About $1T | 2026 | Against ~$10T of balance sheets |
Within the NAIC figure, $544 billion is flagged as complex. Privately placed securities made up 48.4% of life-industry bonds at end-2025, up from 37.4% five years earlier, and affiliated investments reached $321 billion. ICLE also found more than half of insurer groups hold none, with typical exposed allocations of 3%-4%.
The lesson for you: the figure you accept determines the risk you perceive. Check the definition before trusting any headline percentage.
When big ASX news breaks, our subscribers know first
Why are private credit marks so hard to verify?
Start with two terms. A Level 3 valuation is a price set using a model and internal assumptions rather than an observable market quote. A private-letter rating is a credit rating issued privately to the insurer, not published to the market.
Moody’s found about one-third of rated life insurers’ private credit carries these ratings from NAIC-recognised providers. Those ratings feed directly into capital charges and filing exemptions, yet the rationale reports behind them are not widely shared. Outsiders therefore struggle to challenge optimistic marks until stress arrives.
Opacity builds in three layers:
- Model-based marks: Level 3 prices reflect assumptions, not trades.
- Private ratings: they set capital charges but stay largely out of public view.
- Discount-rate flexibility: Nemeth argues insurers can pick liability discount rates based on expected asset yields, which can hide problems.
The IMF puts the danger plainly.
IMF warning Misclassifying below-investment-grade instruments into investment-grade buckets can produce default losses that erode capital and open liquidity gaps.
Moody’s data shows nearly 10% of private credit and illiquid assets sit below investment grade, with about 38% in complex asset-backed debt. Nemeth goes further, arguing Cliffwater’s private credit index looks too smooth and that CLO equity forms about a third of its portfolio. He also says its outflows rose 300 basis points after passing 500 basis points in a quarter. These claims are his and are disputed. Regulators have responded through Actuarial Guideline 53 (AG 53), which demands tougher modelling of structured and Level 3 assets.
What leverage does to a small markdown
Nemeth estimates insurer leverage at around 22-23x excluding mutual funds, with some above 30x. As an illustration only: at 22x, assets are about 22 times capital.
If you hold an annuity or life policy, your insurer’s stated safety rests partly on marks and ratings you cannot see. That, not raw size, is the heart of the transparency argument.
Do CLO ratings really echo the 2008 CDO experience?
Nemeth’s analogy is sharp. He argues CLOs use correlation maths similar to the collateralised debt obligations (CDOs) of 2008, that rating agencies lack downturn data for private credit, and he predicts a AAA-rated CLO tranche will default within 12 months of his interview.
The record so far points the other way. S&P reports a US broadly syndicated loan CLO tranche default rate of 0.07% in 2025, and lifetime data show no AAA CLO tranche that defaulted from its initial rating.
Stress shows at the edges. Middle-market CLO default exposure reached about 0.57% in one index, with negative rating migration, and one European junior tranche defaulted, reportedly the first since post-2008 reforms. Fitch’s private credit default rate stood at 5.2% in the twelve months to October 2025. Business development companies (BDCs), listed or private funds that lend to mid-sized firms, reported non-accruals of 1.9% of debt at cost in Q1 2026, or 3.3% adjusted. Non-accruals are loans where interest has stopped being booked.
Stress at the edges is also visible in market pricing, where BDC discounts to NAV of 17-26% offer a live check on the quarterly marks that managers publish.
Nemeth says defaults exceed 2008 levels. That conflicts with Fitch’s 5%-6% range and depends on the measure and cohort used.
| Factor | 2008 CDOs | Today’s CLOs and private credit |
|---|---|---|
| Where the parallel holds: rating dependence | AAA tranches proved miscalibrated | Capital charges lean on ratings, some private |
| Where the parallel holds: opacity | Modelled marks hid losses | Level 3 marks are hard to verify |
| Where the data differ: senior tranches | Widespread AAA losses | No initial AAA CLO defaults; 0.07% tranche default rate in 2025 |
| Where the data differ: collateral | Thin-data subprime mortgages | Corporate loans with long performance histories |
Treat the prediction as a testable claim with a clock on it. Current data show stress at the edges, not in senior tranches.
How could stress travel from private credit through insurers to the wider system?
A credit loss only becomes systemic if it travels. The chain runs like this:
- Markdowns or defaults erode insurer capital.
- Liquidity gaps open through unfunded commitments, funding agreements, reliance on Federal Home Loan Bank (FHLB) support, and policyholder surrenders.
- Insurers sell assets into a market with fewer buyers.
- Reinsurance links pass losses to other insurers.
- Credit tightens and stress reaches banks through shared exposures and funding markets.
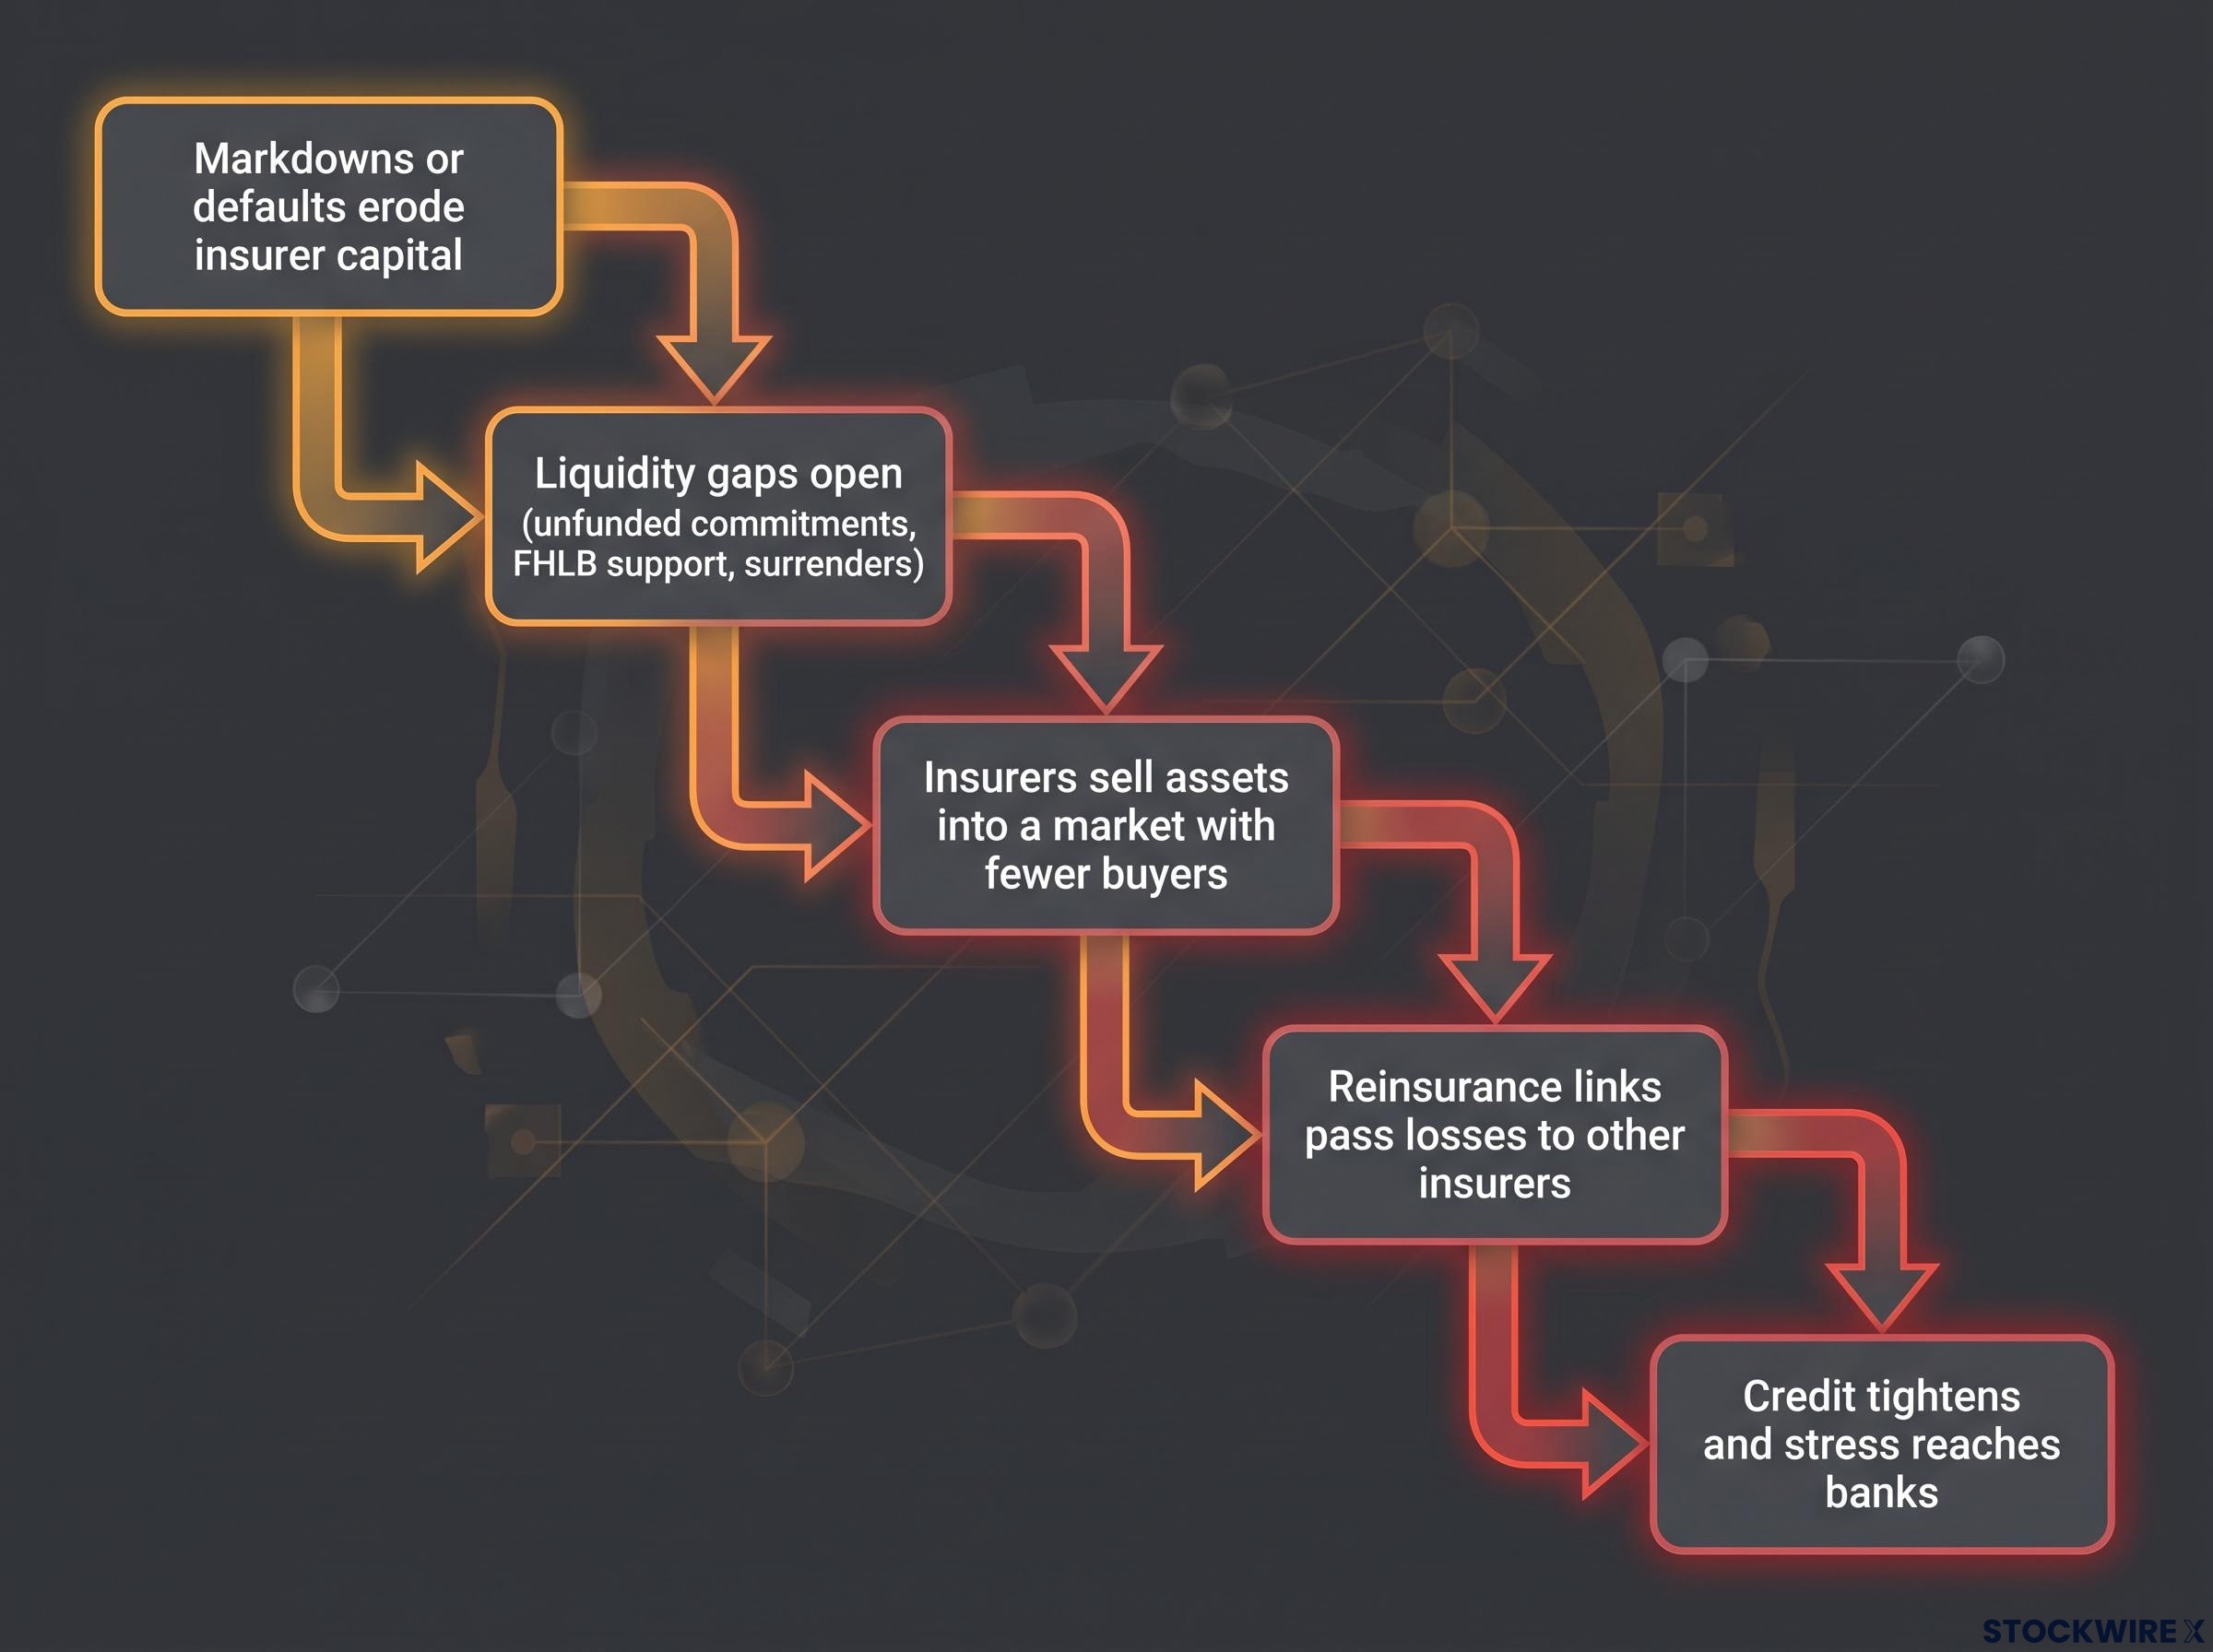
Each link is plausible alone. Systemic damage requires several to hold at once.
The liquidity mismatch between periodic redemption terms and illiquid underlying loans is the same structural tension that makes unfunded commitments and policyholder surrenders so dangerous for insurers, and regulators have flagged it across several agencies.
The IMF’s April and October 2025 Global Financial Stability Reports describe the mechanism through cross-holdings and funding links, without calling it an imminent systemic threat.
IMF on non-banks Rapid growth in non-bank financial intermediaries, including insurers and private credit providers, is amplifying vulnerabilities, with stress able to reach core banks through shared exposures.
Nemeth’s scenario has reinsurers such as RGA, Hannover Re and Swiss Re linking hundreds of US insurers, followed by tighter credit and possibly a slow-burn, Japan-style decade. He sees roughly 25% of subscale insurers as having no way out, cites Athene, Corebridge and MetLife among scale players, and does not view bank solvency as the main issue. Law firm Quinn Emanuel adds litigation risk from valuation disputes and restructurings.
Where Nemeth’s scenario goes beyond the official view
The IMF and NAIC talk about valuation, liquidity and transparency. Nemeth adds bailout scale: he notes each rescue has grown, with the Troubled Asset Relief Program (TARP) authorised at about $700 billion but drawing about $440 billion, and doubts the next could be funded without hurting the dollar. Those claims sit outside official analysis.
For you, the key question is not whether one fund fails but whether losses reach insurers’ liquidity. That step turns a credit problem into a system problem.
Is the risk contained, and what would the proposed fixes change?
The case for containment
The strongest argument against alarm is structural. Long-dated liabilities let insurers hold loans to maturity rather than sell in a panic, capital and stress-testing rules apply, and the underlying loans have longer performance histories than 2008’s mortgages.
ICLE’s June 2026 research found insurers with larger private-debt allocations show stronger financial profiles on average, and increases within firms were not linked to higher estimated insolvency risk. It backs a “calibrated regulatory approach”.
| Reform | What it targets | Timing | Open question |
|---|---|---|---|
| Principles-based bond definition | Equity-like assets getting bond treatment | Effective 1 January 2025 | How strictly it is applied |
| AG 53 strengthening | Structured assets, Level 3 marks | Under way | Whether models capture stress |
| Liquidity stress tests | Large life groups in severe scenarios | Under way | Coverage of affiliates |
| Enhanced disclosure | Private placements, complex assets | From year-end 2026 | Whether it arrives before stress |
| Risk-based capital changes | Residuals, lower-rated CLO tranches, private ratings | Proposed | Outcome on the $544B subset |
What could still go wrong
Concentration is the weak point. Moody’s counted $807 billion of private credit and illiquid assets in 2025, 20% of about $4 trillion in fixed income, held mostly by around 10 large insurers. Warren’s September 2026 letter cited about $20 billion of affiliated assets restated by certain insurers; the NAIC replied defending the state framework. Treasury has met the NAIC, but no new federal or SEC private credit rules have been identified. Nemeth wants mark-to-market valuation for products sold to the public and bank deregulation so banks can absorb assets.
The thesis has its own weak spots:
- Conflicting definitions inflate or shrink the exposure.
- His default claims clash with Fitch data.
- His AAA CLO prediction remains unfulfilled.
The verdict hinges on concentration in a few large insurers and whether disclosure arrives before stress does, not on the headline total.
What would change the verdict, and what to watch next
The answer depends on three things you now understand: which definition you use, how concentrated the exposure is, and whether disclosure beats stress to the finish. Three milestones will sharpen the picture:
- Year-end 2026 disclosures, the first granular look at private placements and complex holdings.
- Tranche-level CLO defaults and BDC non-accruals, which will show whether stress moves from the edges towards senior layers.
- NAIC capital-rule outcomes on the $544 billion complex subset.
If senior tranches hold and disclosures show manageable concentration, the containment case strengthens. If liquidity strains surface at a large insurer, Nemeth’s thesis gains weight.
This is educational analysis of one investor’s case against mainstream evidence. Past performance does not guarantee future results, and forward-looking statements are speculative and subject to change.
This article is for informational purposes only and should not be considered financial advice. Investors should conduct their own research and consult with financial professionals before making investment decisions.