A chart can be right about direction and still be the wrong reason to buy an option. In Johnson & Johnson (JNJ), three separate support levels pointed to the same 244-246 zone. The trader who mapped it, Jake Sweeney, looked at the options chain and passed anyway.
That decision is worth studying because it shows how options trading decisions get made in practice. A chart tells you where price might go. The options chain tells you whether you can turn that view into a position without overpaying, mistiming it, or settling for a strike that misses your target.
The risk for you is paying for a good idea through a bad structure. Your directional call can be close to correct, and the trade can still lose money because the premium was too rich, the expiry too short, or the strike in the wrong place.
This case gives you a repeatable way to test any chart idea against strikes, delta, implied volatility and sentiment before you put capital at risk.
Why did the JNJ chart look like a good bearish setup?
Start with the stock itself. JNJ had fallen for four straight days and was trading around 254 on the day of the analysis, with a small bounce during that session. Sweeney expected more downside, and the chart gave him reasons.
Three separate levels stacked up beneath the price:
- Rising trend line: Drawn from a pivot low in April 2025, this line had switched between support and resistance several times and was acting as support again. A retest near 245 was in play if price reached it that week.
- Pivot shelf at 246.35: Price had pushed into this level three times and left wicks each time. A wick is the thin line on a candle showing where price traded briefly before being pushed back.
- Unfilled gap near 244.60: A gap is a price range the stock skipped over between sessions. Traders often watch for price to return and fill it.
When separate signals point to the same place, the case gets stronger. Analysts call that overlap a confluence.
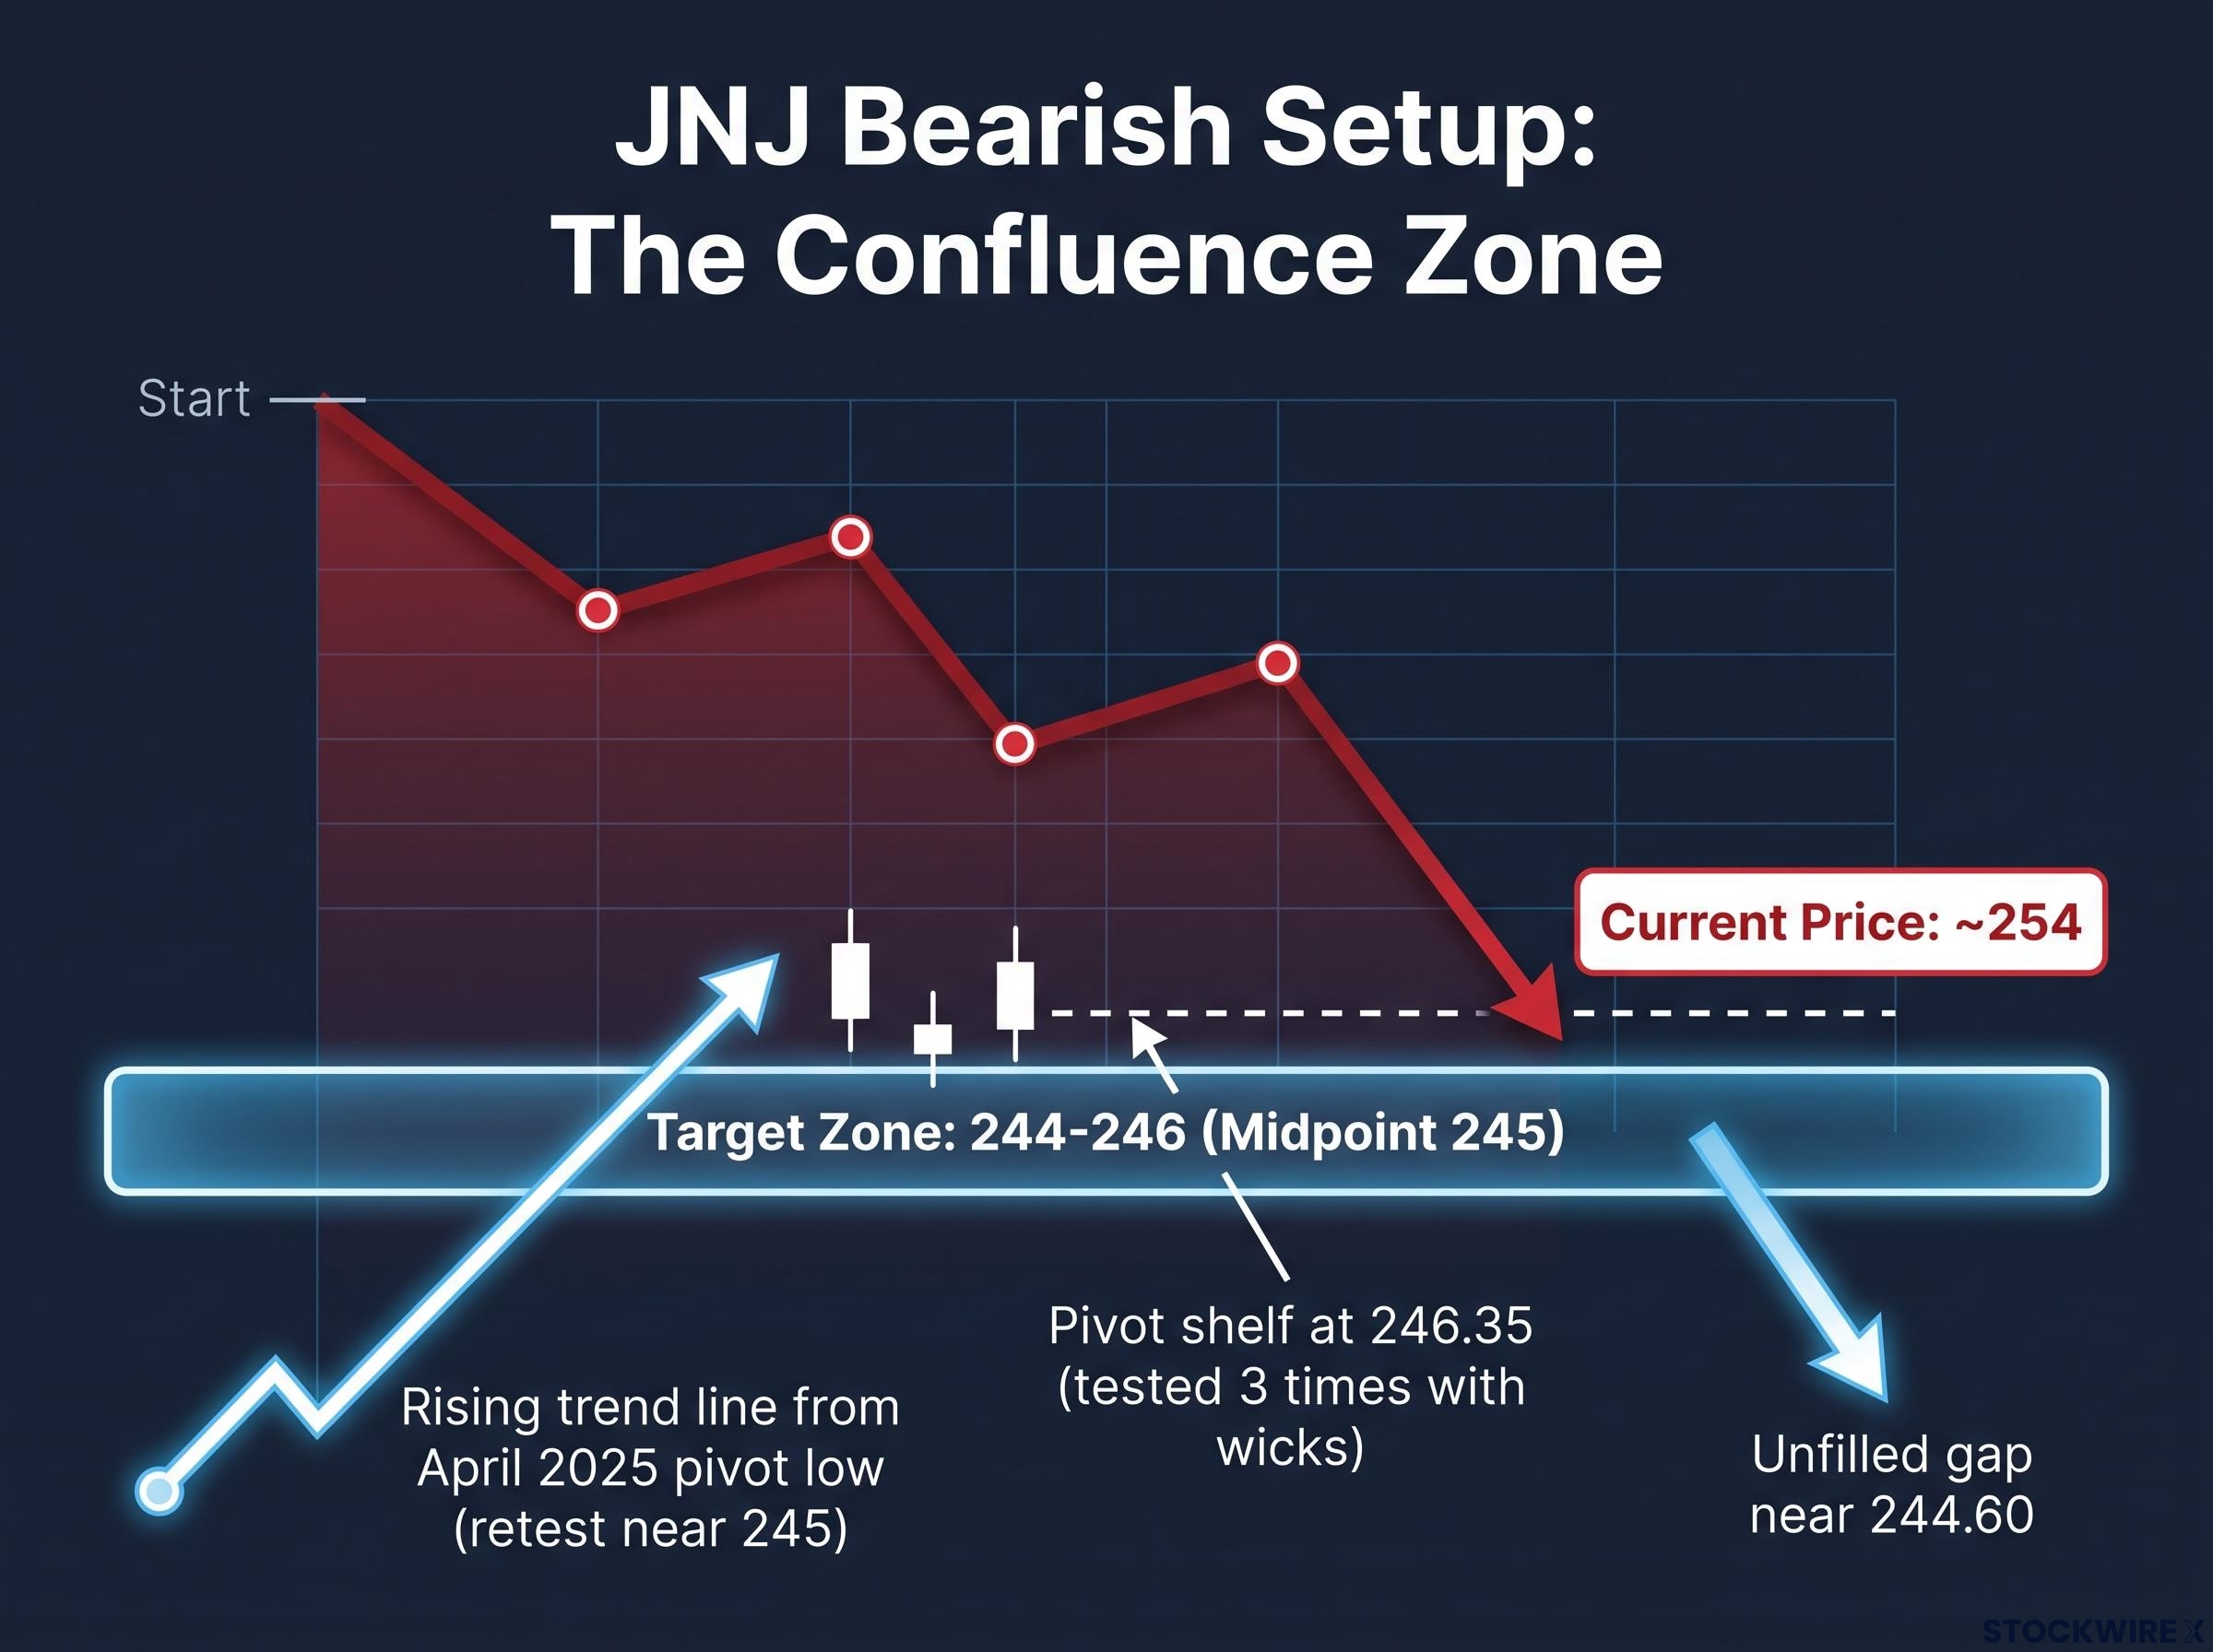
The target zone 244-246, with a midpoint of 245, where the trend line, pivot shelf and gap overlapped.
Sweeney also showed restraint. Price had already bounced off the pivot top that day, so he avoided chasing an entry there. On price alone, the setup was reasonable and carefully built.
The fundamentals were less friendly to a bearish view. JNJ had delivered beat-and-raise quarters, agreed to a $5.5 billion talc settlement in July 2026, and drawn analyst targets well above 254: JPMorgan at $285 and Citi at $303. Those were early signs that a short thesis faced headwinds.
The chart’s quality still matters. A three-level confluence tells you the idea was well constructed. It tells you nothing about whether an option could be bought at a fair price to capture it.
When big ASX news breaks, our subscribers know first
How do you test a chart idea against an options chain?
The chart answers “where?” It cannot answer “with what, and by when?” That second question belongs to the options chain, which is the full list of available contracts for a stock, sorted by expiry date and strike price.
Run four checks before you commit:
- Strike availability: Is there a strike at or near your target?
- Days to expiration (DTE): Does the time left on the contract match how long you expect the move to take?
- Delta: Does the option respond enough to the stock’s moves to make the trade worthwhile?
- Liquidity: Are there enough buyers and sellers to get in and out at fair prices?
Strikes and expirations
Monthly options expire on the third Friday of each month. Liquid large-caps like JNJ also list weekly expirations on most Fridays.
Strikes near the current price usually come in $2.50 or $5 increments, with wider gaps further out. Exchanges can add strikes when demand justifies it, but no strike is guaranteed to exist.
The alignment rule A clear technical target is only useful if the chain offers strikes that line up with it.
DTE should match your expected holding period. Short-term setups often use 7-30 DTE and position trades 30-90 DTE. Sweeney prefers 30-45 DTE for swing trades. Very short-dated options magnify gamma and theta, so small timing errors cost you more. Gamma measures how fast delta changes, and theta measures how much value an option loses each day.
Delta and liquidity
Delta measures roughly how much an option’s price moves for each $1 move in the stock. It is also commonly read as a loose gauge of how likely the market thinks the option is to finish in the money.
For directional long options, deltas around 0.60-0.70 suit aggressive bets near the current price. Deltas around 0.30-0.50 suit modest swing ideas. Spreads and premium-selling strategies often use 0.15-0.30.
Liquidity is the last check. Look at open interest (the number of contracts still open), recent volume and the bid-ask spread. Weekly and far-out strikes on single stocks are often thin, which makes exits costly.
The takeaway: a good chart is a hypothesis. The chain is where you find out whether you can act on it.
What did the JNJ chain actually show?
Sweeney worked down the expiry dates on his Interactive Brokers platform. Each row added a new obstacle.
The 16 October contract came first. The 245 put was quoted at a 1.52 bid and 1.66 ask, roughly 1.60 mid, with a delta near -0.2. At just 10 days to expiry, it left too little time for a swing trade.
Because delta shifts over time and polarises toward the extremes near expiration, the same strike can look workable at 45 days and unworkable at 10, which is why the 16 October contract failed Sweeney’s test.
The 20 November expiry fell inside his preferred window, but it had no 245 strike. That forced a choice: the 250 put at -0.379 delta, which no longer matched the target, or the 240 put at -0.221, which matched poorly and responded weakly. Going out to 18 December, 73 days away, did not help. The 240 strike’s delta was still unsuitable.
| Expiry | Days to expiration | Strike tested | Delta | Problem |
|---|---|---|---|---|
| 16 October | 10 | 245 | About -0.2 | Too short for a swing trade |
| 20 November | Within 30-45 window | 250 / 240 (no 245) | -0.379 / -0.221 | Misaligned strike or low delta |
| 18 December | 73 | 240 | Unsuitable | Delta still too low |
Then came the factors that sank the trade:
- Low delta on every strike near the target.
- Expensive premium, driven by high implied volatility.
- A bullish put/call ratio, running against the bearish chart.
Why high implied volatility makes long puts expensive
Implied volatility (IV) is the size of the price swing the options market expects. IV percentile shows the share of days in the past year when IV was lower than it is now. IV rank is a different measure: it shows where today’s IV sits between its yearly high and low. A precise IV rank for JNJ is not available here.
Sweeney’s review put JNJ’s IV percentile near 80, and about 81 at his wrap-up. OptiView reports 87% as of 5 October 2026. The gap likely reflects timing and calculation differences. Either way, IV was high.
High IV widens the expected price range and inflates premium. It also adds vega risk, which is exposure to changes in IV. If IV drops sharply, known as a volatility crush, a put can lose value even when the stock falls. Theta keeps eating that richer premium every day.
Premium sellers, including educators associated with tastytrade, treat high IV as a reason to sell options rather than buy them. Directional buyers accept the cost only if they expect a move bigger than the one already priced in.
What a bullish put/call ratio does and does not tell you
The put/call ratio compares put activity with call activity. JNJ’s volume ratio was 0.58 during the review and 0.45 at the wrap-up, meaning call trading outweighed put trading.
Some traders read extreme ratios as contrarian signals and others as confirmation. The measure has limits: it blends hedging with speculation, and single-stock readings are noisy. A mismatch with your chart is a caution flag, not a verdict.
Put together, the message from the chain was clear. When the key strike is missing and every alternative is too short, too low in delta or too expensive, the market does not price your target as a likely move within your timeframe.
Why is passing a legitimate trade, and what should you do next?
Passing can feel like losing. It is not. Risk-management education, including the CFA curriculum and broker teaching material, treats not trading as an active decision that protects capital for better setups.
The principle Not trading is an active choice, not a failure to act.
A second filter exists for a reason. Discretionary chart reading is subjective. Trend lines depend on which points you anchor to, and support can be drawn from wicks or closes. Academic studies generally find a modest or shrinking edge from technical rules once real trading costs are included.
Price charts can also miss catalysts. Investor’s Business Daily reported that JNJ fell 2.7% after its Q2 2026 results despite a headline beat, because two segments missed expectations. Event risk can override any chart level, in either direction.
In JNJ’s case, three checks decided the outcome: delta, premium cost through IV, and crowd sentiment through the put/call ratio. Add beat-and-raise quarters, the talc settlement and analyst targets above the trade’s price zone, and the case for standing aside got stronger.
Before any options trade, run a short filter:
- Does a strike exist at or near your target?
- Does the DTE match your expected holding period?
- Is the delta workable for your strategy?
- Is IV reasonable, or are you overpaying?
- Does sentiment agree with your chart, or fight it?
When the chain does not fit, your options
You have three moves. You can shift to a nearby strike, such as 244 or 246 if listed. You can change the structure, for example by using a spread or a different expiry. Or you can stand aside.
Forcing a trade into a chain that does not fit is the costly choice. Every trade you skip protects capital and attention for the “A-plus” setup, where the chart, the fundamentals and the chain all agree.
Investors exploring what to do when IV is elevated will find our full explainer on choosing a strategy by IV regime, which sets out when selling premium beats buying it.
What this case changes about how you vet the next setup
In JNJ’s case, the chart supplied the direction, the chain supplied the verdict, and the pass kept capital intact. That order is the lesson. A setup is not complete until the contracts available to you support it.
Before your next chart idea, run the five-part filter, and write down in advance which chain conditions would make the trade acceptable: the strike, the DTE window, the delta range and the IV level you will tolerate. Setting those terms first stops a persuasive chart from talking you into a weak structure. Build that list into a personal pre-trade checklist and use it every time.
This case is educational and is not a recommendation to trade or avoid JNJ. This article is for informational purposes only and should not be considered financial advice. Investors should conduct their own research and consult with financial professionals before making investment decisions. Past performance does not guarantee future results.