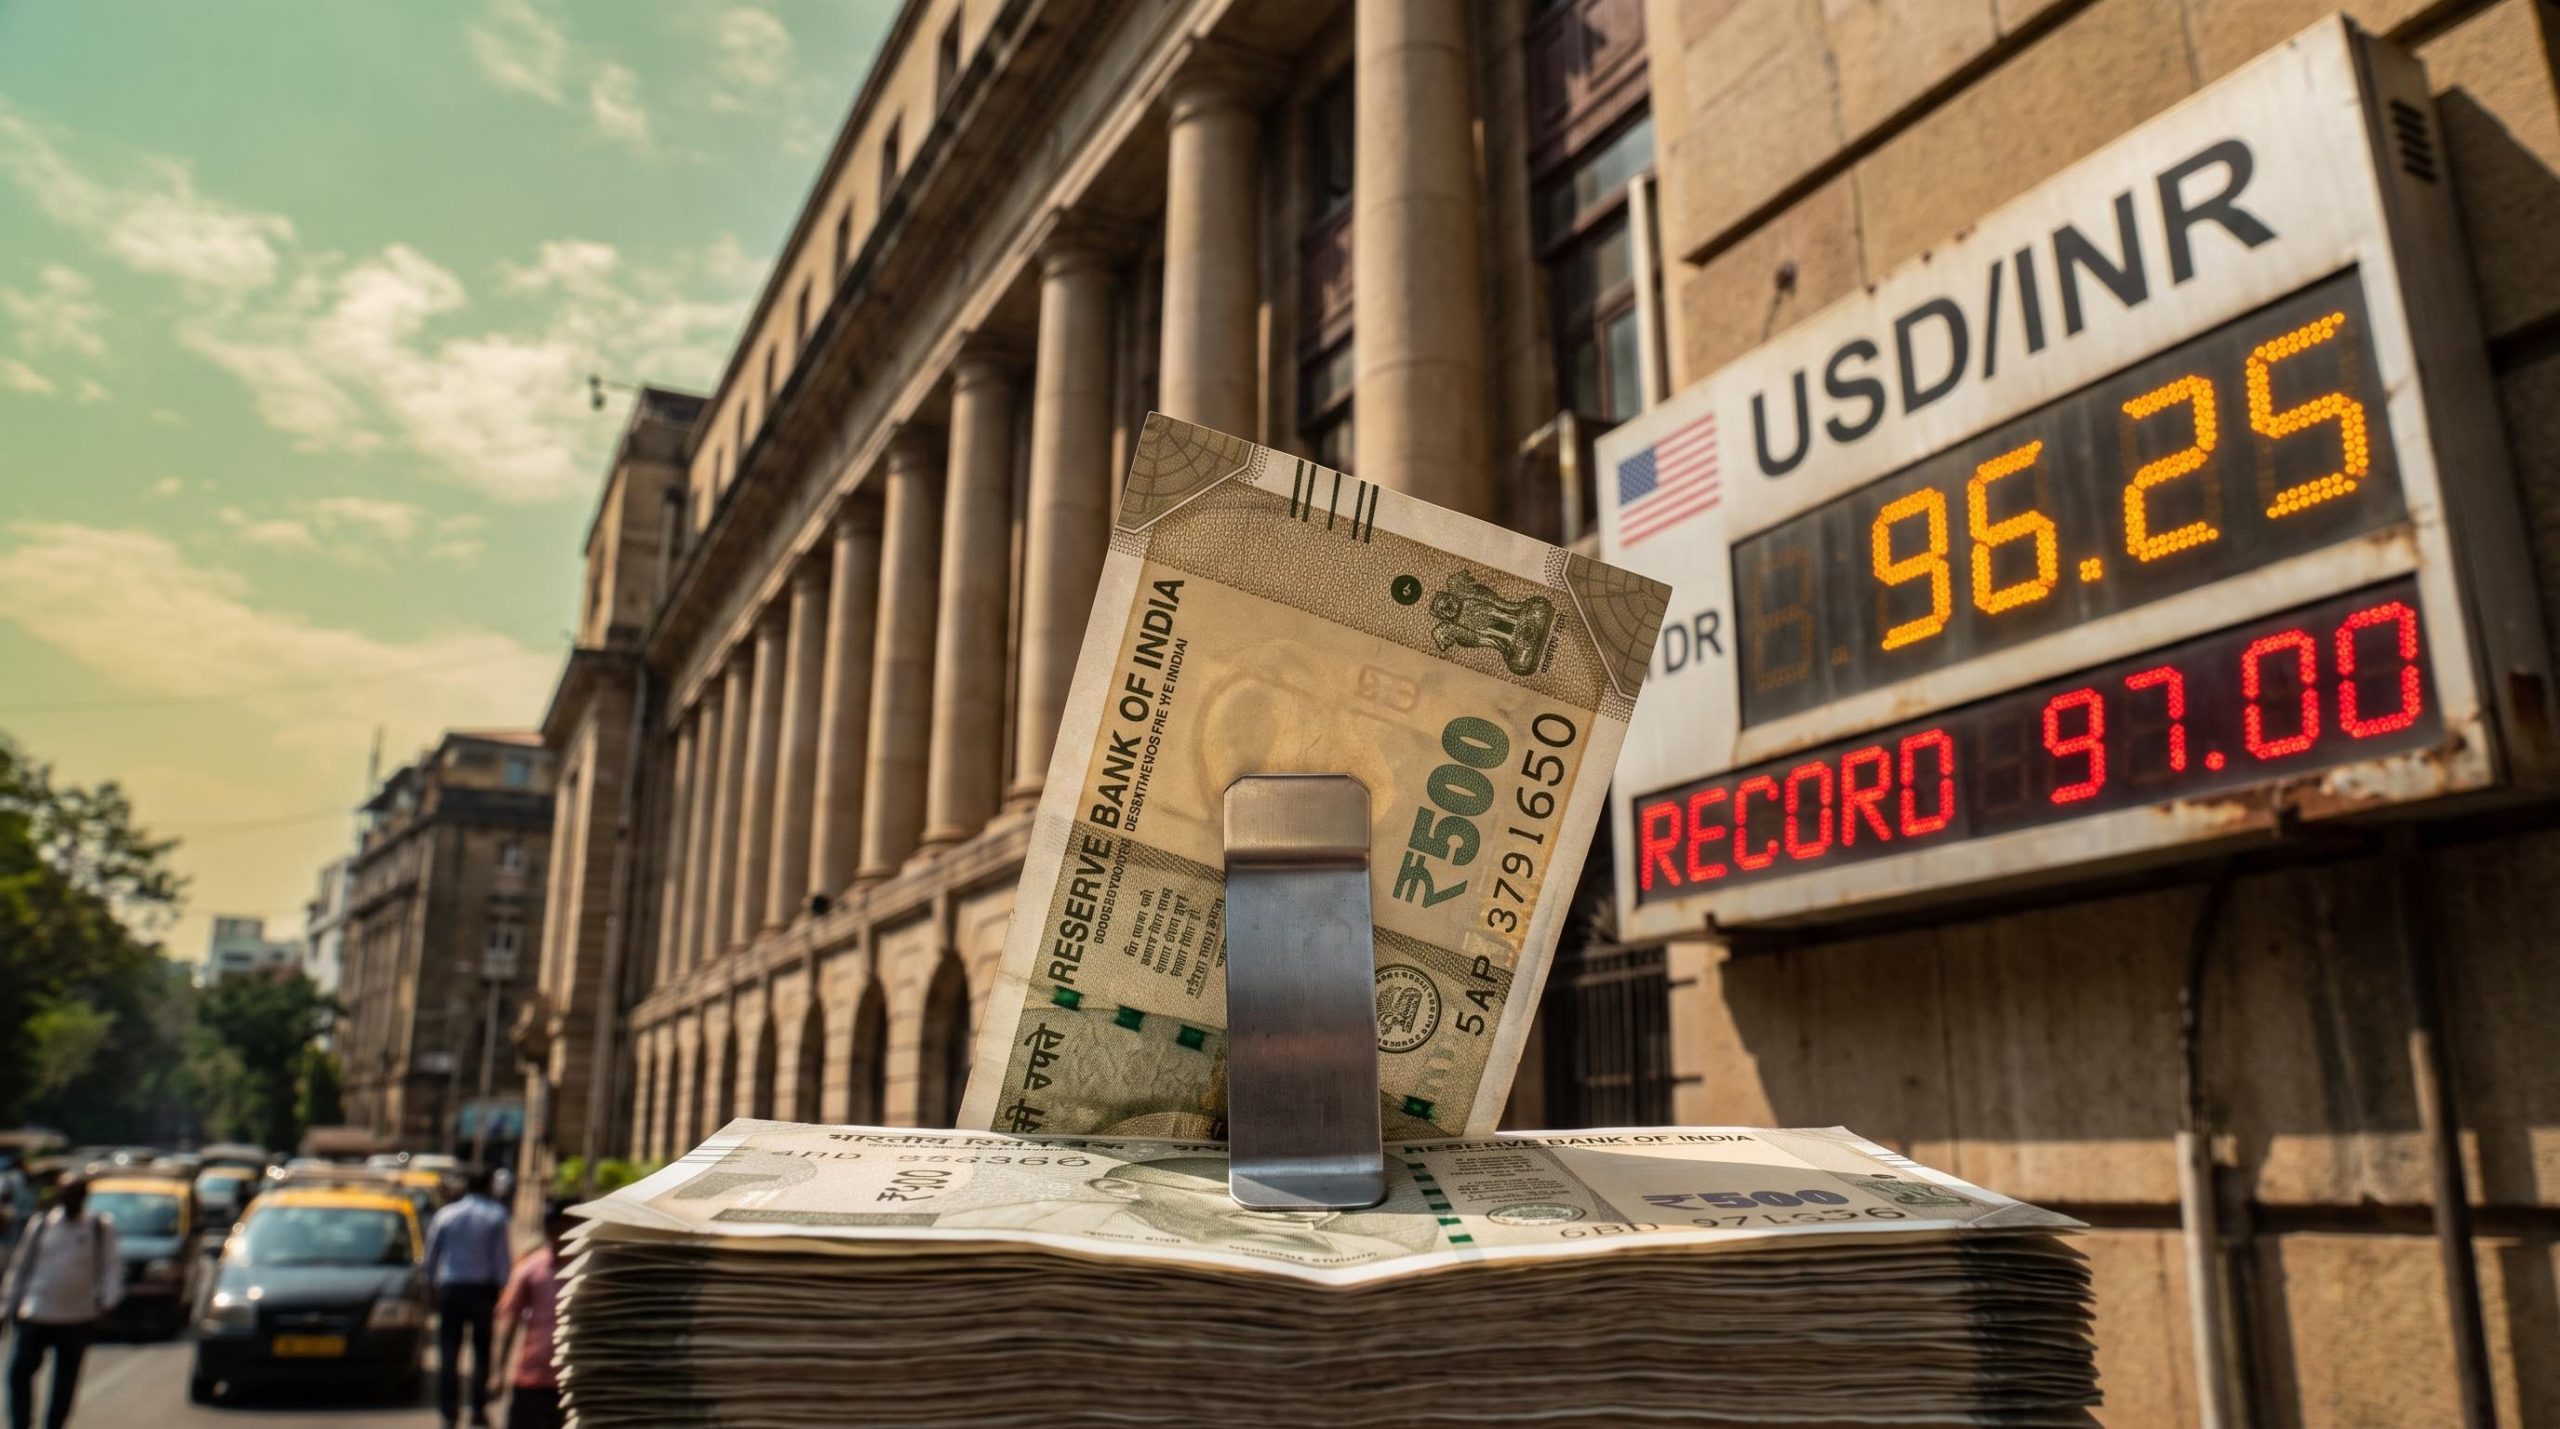
The rupee should have rallied harder. Weak US jobs data usually drags the dollar lower, yet the dollar index (DXY) sits at a yearly high near 102.53, and USD/INR slipped only to about 96.25, still within a rupee of its 97.00 record.
That puts the USD/INR outlook at the centre of Reserve Bank of India (RBI) policy week, with the decision due on Wednesday, 7 October 2026. The rupee is squeezed between a softer Fed path and a domestic inflation problem: August consumer price inflation (CPI) hit 4.82%.
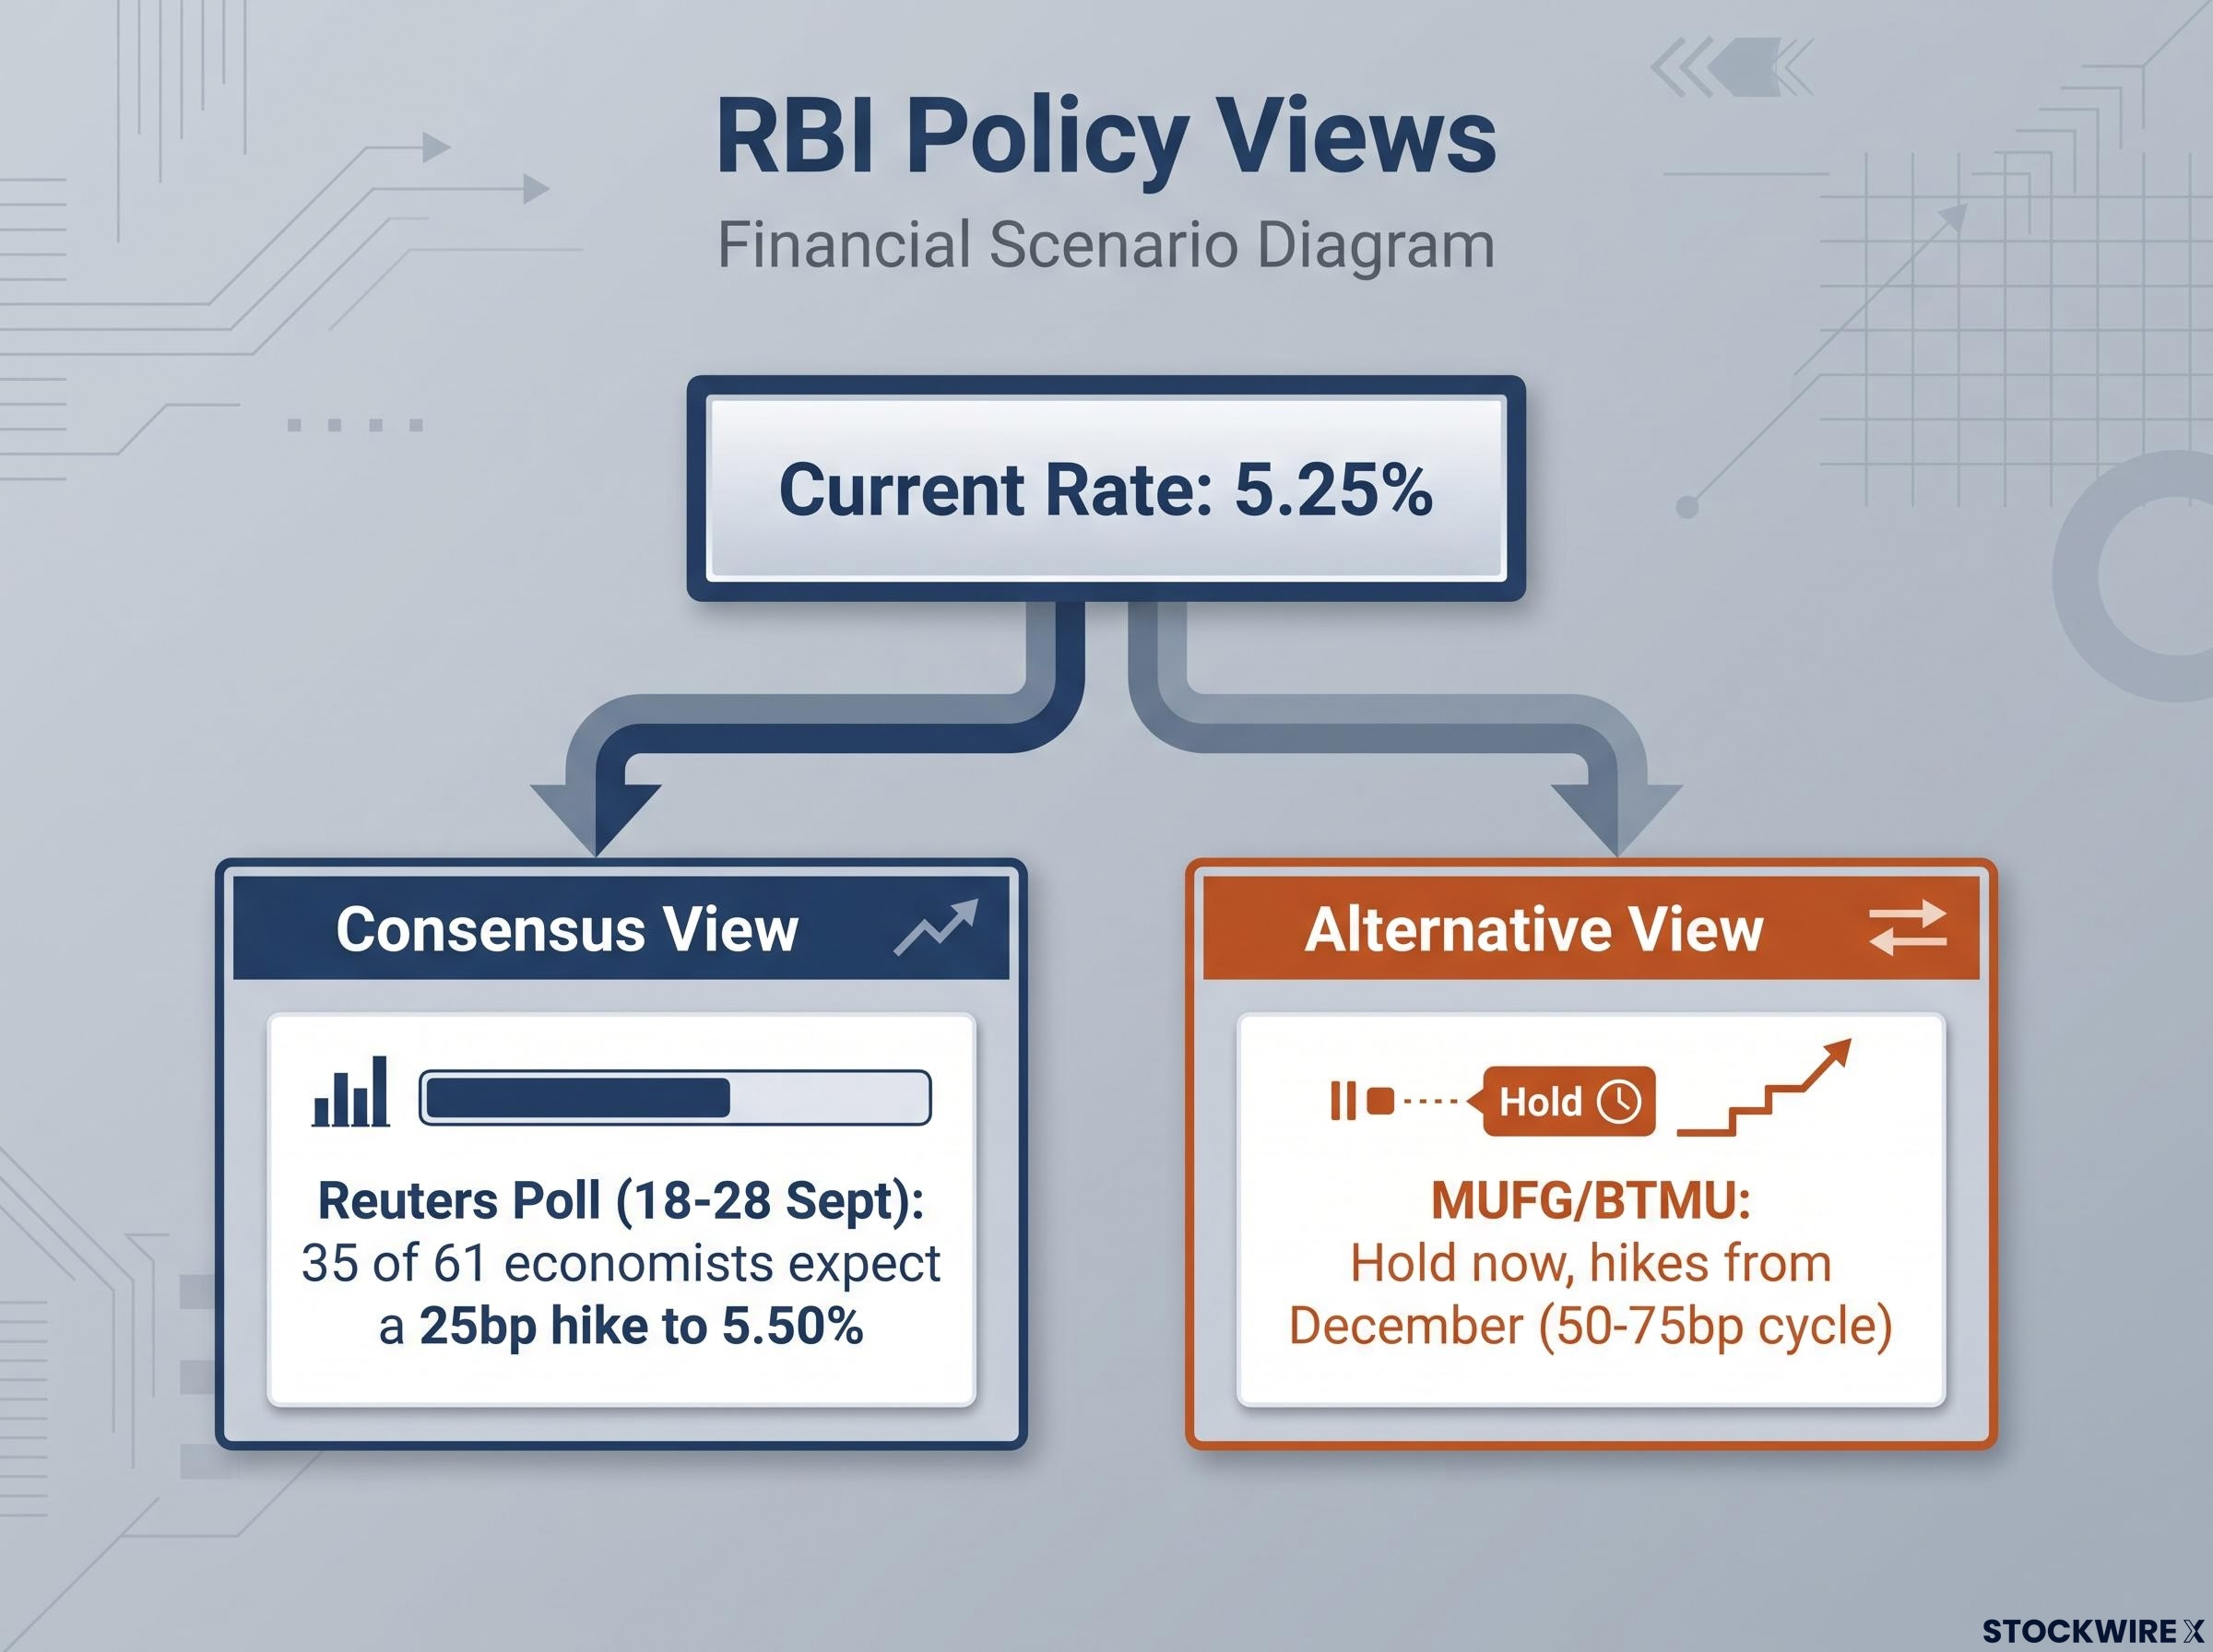
The RBI is India’s central bank, and its repo rate, the rate at which it lends to banks, is the main policy lever. It currently stands at 5.25%.
Here is a framework for reading Wednesday’s decision, the levels that matter, and the forces that move the rupee.
Why did soft US payrolls only nudge the rupee higher?
The chain of events started on 2 October. US nonfarm payrolls for September rose by just 29,000, against a forecast of 90K, and the prior month was revised down to 133K from 162K. Markets pared bets on a Fed hike, which lifted appetite for riskier assets such as the rupee.
Fed hike pricing had stood near 70% for October before the payrolls miss, and the swing to an 82.3% hold probability shows how quickly the dollar’s rate support can be questioned.
| Indicator | Actual | Expected or Prior | Signal |
|---|---|---|---|
| Nonfarm payrolls | +29,000 | 90K forecast | Sharp hiring miss |
| Unemployment rate | 4.2% | 4.1% expected | Labour market loosening |
| Average hourly earnings y/y | 3% | 3.2% forecast; 3.1% in August | Lowest since May 2021 |
| Fed hold probability (October) | 82.3% | 35.8% a week earlier | Hike risk fading |
Hourly earnings rose 0.1% month on month to $37.81, and CNBC noted the annual wage growth rate was the lowest since May 2021.
The repricing in one number The CME FedWatch probability of an unchanged Fed rate in October jumped to 82.3%, from 35.8% a week earlier.
Then came the contradiction. The 10-year Treasury yield held near 5.27%, just under the two-decade peak of 5.34% reached the prior week, while the dollar index touched its yearly high. Elevated inflation projections and French fiscal risks kept both firm.
That is why the rupee’s gain was small and conditional. A weak US print lowers pressure on USD/INR but does not remove it, so US data alone cannot tell you where the pair goes next.
When big ASX news breaks, our subscribers know first
Hike now or hold and signal? What the RBI decision could mean for USD/INR
The market is split. A Reuters poll of 61 economists (18-28 September) found 35, about 60%, expect a 25bp hike to 5.50%, with another in December. The rest expect a hold.
MUFG/BTMU, the Japanese banking group’s research arm, forecasts a hold now and hikes from December. It sees a good chance of the RBI shifting from a neutral stance to a tightening bias, with 50bp of hikes this cycle and a risk of 75bp.
The sources differ on October timing but agree tightening is coming. MUFG also flags that rate market pricing is already quite rich, so a hike may be largely priced in.
The August RBI meeting minutes showed four of six committee members leaning cautious to hawkish, which helps explain why economists see tightening as the direction of travel even after repeated holds.
| Scenario | Likelihood View | Likely Rupee Implication |
|---|---|---|
| 25bp hike to 5.50% | Majority of Reuters poll | Supportive, though largely priced in |
| Hold with tightening bias | MUFG/BTMU base case | Supportive if December guidance is clear |
| Hold with neutral or dovish tone | Minority risk | Most likely to push USD/INR toward 97.00 |
The implications column is analytical judgement, not a forecast from any source. What it tells you is that both a hike and a hawkish hold lead to tightening, so the surprise relative to consensus, not the decision itself, is what should move the rupee.
What the April and August holds tell you
In April, the RBI held at 5.25% even as the rupee hit a record low and foreign investors pulled nearly $19 billion from Indian markets. It judged that inflation averaging 4.6% sat within its band and that tightening risked growth.
In August the committee held unanimously, choosing to await clearer evidence that higher oil prices were feeding broader inflation. Reuters noted on 28 September that the RBI now faces a “markedly different policy backdrop”, with nearly half the CPI basket rising 4% or more year on year, versus about a third in March.
What actually drives the rupee? A reader’s toolkit
In March and early April, the rupee fell to a record low without any change in domestic policy. Reuters reported on 8 April that foreign funds withdrew nearly $19 billion amid the Middle East crisis.
The outflow figure Nearly $19 billion left Indian markets between March and early April 2026, enough to push the rupee to a record low with no domestic policy shift.
That episode shows why one headline rarely explains a currency move. Five drivers matter:
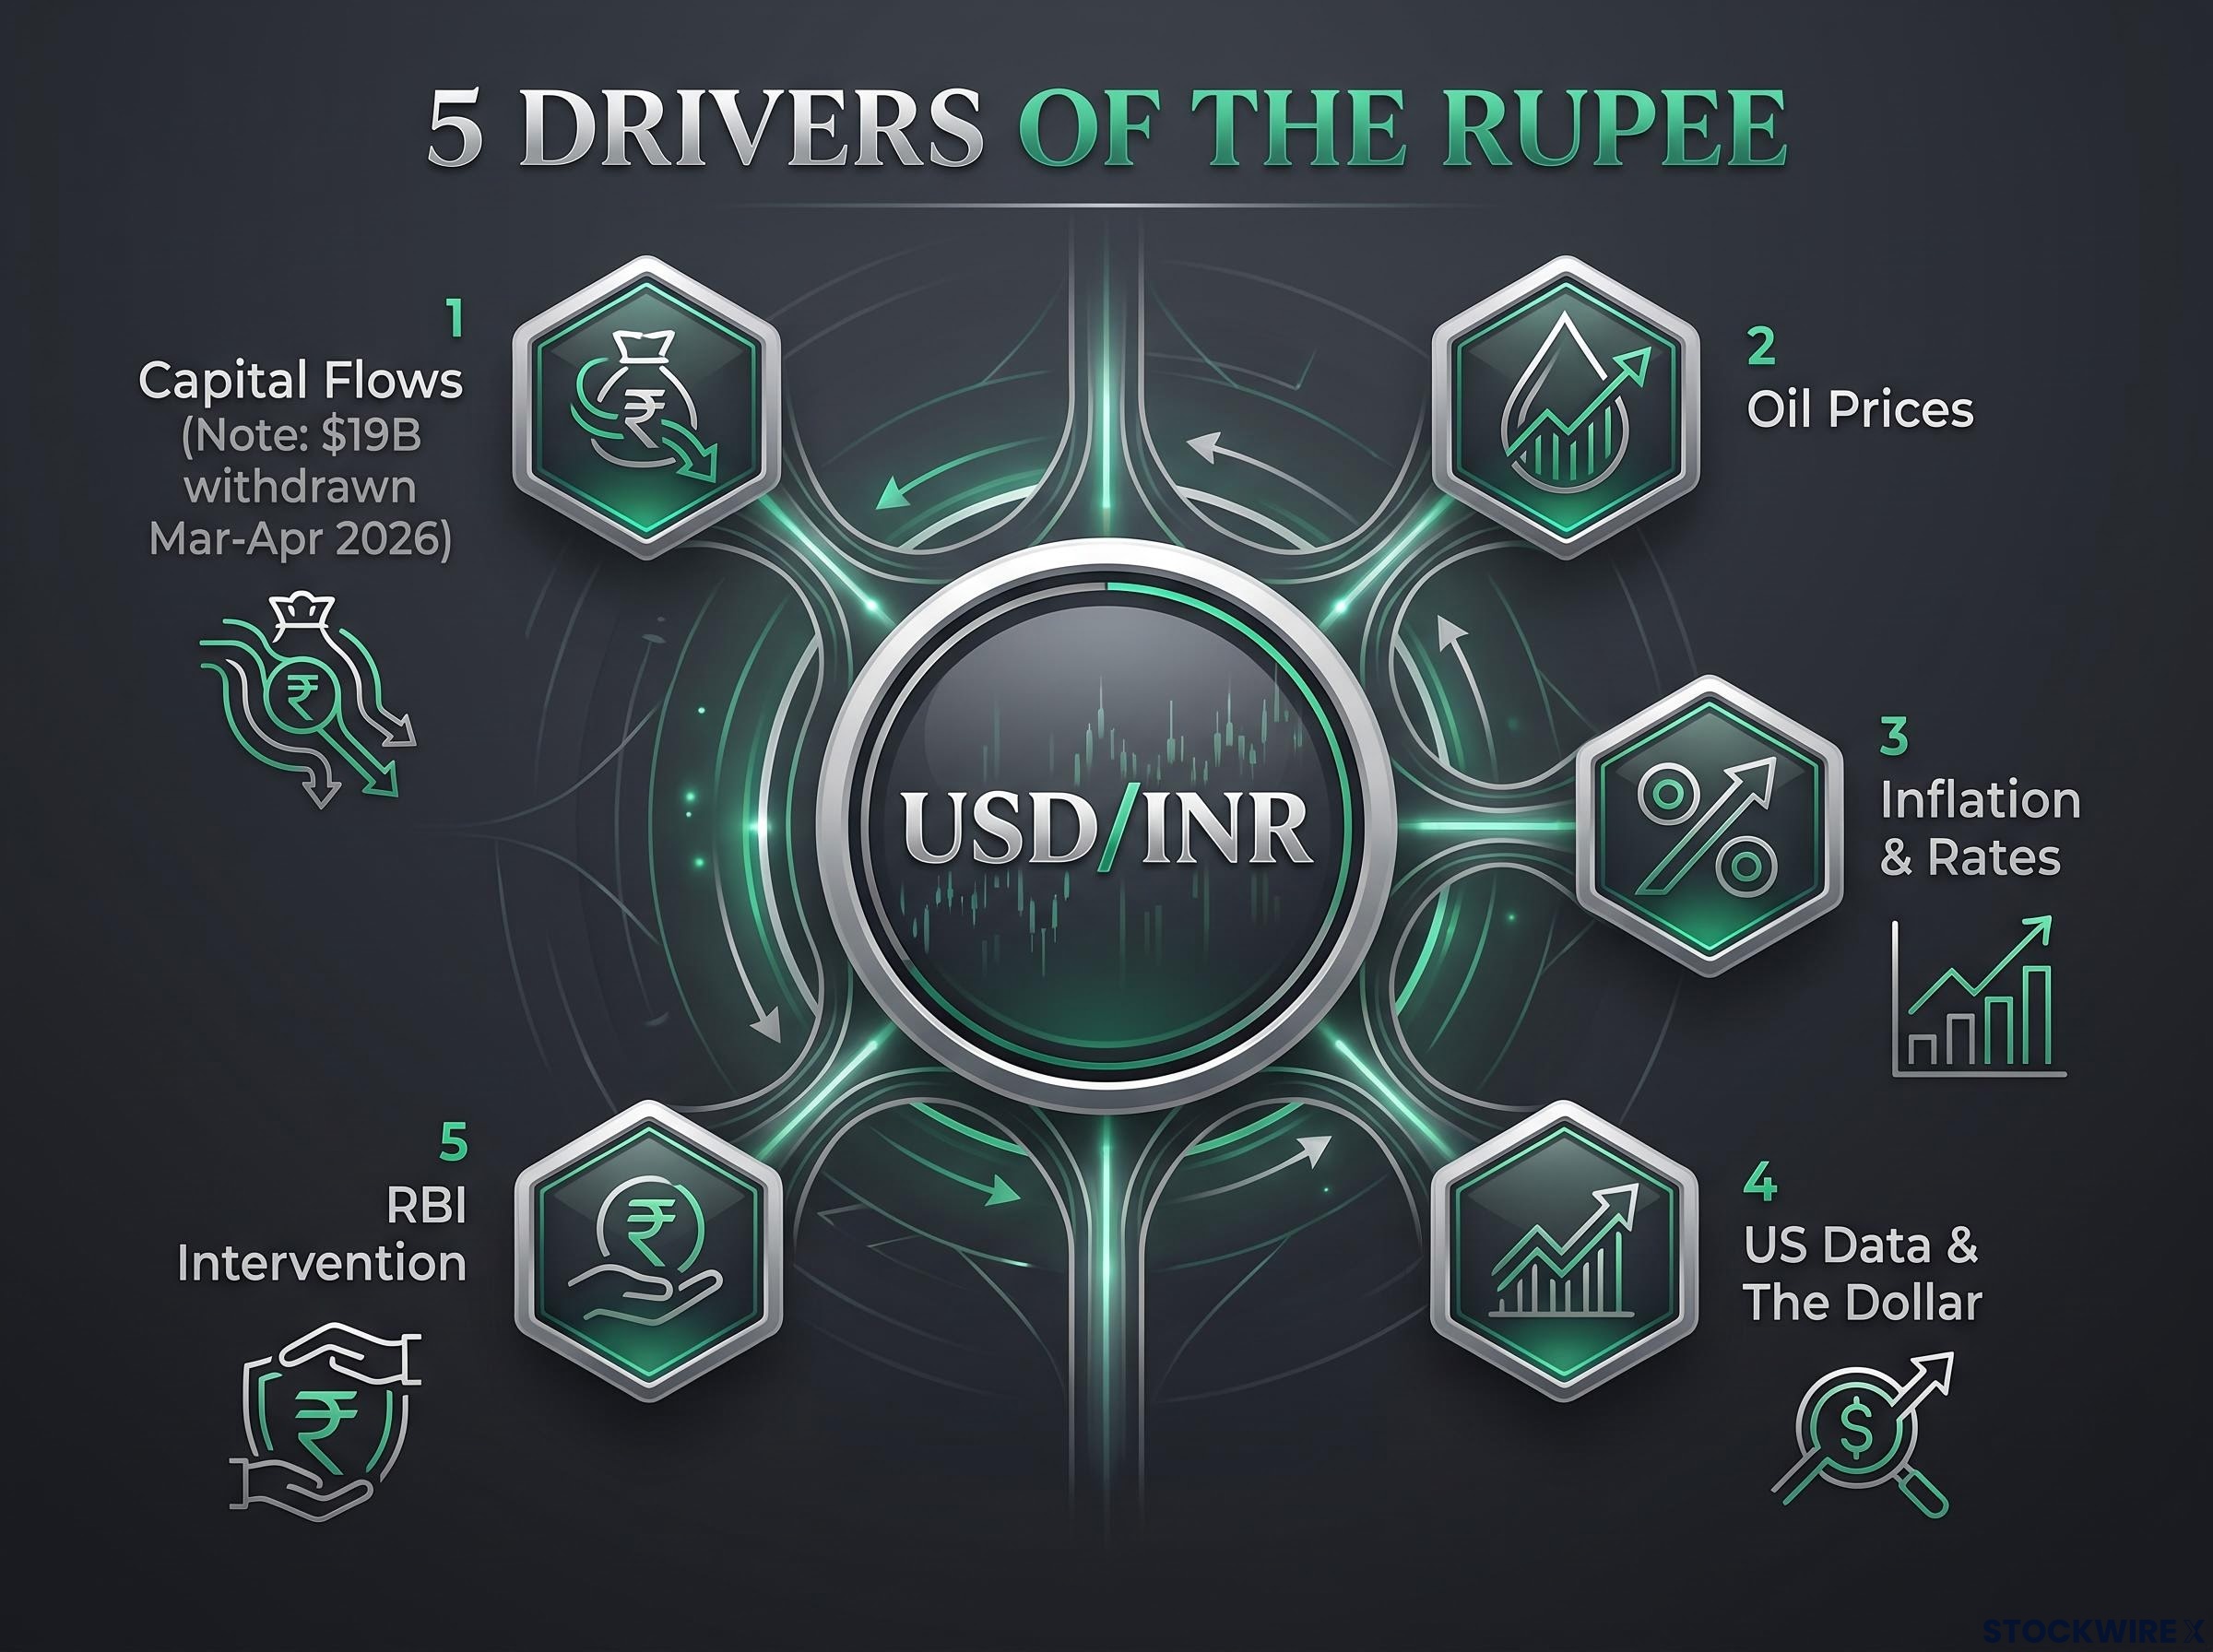
- Capital flows (two-way): Foreign money leaving weakens the rupee; risk-on inflows, stronger growth and a narrower trade deficit support it.
- Oil (rupee-negative when prices rise): India imports heavily and trade is largely settled in dollars, so costlier crude widens the current account gap.
- Inflation and rates (two-way): Higher inflation is rupee-negative, but it can prompt RBI hikes. Higher real rates attract carry flows, meaning investors borrowing cheaply to earn higher yields.
- US data and the dollar (two-way): Soft US data lowers the expected Fed path and can ease pressure on emerging market currencies, but firm yields currently blunt that.
- RBI intervention (smoothing): The central bank trades in currency markets to calm volatility, which can mute headline USD/INR moves and mask underlying pressure.
When the rupee moves, ask which of these five is doing the work. That habit will serve you well beyond this week.
Higher inflation is not purely negative, because the way inflation can support the rupee runs through a credible RBI response that lifts real rates and draws carry flows back into Indian assets.
Reading the chart near 97.00: levels, stretch and risks
The daily chart and the fundamentals tell the same cautious story. According to FXStreet’s technical analysis, USD/INR holds a bullish bias above its 50-day exponential moving average (EMA), a trend line weighting recent prices, while consolidating near highs.
| Level or Indicator | Value | What it signals |
|---|---|---|
| Spot | 96.25 | Within about 0.75 of the record |
| 50-day EMA | 95.59 | Initial support |
| RSI(14) | 63.26 | Strong momentum, near stretched |
| All-time high | 97.00 | Upside target for a revisit |
The relative strength index (RSI) measures the speed of recent gains. This technical read comes from a single source, so treat it as one input rather than a verdict.
Spot sits close to the record, which means the 50-day EMA and the RBI’s tone are your two reference points for judging whether a retest or a pullback is more likely. The risks, ordered by near-term relevance:
- Upside US data that revives Fed hike pricing, with the 10-year near 5.27% and the dollar index at a yearly high.
- A dovish RBI tone, or tightening that falls short of consensus.
- Commodity and geopolitical shocks, which hit the rupee regardless of policy, as April showed.
- Priced-in tightening, which could limit the rupee’s reaction to a hike.
- RBI intervention, which can mask underlying pressure, alongside cautious positioning after the earlier outflows.
Past performance does not guarantee future results, and these projections are subject to market conditions and various risk factors.
What Wednesday settles, and what it leaves open
Soft US data eased pressure on the rupee, but a firm dollar, high yields and spot near the record leave it exposed. The RBI’s size, timing and tone now decide the next move.
Three things are worth checking after the announcement:
- The stance wording: a shift from neutral to tightening bias would be the clearest hawkish signal.
- December guidance: whether the RBI signals more hikes to come.
- US yields and the DXY: whether they ease or keep pressing on emerging market currencies.
This article is for informational purposes only and should not be considered financial advice. Investors should conduct their own research and consult with financial professionals before making investment decisions.