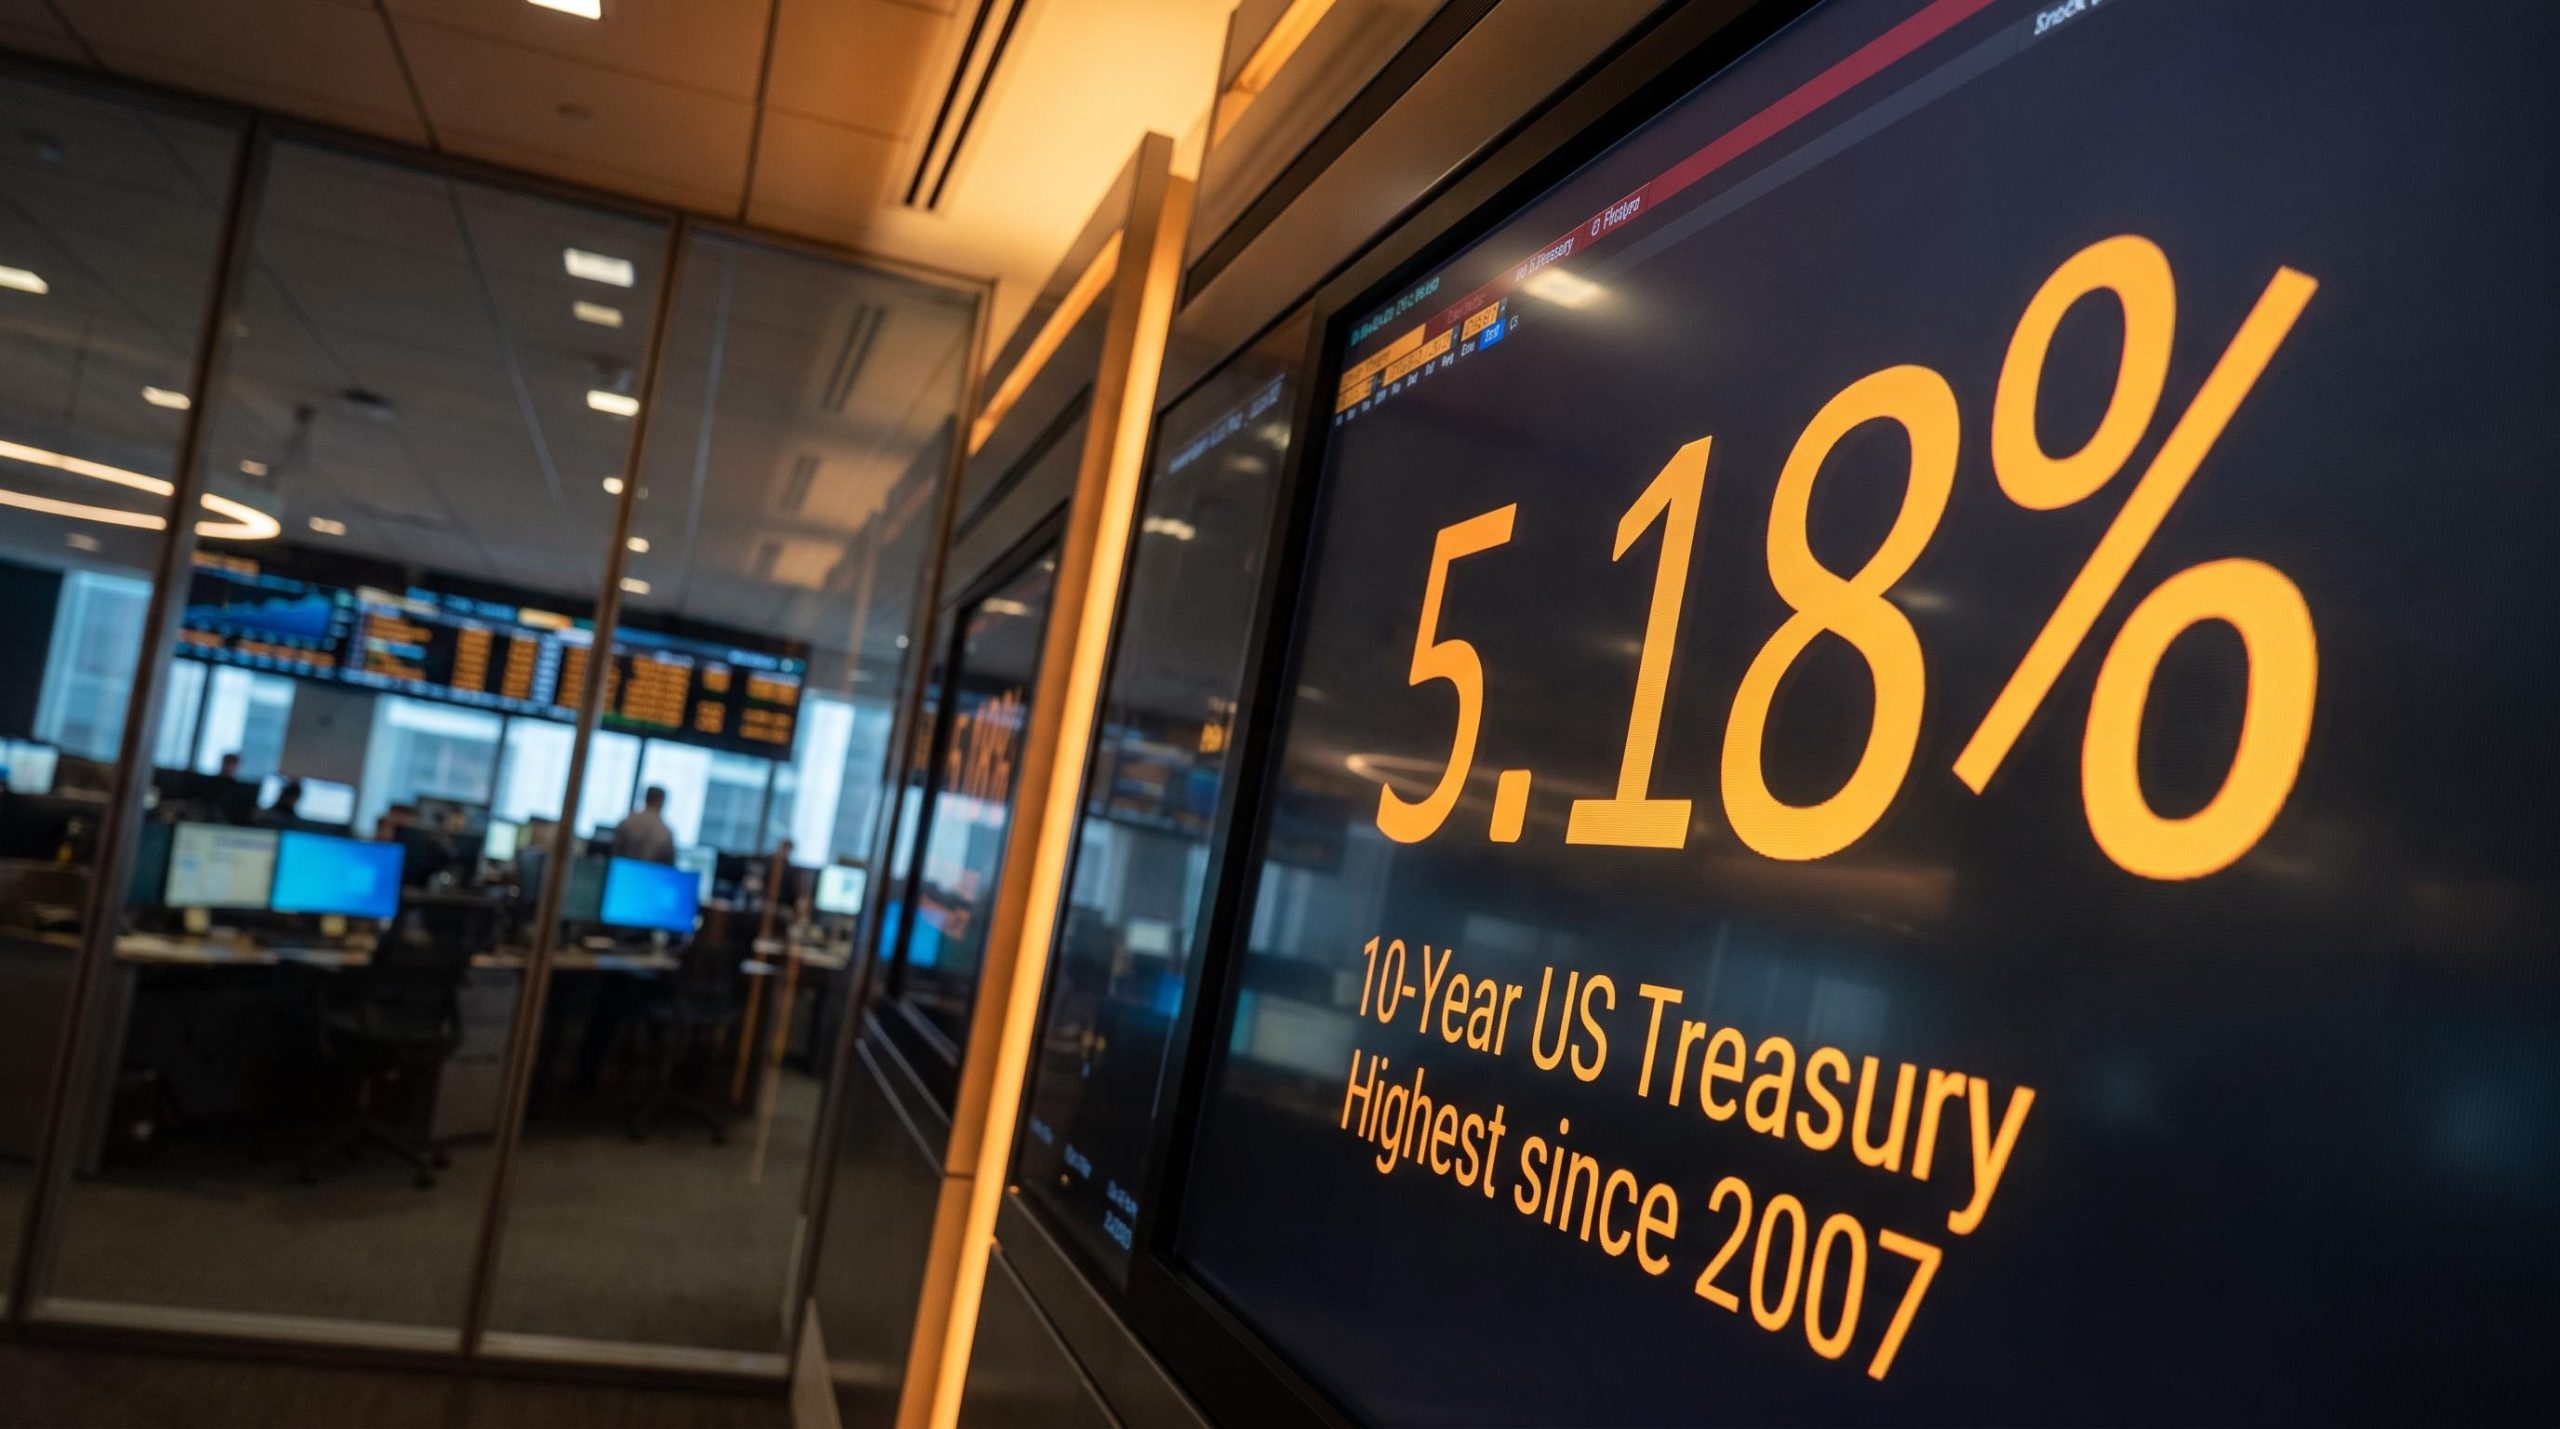
The 10-year US Treasury yield sits at 5.18% as of 25 September 2026, its highest level since 2007. The Dollar Index is holding just above 100.2. And markets are pricing roughly a 70% chance that the Federal Reserve raises rates again in October. Three numbers, all pointing in the same direction.
Here is what makes this moment unusually charged. The September non-farm payrolls report has not yet landed. When it does, it will either confirm the Fed’s hawkish trajectory or complicate it, and you are reading this at the point of maximum uncertainty before a consequential release.
Here is what the jobs number actually controls, and how to read the market reaction in real time when it arrives. Not background. A decision-relevant framework you can use the moment the data hits the screen.
Why yields and the dollar are already moving before the data drops
The readings you see today are not the result of a single catalyst. They are the outcome of forces stacking on top of one another over a compressed two-week window, and the market has already committed to a view.
Start with the mid-September FOMC meeting. On 16 September 2026, the Fed raised its target range for the federal funds rate by 25 basis points to 3.75%-4.00%, per CentralBank.watch. That same day, the 10-year Treasury yield closed at 5.01%, its highest daily close of 2026.
The move did not stop there. Yields kept pushing higher through late September, reaching 5.148% intraday on 24 September and touching 5.18% on 25 September, according to Tradeweb data reported by Dow Jones and TradingEconomics. This was not a one-day reaction to the hike; it was a sustained re-rating of where rates settle.
The dollar tracked the same path. The Dollar Index climbed from 99.68 to roughly 100.2 across the September window, its first move above 100 since July, per Mitrade and FinanceFeeds coverage. The mechanism is a widening real-rate differential: higher US yields make dollar-denominated assets more attractive relative to other major economies.
The DXY breakout above 100 was driven by three forces converging simultaneously: the unanimous 12-0 September hike, a 30-basis-point jump in the dot-plot median to 4.1%, and Middle East geopolitical risk layering safe-haven demand on top of the existing yield-differential move.
The yield-dollar link is tighter than usual right now
How closely the two are moving together matters. Bloomberg reported the connection has rarely been this direct in recent months.
The rolling 30-day correlation between the dollar and 10-year yields has risen above 0.40, the highest reading in over two months, according to Bloomberg.
| Date | 10-Year Yield | DXY Level | Event |
|---|---|---|---|
| 16 September 2026 | 5.01% | ~99.68 | FOMC 25bp hike to 3.75%-4.00% |
| 19 September 2026 | ~5.0% | ~100.2 | DXY closes above 100 |
| 24 September 2026 | 5.148% | ~100.2 | Highest yield since 2007 |
| 25 September 2026 | 5.18% | ~100.2 | Pre-payrolls positioning |
With the 30-year yield near peaks last seen in the mid-2000s, the takeaway for you is direct. Markets have not paused to wait for confirmation. They have already priced a world where the Fed stays higher for longer, and the September jobs number will either validate that positioning or force a scramble to unwind it.
When big ASX news breaks, our subscribers know first
How a jobs number becomes a rate decision
You see a single headline figure on your screen: jobs added last month. What happens next unfolds in a specific sequence, and knowing the order is what separates a prepared investor from a reactive one.
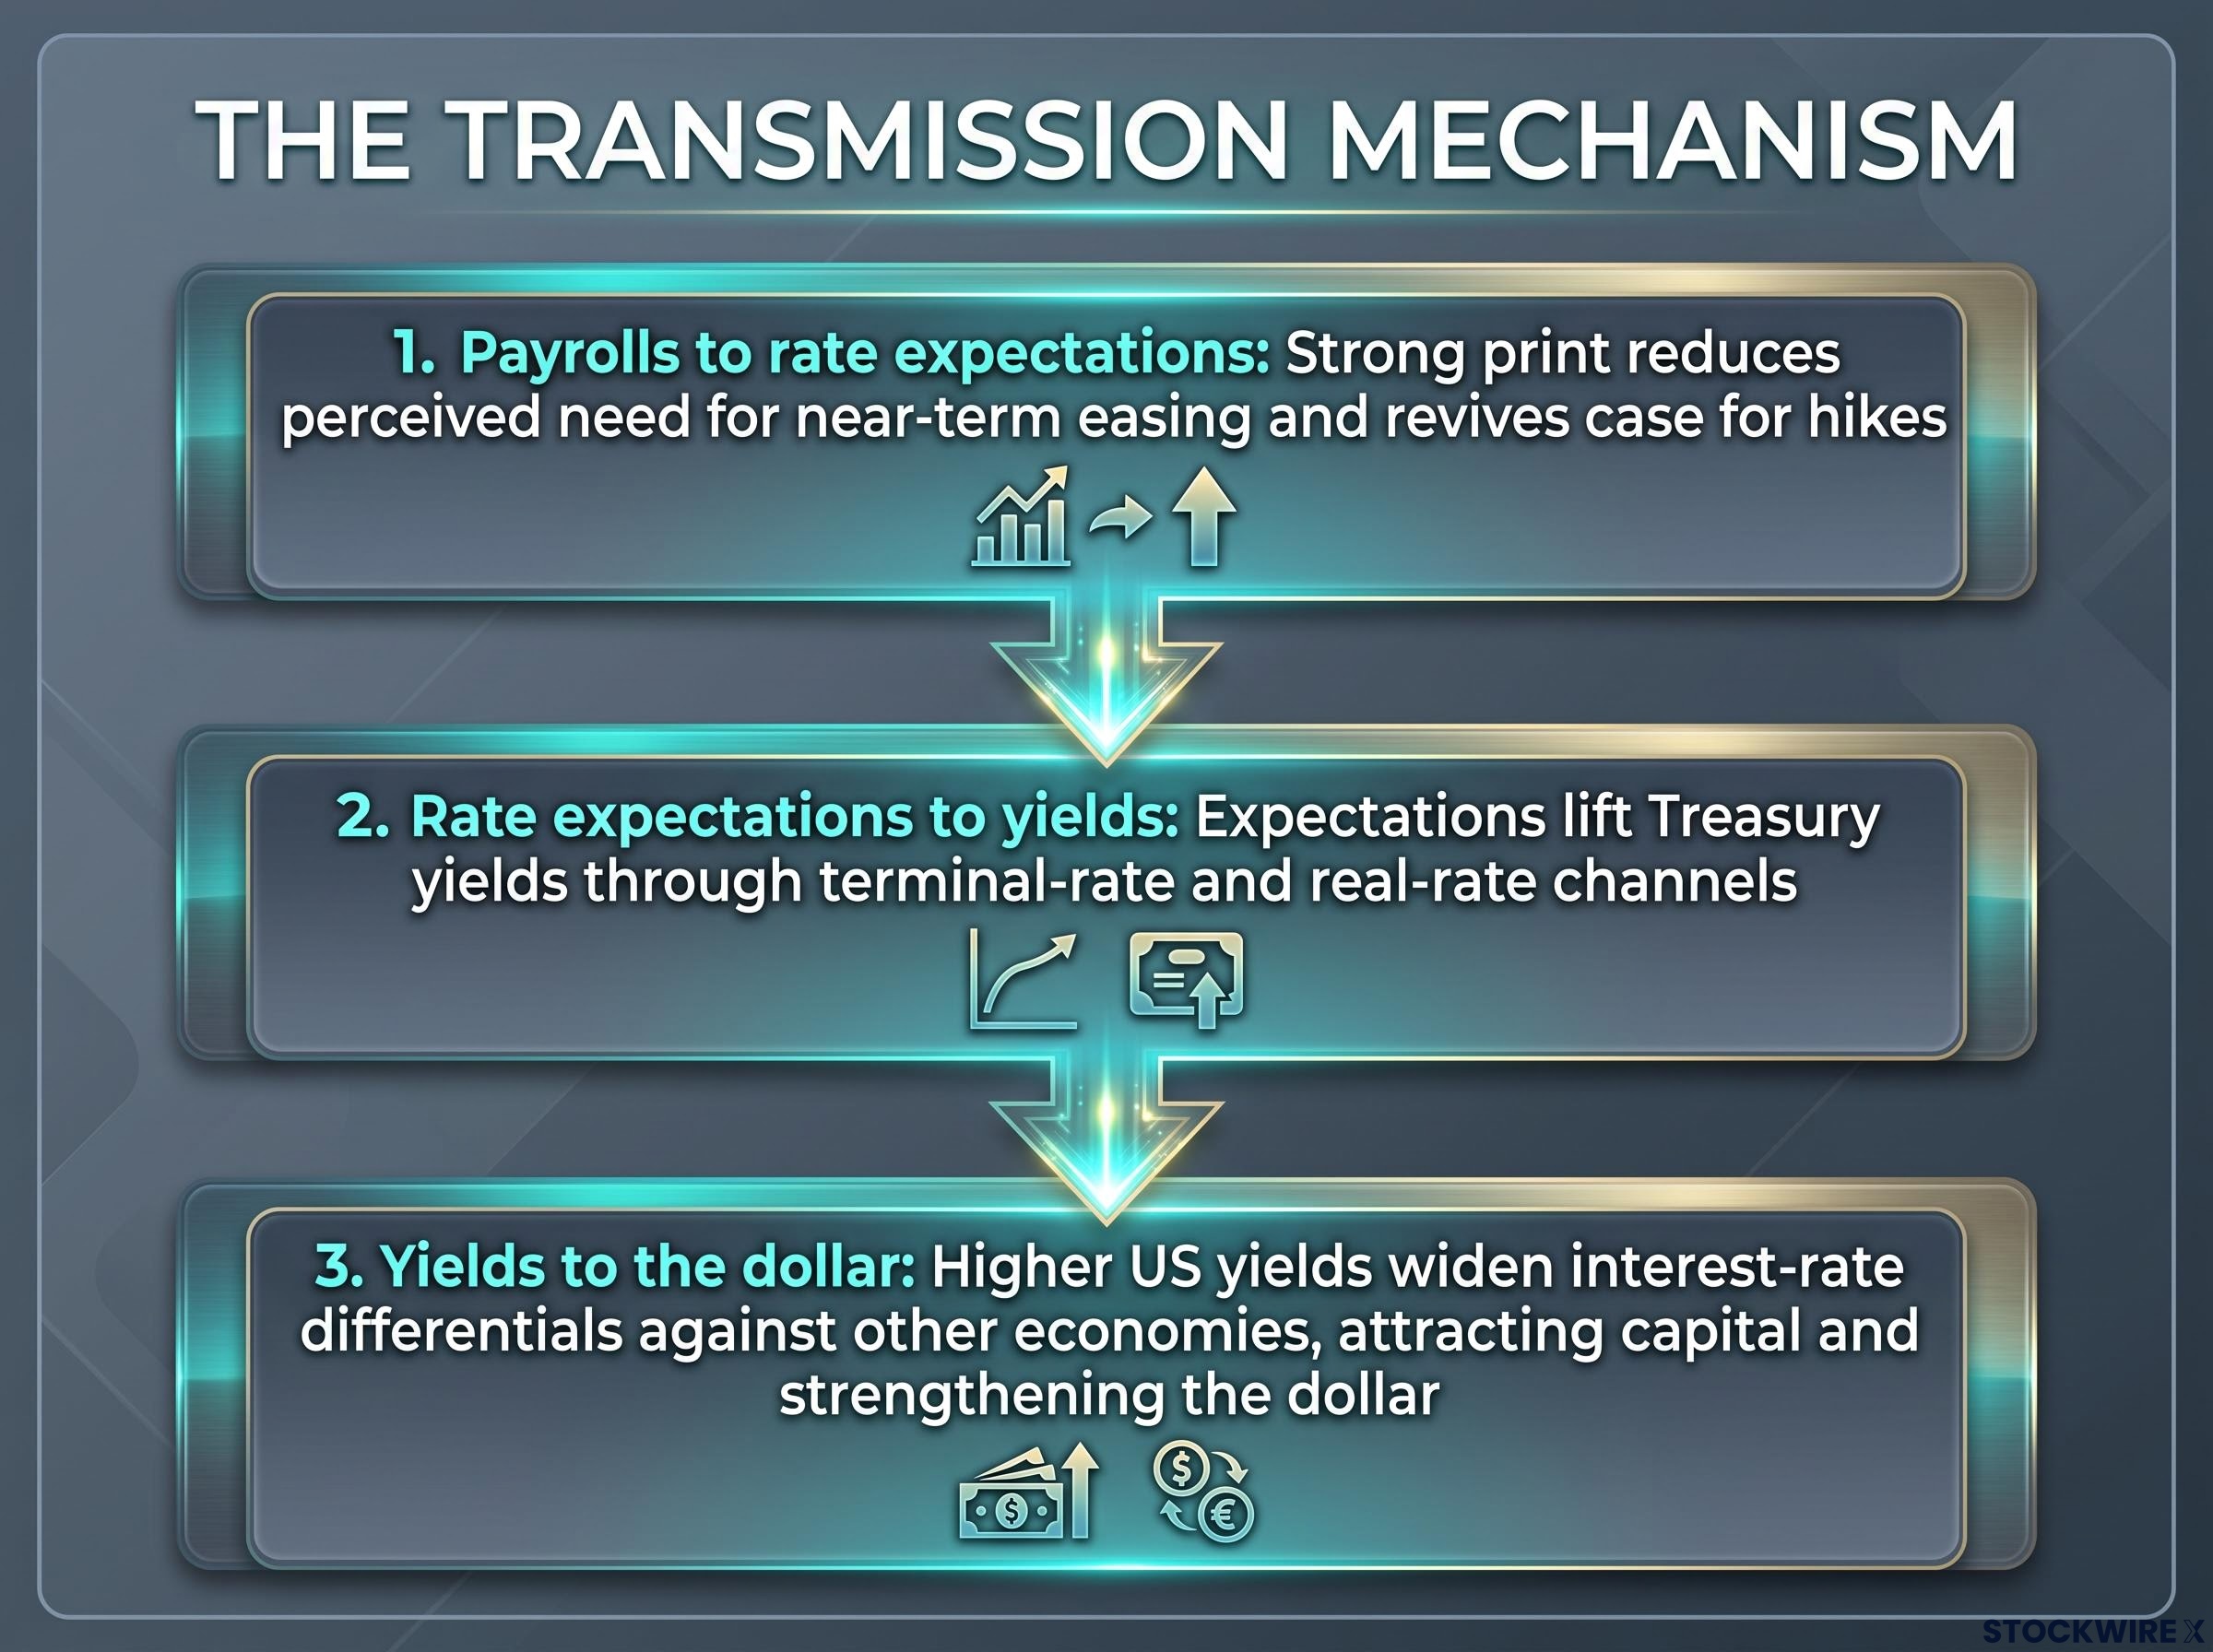
The transmission works in three steps:
- Payrolls to rate expectations. A strong jobs print reduces the perceived need for near-term easing and can revive the case for further hikes, shifting where the market expects rates to peak.
- Rate expectations to yields. Those revised expectations lift Treasury yields through the terminal-rate and real-rate channels, as investors demand more compensation for holding duration.
- Yields to the dollar. Higher US yields widen interest-rate differentials against other economies, attracting capital inflows and strengthening the dollar.
This is not theoretical. The mid-September sequence was the chain operating live: the FOMC hike, the 10-year yield closing at its highest of 2026 at 5.01%, and Bloomberg’s report that the dollar posted its biggest single-day jump since June as yields topped 5%.
Wage growth is the second-order variable that amplifies everything. If a strong payrolls figure arrives with firm wage data, it raises concerns about demand-driven inflation, prompting a larger policy and market reaction than the headline number alone would produce.
NBER research on labour market transmission examines how wage dynamics interact with monetary policy effects on employment, providing academic grounding for why wage growth functions as an amplifier in the payrolls-to-rate-decision chain rather than a simple secondary variable.
Three pressure points determine how forcefully the chain moves:
- Expected terminal rate and pace of cuts. Hawkish guidance anchors expectations that policy stays restrictive, lifting yields.
- Real wages and inflation implications. Firm wages signal persistent inflation, which magnifies the policy response.
- Risk sentiment and cross-asset flows. Rising yields pressure equities and credit while channelling flows toward US cash and duration.
One nuance worth holding. Fed Chair Warsh reportedly favours the four-week moving average of initial jobless claims as a more current labour reading. But for market impact, the monthly payrolls release remains the primary event, and OCBC strategists Sim Moh Siong and Christopher Wong frame it as the anchor for the current 70% October pricing.
What the Fed is signalling, and why 70% is already priced in
The 70% probability of an October hike, derived from OCBC strategist analysis, is not a guess. It is the market’s synthesis of Fed officials who have named their reasoning on the record.
Read together, three officials map a hawkish spectrum, from cautiously open to actively pushing for action.
- Anna Paulson, Philadelphia Fed President. Described inflation as “stubbornly elevated” and said “some modest further tightening may be warranted” if conditions evolve as expected (Reuters, 24 September 2026). Her earlier remark that there is “no clear science” on whether current policy is sufficient signals that uncertainty skews toward doing more, not less.
- John Williams, New York Fed President. Framed the yield surge as reflecting “strong economic prospects” and said another hike “seems a reasonable way of thinking” about the outlook. His language anchors the market’s 70% pricing directly in official terms.
- Beth Hammack, Cleveland Fed President. The strongest signal. She dissented from the July hold, then supported the September hike, consistently running ahead of the committee. Her remark that “it is time for the Fed to act to cool inflation” (Newsquawk, 24 September 2026) makes her a leading indicator of where the majority may move.
Williams’ framing deserves to sit on its own, because it is the sentence the market is pricing against.
“It’s likely that another rate hike may be appropriate by the end of the year,” said John Williams, New York Fed President.
The hawkish case rests on more than the cyclical picture. Hammack cited double-digit input-price inflation reported by a Northeast Ohio manufacturer, grounding a structural argument: energy-related price pressures suggest inflation is not simply a passing overshoot. Dissenters, as Continuum Economics notes, view current policy as not yet restrictive enough.
For you, this changes how to treat the 70% figure. It is a consensus reading of officials who have explained themselves publicly, which means it would take a significant payrolls miss to meaningfully dislodge it. Watch these three names after the release; their commentary will update the picture long before the next FOMC decision.
The FOMC voting structure matters when reading the hawkish signals from Hammack, Paulson, and Williams: only 12 members vote at each meeting, and a regional president’s public commentary carries a different policy weight depending on whether they hold a voting seat in the current rotation.
Beat or miss: what the September payrolls number actually controls
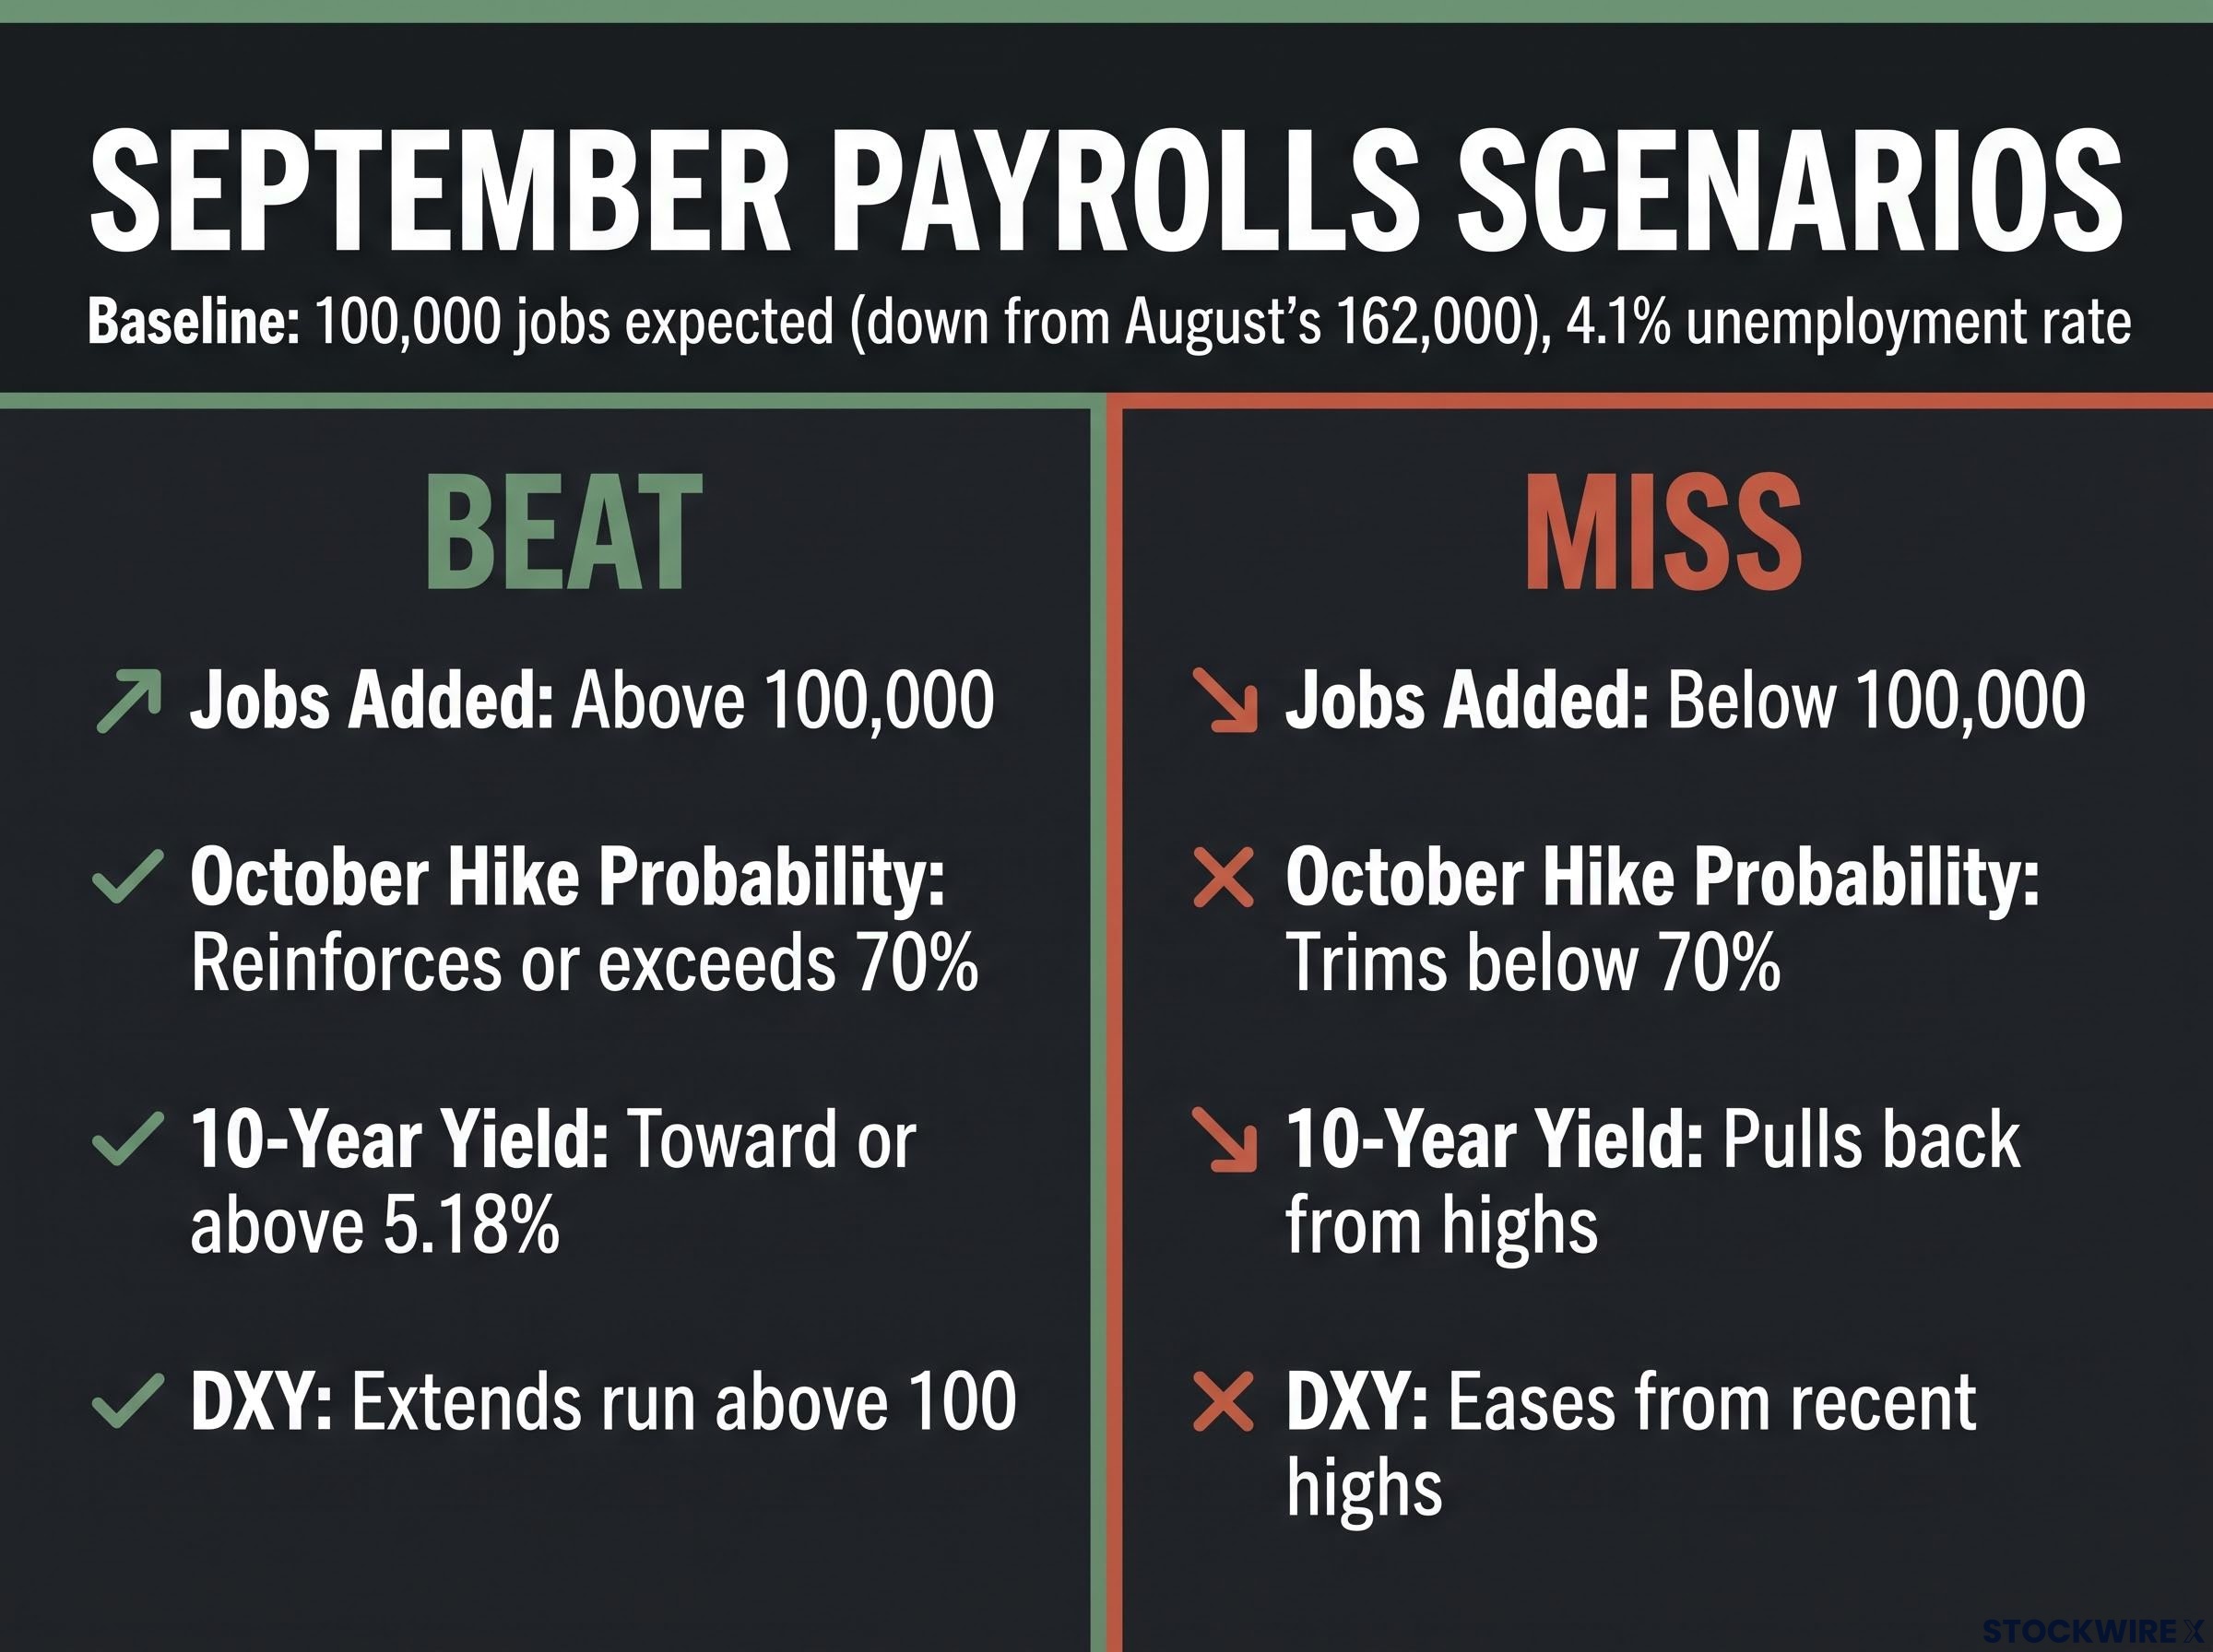
The baseline is set. Bloomberg consensus expects 100,000 jobs added in September, down from 162,000 in August, with the unemployment rate holding at 4.1%. That is the number every reaction will be measured against.
The August payrolls beat of 162,000 against a 53,000-56,000 consensus illustrates the dynamic precisely: stocks fell and Treasury yields rose roughly 8 basis points on release day, confirming that a strong print in this cycle is absorbed through a policy-tightening lens rather than a growth-optimism lens.
The risk is skewed to the upside. OCBC strategists point to a downward trend in initial jobless claims through the month, which makes a beat increasingly probable rather than merely possible. That matters, because a beat and a miss send yields and the dollar in opposite directions.
| Scenario | Jobs Added | October Hike Probability | 10-Year Yield | DXY |
|---|---|---|---|---|
| Beat (esp. with firm wages) | Above 100,000 | Reinforces or exceeds 70% | Toward or above 5.18% | Extends run above 100 |
| Miss | Below 100,000 | Trims below 70% | Pulls back from highs | Eases from recent highs |
A miss introduces uncertainty about October without necessarily signalling a full policy reversal. That distinction matters: a softer print trims the probability and cools the recent run, but the Fed’s on-record hawkish direction does not evaporate on one weak number.
Four caveats prevent any single figure from being definitive, in order of significance:
- Sizeable revisions. Payrolls data revise meaningfully around cycle turning points, so an initially strong print can be marked down in later months.
- Survey divergences. A gap between the establishment survey (payrolls) and the household survey (unemployment rate) can signal noise rather than a clear trend.
- Seasonal and one-off distortions. Weather, strikes, and policy shifts can skew month-to-month comparisons, making three-month averages more reliable.
- The Fed’s holistic reaction function. Policy weighs inflation, wages, financial conditions, and global developments alongside labour data.
Paulson’s “no clear science” language and Williams’ data-dependent framing confirm the limit. The payrolls number controls the short-term probability of an October hike and the immediate direction of yields and the dollar. It should not, on its own, override the broader pattern of Fed signals and inflation data that will ultimately set the policy path.
What the data confirms, what it cannot settle, and where to look next
Strip away the noise and the structural case holds regardless of Friday’s print. The FOMC has already hiked, three officials are on record with hawkish reasoning, and the 70% October probability reflects a policy direction rather than a single-data-point bet.
That reframes the payrolls report. It is a near-term catalyst that can accelerate or delay the trajectory, but it is unlikely to reverse it. History supports the caution: with the 10-year yield at its highest since 2007 and the 30-year near mid-2000s peaks (Mitrade; Morningstar/Dow Jones), yields at these levels tend to stay elevated until clear disinflation and slowing growth materialise, not retrace on one release.
The 6% Treasury yield scenario extends the current trajectory: if term premium normalisation adds another 80 basis points and foreign central bank demand continues retreating, the structural forces supporting higher yields do not dissipate with one softer payrolls print, which is the argument underpinning the higher-for-longer regime framing.
After the number lands, three variables deserve your attention:
- The wage growth component inside the September report itself, which determines whether a strong print carries inflationary weight.
- Fed commentary in the days that follow, especially from Hammack, Paulson, and Williams, whose language will signal the committee’s direction before the next meeting.
- The October CPI print and energy prices, which Hammack has flagged as a structural inflation driver.
Williams’ framing of elevated yields as reflecting “strong economic prospects” is the anchor here. It suggests a regime with staying power, not just a rate-cycle phase. The read for you is to build positioning around that probability rather than waiting for one jobs number to resolve it.
This article is for informational purposes only and should not be considered financial advice. Investors should conduct their own research and consult with financial professionals before making investment decisions.
Past performance does not guarantee future results. Financial projections are subject to market conditions and various risk factors, and scenario-based statements here are speculative and subject to change based on incoming data and Fed decisions.