The US jobs report should have sent the Dollar lower against the Yen. Instead, USD/JPY is pinned near 157.70, barely off Friday’s low of about 156.95. That narrow range is the story, and this USD/JPY analysis explains why.
Soft payrolls (+29,000), a jobless rate that edged up to 4.2% and weak wage growth pull one way. Wide yield gaps and safe-haven demand pull the other, while Bank of Japan (BoJ) hike bets and intervention risk sit on top.
When opposing forces cancel out, a quiet chart can be stored energy rather than calm. The next test is the Federal Open Market Committee (FOMC) Minutes on Wednesday 7 October.
Here is which forces are holding the pair in place, which levels matter, and what could break the range.
Why did a weak jobs report barely move the Dollar against the Yen?
The data was soft and the price barely flinched. The September report, released on 2 October, showed a labour market losing momentum rather than collapsing, which is how CNBC, TD Economics and Reuters all framed it.
- Nonfarm payrolls: +29,000, against a prior 12-month average of about +45,000
- Unemployment rate: 4.2%, up 0.1 percentage points
- Average hourly earnings: +0.1% month-on-month, 3.0% year-on-year
- Three-month average payroll growth: 51,000
The detail that deepens the soft-patch reading is the revisions. Together, July and August lost 60,000 jobs from earlier estimates.
The September miss follows a run of softer payroll prints, including a June report where participation fell and downward revisions pointed to a labour market cooling well before the latest release.
| Month | Revision | Revised figure |
|---|---|---|
| July | Down 31,000 | -10,000 |
| August | Down 29,000 | +133,000 |
Reuters said the outcome “almost” takes an additional Fed hike at the upcoming meeting off the table.
Reuters characterisation The data “almost” removes an additional hike at the upcoming Fed meeting from consideration.
ABN Amro said the report matched its baseline, and it considers the labour market rebound in the prior two reports to have been misleading. Soft Personal Consumption Expenditures (PCE) inflation figures were also cited as easing pressure for an October hike, though no specific PCE numbers were confirmed.
Weak wages and a rising jobless rate tell you the Fed has less reason to hike soon. A softer labour market alone does not mean a weaker Dollar, though, because the yield gap still favours it. The data trimmed Dollar upside rather than triggering a sell-off, which is why the pair stalled instead of falling.
When big ASX news breaks, our subscribers know first
How far have Fed hike bets really retreated?
October is mostly off the table. CME FedWatch puts the probability of a Fed hold that month at 77.9%.
December is another matter. Sources conflict on year-end pricing: an earlier source cited a probability above 80% for a hike by year-end, while later research offers no figure and says only that December odds “favour further policy moves later”. Treat the year-end number as unsettled.
ABN Amro’s view is that lasting price pressure from the energy shock will still lead the Fed to raise rates once more in December, so that higher costs do not feed through into household prices and pay. The hike case has been delayed, not killed.
October versus December
Two readings of the Fed path now compete:
- Overtightening risk: with payrolls near stall speed and wages up only 0.1% on the month, another hike could be a policy error.
- Sticky inflation: inflation and wage expectations may prove stubborn, so the option of a later hike should be preserved.
One weak print may also be noise. Strikes, seasonal factors and sector shifts can distort a single month, and the Fed will weigh PCE, core services and labour participation.
If you hold a view on the Dollar, the Fed path now hinges on inflation and wage data rather than this one jobs report. That makes Wednesday’s FOMC Minutes matter more than they usually would.
What is holding USD/JPY in its range: yield gaps, BoJ bets and intervention risk
Each force in this market pushes against another. Together they produce a range that looks inevitable in hindsight.
Supporting the Dollar
US 10-year Treasury yields sit well above Japanese government bond (JGB) yields, with the gap described as consistent with 300+ basis points in recent periods. Exact current yields were not confirmed. That gap supports carry trades, where investors borrow in low-yielding Yen to hold higher-yielding Dollars, and it limits downside for the pair.
Safe-haven demand adds to it. The Middle East conflict and the widening Russia-Ukraine war boost Dollar demand, though the Yen is also a safe haven, so geopolitical stress cuts both ways.
Capping the pair
Intervention risk is the first cap. As USD/JPY climbs into historically sensitive territory, traders fear sudden Ministry of Finance (MoF) selling of the pair. No 2026 intervention has been confirmed as of 5 October 2026.
- September 2022: intervention near 145.9
- October 2022: intervention near 151.9
- 2024: operations in late April to early May, and in July
The 2022 moves knocked the pair down several yen, but the effect faded as US yields stayed high.
The 2022 operations were unilateral, whereas a coordinated yen intervention in August 2026 saw Japan deploy an estimated $59 billion in a day with US participation, yet the rate differential stayed intact.
BoJ pricing is the second cap. Traders are pricing a higher chance of an October hike, although some expect the BoJ to delay; no specific odds were found. The BoJ says normalisation depends on sustained 2% inflation backed by wages, and it will proceed cautiously.
Japan also faces an import-inflation dilemma. A weak Yen lifts energy and food costs, but tightening or heavy intervention risks growth damage.
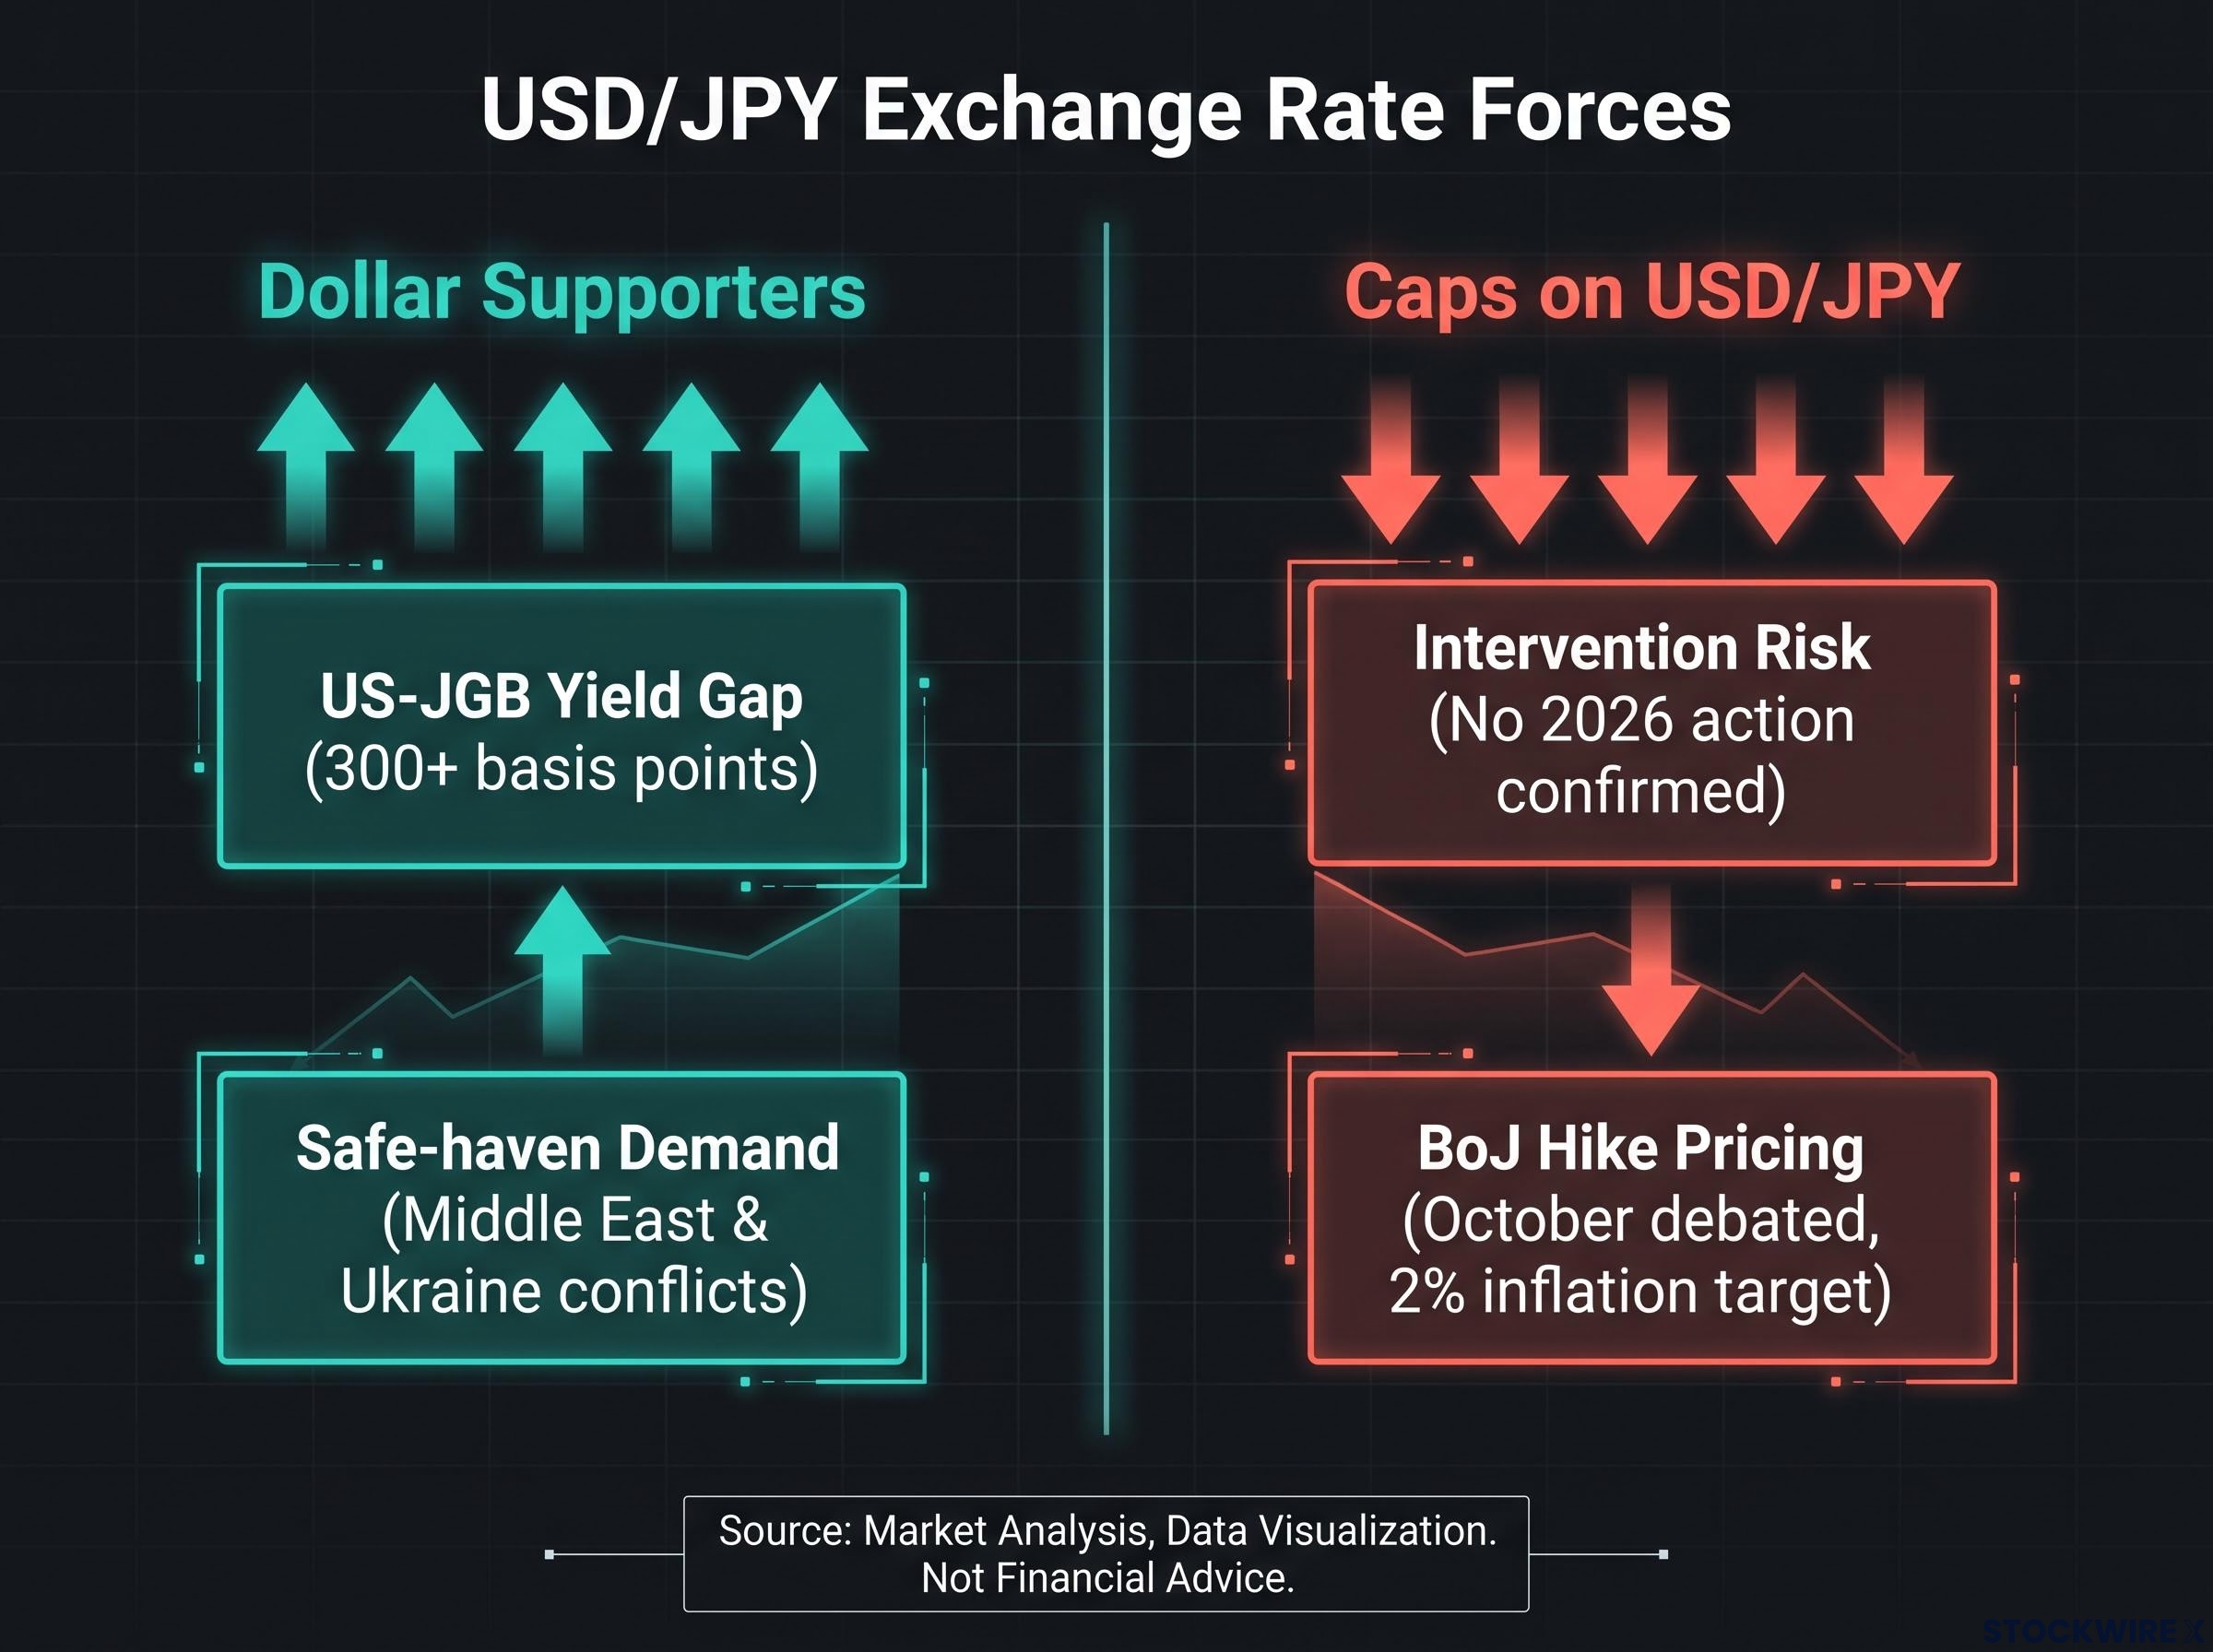
| Force | Direction | Effect on USD/JPY | Current status |
|---|---|---|---|
| US-JGB yield gap | Dollar-positive | Limits downside | Wide; exact yields unconfirmed |
| Safe-haven demand | Mixed | Supports the Dollar, but Yen also benefits | Middle East and Ukraine conflicts ongoing |
| Intervention risk | Yen-positive | Caps upside | No 2026 action confirmed |
| BoJ hike pricing | Yen-positive | Caps upside | October hike debated |
The Dollar’s yield advantage and Tokyo’s tolerance for weakness are in direct conflict here. Treat a quiet range as stored energy rather than calm.
What drives the Yen? A quick primer for reading this range
The Yen’s value rests on four drivers:
- Japan’s economy
- BoJ policy
- US-Japan yield differentials
- Risk sentiment
From 2013 to 2024, ultra-loose BoJ policy weakened the Yen. Japan held rates down while other central banks moved higher, and that policy divergence pushed money out of Yen.
The BoJ’s 2024 shift changed the picture. The end of negative interest rates and adjustments to long-term yield targets have lent the Yen some support, and they point to a policy mix less reliant on intervention alone.
Intervention, meanwhile, is a blunt tool against persistent yield gaps. Japan tends to act near perceived lines in the sand, and verbal warnings and “rate checks” (where officials quietly ask banks for quotes) often come first.
The 2022 lesson Intervention moved the price several yen, but the effect faded within weeks as US yields stayed high.
The yield gap is the engine and intervention is the brake. That explains why each Yen rally from official action has tended to fade, and it should shape how you size any bet against the Dollar.
Which USD/JPY levels and catalysts matter this week?
On the 4-hour chart, the near-term bias stays positive while the pair holds above support. The technical read comes from an AI-assisted source section, so treat these levels as reference points.
| Level or event | Value or date | Why it matters |
|---|---|---|
| Spot (5 October) | ~157.70-157.75 | Current range midpoint |
| Friday low | ~156.95 | Reaction low to the jobs report |
| Support | 156.72 (100-period SMA); 156.40-156.35 | Buyers may emerge here |
| Resistance | 158.00-158.50; 159.00 | Upside barriers |
| FOMC Minutes | Wednesday 7 October | Next policy-hint event |
Three scenarios frame the week:
- Hold: the pair stays above 156.40-156.72 and the range stays intact.
- Upside break: a move above 158.00 targets 159.00.
- Intervention drop: an abrupt official move would cause a sharp fall regardless of technicals.
Hawkish Minutes that keep a December hike alive would favour the upside scenario, while dovish tones would test support. A close above 158.00 or below 156.35 would tell you the range has resolved. Those are the levels at which to reassess a position, rather than reacting to intraday noise.
What a quiet range does and does not tell you before Wednesday
Soft data has delayed the Fed hike case, not removed it. Yield gaps and safe-haven flows support the Dollar, while intervention risk and BoJ bets cap it.
Three variables decide what happens next: the tone of the FOMC Minutes, any BoJ signalling on an October move, and any MoF verbal warnings or rate checks. A shift in any of them is more likely to end the range than another day of sideways trading.
The decision for you is whether your view depends on the range holding or breaking, and whether you are prepared to act at the levels above.
This article is for informational purposes only and should not be considered financial advice. Investors should conduct their own research and consult with financial professionals before making investment decisions. Financial projections are subject to market conditions and various risk factors, and these statements are speculative and subject to change based on market developments.
—