A fund advertising a yield near 27% sounds like a straightforward promise: buy the units, collect the income, repeat. The reality is stranger and more interesting than that. That headline number is not a fixed payment at all. It is rebuilt from scratch every single month out of option premiums that can climb, collapse, or behave in ways that depend entirely on what the market is doing that particular week.
If you arrived here assuming a high-yield covered call ETF pays out something like a dividend cheque, that assumption is the first thing worth dismantling. These products are widely bought and frequently misunderstood, and the gap between the two is where investors get caught out.
Harvest’s High Income Shares suite makes an unusually good teaching case, not because it is being reviewed here but because Harvest publishes genuinely granular detail about how its writing levels, coverage ratios, and strike prices are set. That transparency lets you see the machinery that most funds keep hidden.
This is a mechanics explainer built around a live example. After reading it, you will know exactly what determines whether your monthly distribution rises, holds flat, or gets cut, and why the same mechanics that generate the income also build in the variability.
What actually happens when a covered call fund writes options
The signal you notice is a high monthly distribution landing in your account. What you do not see is the chain of events that produced it, and that chain is the entire point.
A covered call writing strategy involves selling someone else the right, but not the obligation, to buy a stock the fund already owns, at a specified price, within a set window of time. In exchange, the fund collects an upfront payment called a premium from the option buyer. That premium is cash in hand the moment the option is written.
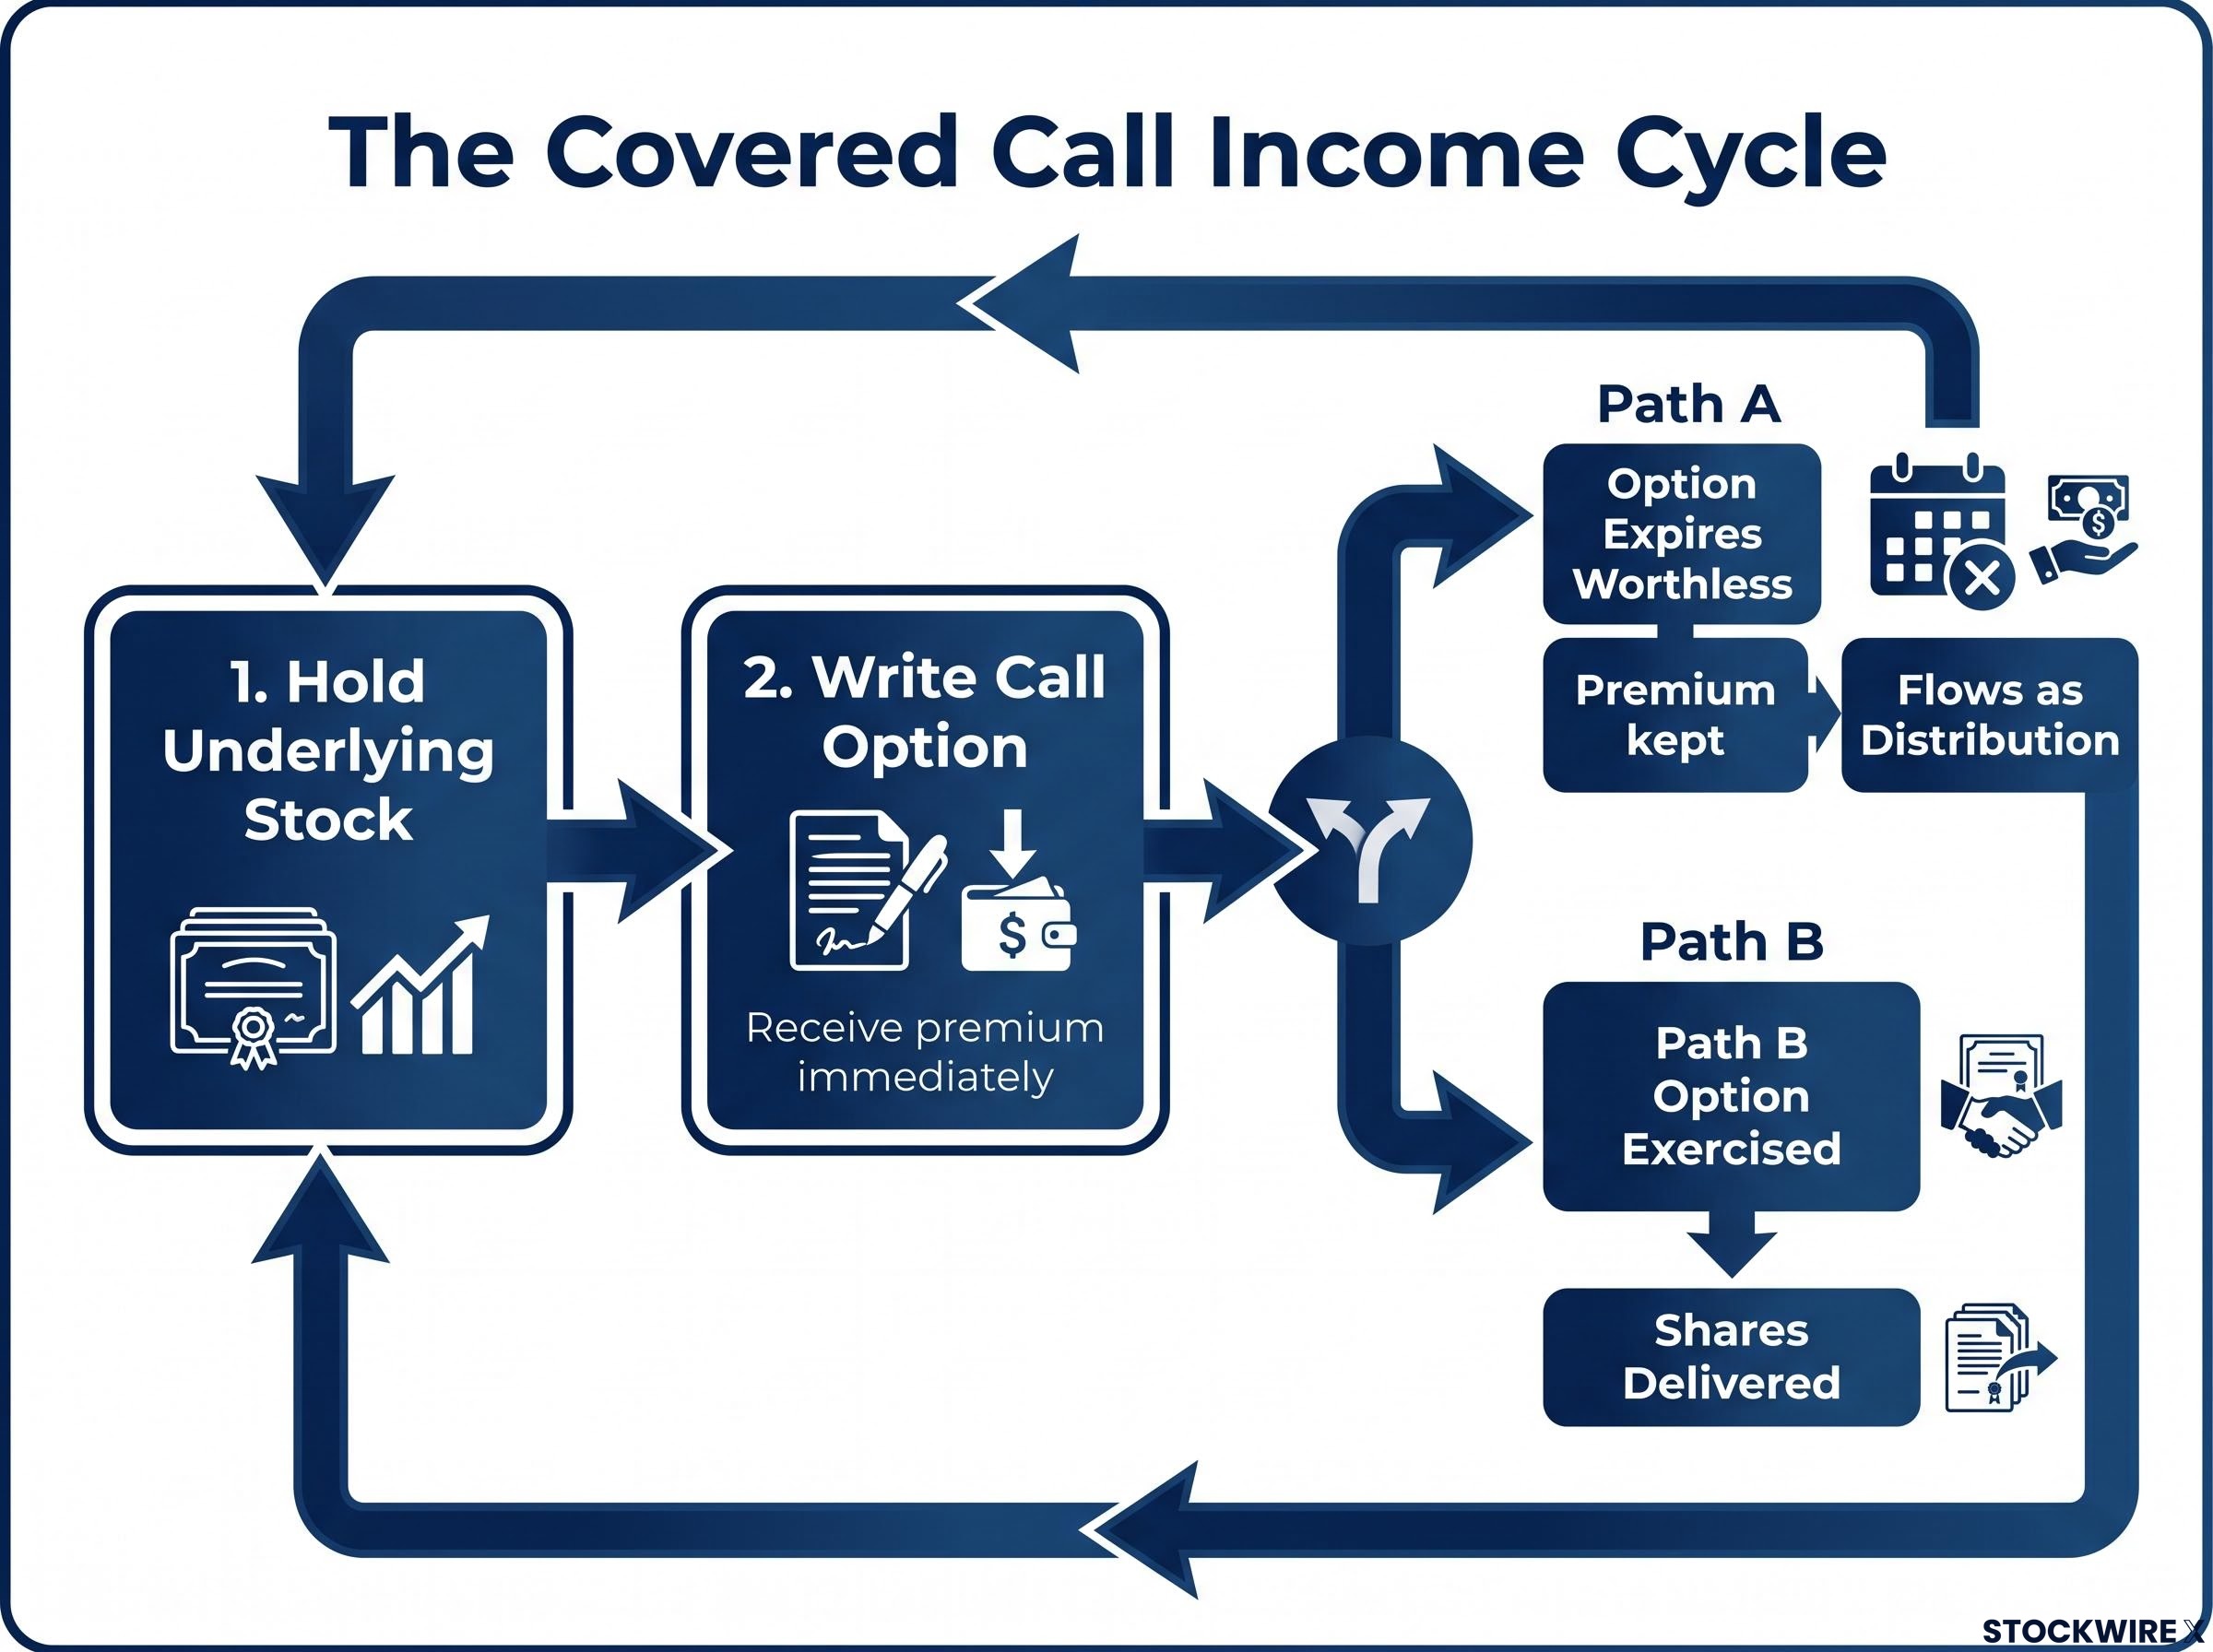
Here is the cycle that generates your income:
- The fund holds the underlying stock outright.
- The fund writes a call option against that holding and receives the premium immediately.
- The option either expires worthless, because the stock never reached the agreed strike price, or it gets exercised. When it expires worthless, the fund keeps the premium, writes again, and the captured premium flows through to you as distribution.
The word “covered” matters here. Because the fund already owns the shares, it can deliver them if the option is exercised. This is what separates the strategy from the far riskier act of selling calls on stock you do not own.
One detail sharpens the picture. Harvest’s High Income Shares funds write options on individual stock positions rather than on a basket index, which concentrates both the premium income and the risk in specific names rather than spreading it across a diversified pool.
Coverage ratio: roughly 25% to 40% Harvest writes calls against approximately 33% of each position as its baseline, flexing between about 25% and 40% depending on market conditions. The range reflects how much premium the market is offering at any given moment, and how much future upside the manager is willing to sell to capture it.
Why the coverage ratio is a strategic variable, not a fixed setting
That 33% baseline is not arbitrary. It is a calibrated decision about how much upside participation to sell away, and every percentage point of coverage above that baseline is a trade against future capital appreciation in exchange for income today.
Coverage can be nudged higher during stretches without upcoming earnings releases, since those events spike option volatility and premiums, and pulled back when the premium environment does not justify selling more upside. The strikes themselves typically sit around 1.5% to 2% out of the money, occasionally wider at 5% or more.
The adjustment range is deliberately narrow. That design keeps the strategy recognisably the same thing across market conditions rather than mutating into something qualitatively different month to month.
When big ASX news breaks, our subscribers know first
Why covered call income and dividend income are not the same thing
Here is where the brokerage statement becomes misleading. A number arrives, looks like reliable income, and feels interchangeable with a dividend. Structurally, it is nothing of the sort, and the difference reaches into both your tax bill and the stability you may be quietly assuming.
For Canadian-listed ETFs, including those from Harvest, distributions are reported on T3 slips that split each payment into components: eligible Canadian dividends, capital gains, foreign income, and return of capital (ROC). You cannot tell which category any individual monthly payment belongs to at the moment you receive it. The breakdown is determined at year-end, not per payment.
Return of capital deserves plain language. ROC is not income the fund earned. It is a partial return of your own invested money, which reduces the adjusted cost base (ACB) of your units. ACB is simply the amount you are treated as having paid for your units for tax purposes. ROC defers tax rather than eliminating it.
The adjusted cost base calculation becomes more complicated as ROC accumulates over multiple years, because each ROC payment reduces the base by a different amount depending on the fund’s year-end distribution breakdown, and the cumulative effect only becomes visible when units are eventually sold.
The mechanics tie directly back to option outcomes. If written calls expire worthless and the fund does not sell its holdings, premiums may flow out as ROC. If options are exercised and the manager buys back positions without crystallising capital gains, those distributions can also land as ROC.
| Distribution component | What it means in plain language | General tax treatment |
|---|---|---|
| Eligible dividends | Dividend income the fund received from Canadian companies it holds | Favourable treatment for Canadian investors relative to foreign income |
| Capital gains | Realised profit from selling holdings or from option premium treated as gains | Only a portion is taxable |
| Return of capital (ROC) | A partial return of your own invested money, not income earned by the fund | Not taxed when received; reduces your ACB and defers tax |
RBC’s documentation on covered call ETFs puts the principle bluntly: distributions exceeding a fund’s interest, dividends, and realised capital gains are treated as return of capital. Global X Canada’s own explainer goes further, warning that much of the apparent income from covered call ETFs can in fact be ROC.
The disclosure that matters Issuers including RBC state plainly that distributions are not guaranteed and that the tax character of your distributions is determined at year-end, not at the time of each payment. Your official breakdown arrives on a year-end statement, not with every monthly cheque.
So that 0.27 CAD per unit arriving each month may be part dividend income, part realised premium, and part a return of your own capital. The fact that all three show up as a single number in the same transfer hides a distinction that materially shapes your long-term after-tax outcome. And if your ACB is eventually ground down to zero, future ROC starts being taxed as capital gains.
What makes distributions rise, fall, or stay flat from month to month
Distribution changes can feel random until you see the system behind them. They are not random. They are the output of identifiable inputs, and once you know the inputs, you can monitor them.
The single largest driver of distribution size is implied volatility in the underlying stocks. Implied volatility is the market’s expectation of how much a stock’s price will swing. When it rises, option buyers pay more premium for the same strike price and coverage ratio, and that higher premium flows straight through to your income.
Three forces set the premium level:
- Implied volatility in the underlying stock
- Proximity of an earnings event, which inflates uncertainty and therefore premium
- The coverage ratio and strike price decisions the manager makes
Earnings season is the recurring volatility event to watch. Options written ahead of an earnings announcement usually command fatter premiums because nobody knows the result yet, and that uncertainty pumps up implied volatility. Once the result lands, implied volatility collapses regardless of whether the news was good or bad.
The Nasdaq analysis of covered call income drivers identifies implied volatility, strike selection, and option tenor as the three interlocking variables that determine how much premium a fund actually collects in any given writing cycle, reinforcing why no two months produce identical income.
This is why a distribution increase should be read carefully. When a fund raises its payout, that is not management deciding to be generous. It reflects a market environment generating richer option premiums, and the same logic runs in reverse when distributions are cut.
The real-world pattern bears this out. Harvest has observed distribution increases on names such as Palantir and AMD, while Tesla has seen distribution reductions, each consistent with the premium environment surrounding that particular stock.
The yield figure is mechanically sensitive Current yield is calculated as the most recent monthly distribution multiplied by 12, divided by the ETF’s market price. That construction means any change in the distribution, or even a move in the unit price, swings the headline figure immediately. It is not guaranteed forward income.
Harvest also publishes monthly option writing levels for each holding in its fund brochure and newsletter. That gives you a forward-looking window into the premium environment rather than leaving you to guess after the fact.
Single-stock versus basket: why concentration sharpens both upside and downside
A basket covered call ETF, such as RBC’s Canadian Dividend Covered Call ETF (RCDC), writes calls across a diversified portfolio. A weak premium environment for one stock gets partly offset by stronger premiums elsewhere, smoothing both the net asset value and the income.
A single-stock structure has no such buffer. When one name’s premium environment deteriorates, there is nothing to cushion it, which is precisely why these funds show more distribution variability.
Concentration cuts the other way too. A large post-earnings price gap in a single-stock fund makes call exercise and buy-backs more likely, which raises the probability of ROC-classified distributions and reduces realised gains relative to the size of the move.
The income and growth trade-off every covered call investor faces
Now that the mechanics are clear, the structural choice underneath them comes into focus. Buying a covered call fund is not a comfortable accommodation between income and growth. It is a genuine trade, and understanding it is the difference between a conscious decision and an accidental one.
The cap sits on your upside. When a written call is exercised because the stock has risen above the strike price, the fund participates in that gain only up to the strike. Everything above the strike is forfeited, and the premium you collected is the compensation for giving it up.
In a strong bull market, that cost compounds. Systematically selling call options on high-growth names means the fund will repeatedly capture less than the full appreciation of its underlying positions. The stronger those stocks run, the more upside the writing strategy leaves on the table.
The upside cap in a bull market produces a compounding drag that benchmark comparisons make concrete: Global X’s Nasdaq-100 covered call fund returned 5.2% in 2023 while the Nasdaq-100 gained 35%, a gap of nearly 30 percentage points from a single year of strong equity performance.
There is a rational case for accepting this. For income-oriented investors who value predictable monthly cash flow over maximum total return, the premium income can be a sensible exchange, particularly if you are in a drawdown or distribution phase of life rather than still accumulating.
Harvest positions the suite exactly this way:
Harvest’s own framing The High Income Shares strategy is presented as a high-yield US equity approach that prioritises cash flow over full participation in stock price appreciation. Management has stated it will maintain the high-growth mandate even during downturns, on the reasoning that changing it would alter the nature of what investors bought in the first place.
Here is the distinction that matters. RBC’s documentation warns that distribution yields should not be confused with a fund’s rate of return, performance, or yield in the conventional sense. A high payout tells you nothing about total return.
So who is this actually for?
- Suited: income-phase investors, retirees prioritising cash flow, and those who want high monthly distributions from equity exposure
- Less suited: investors still in the accumulation phase seeking maximum capital growth from high-growth names
An investor holding a high-growth covered call fund through a sustained bull market is not necessarily making a mistake. But the choice should be deliberate: you are selecting income now over capital appreciation later, and the size of that trade scales directly with how strongly the underlying stocks perform.
Making sense of the yield figure before you buy
Everything so far converts into a short list of questions. Treat them as the natural endpoint of understanding the mechanics, not as a disclaimer to skim past.
Start with how the yield figure is built. Current yield is the most recent distribution multiplied by 12, divided by the market price. Because both inputs move, the same fund can display dramatically different yields across months, and a falling unit price mechanically inflates the percentage even when your actual income has not improved.
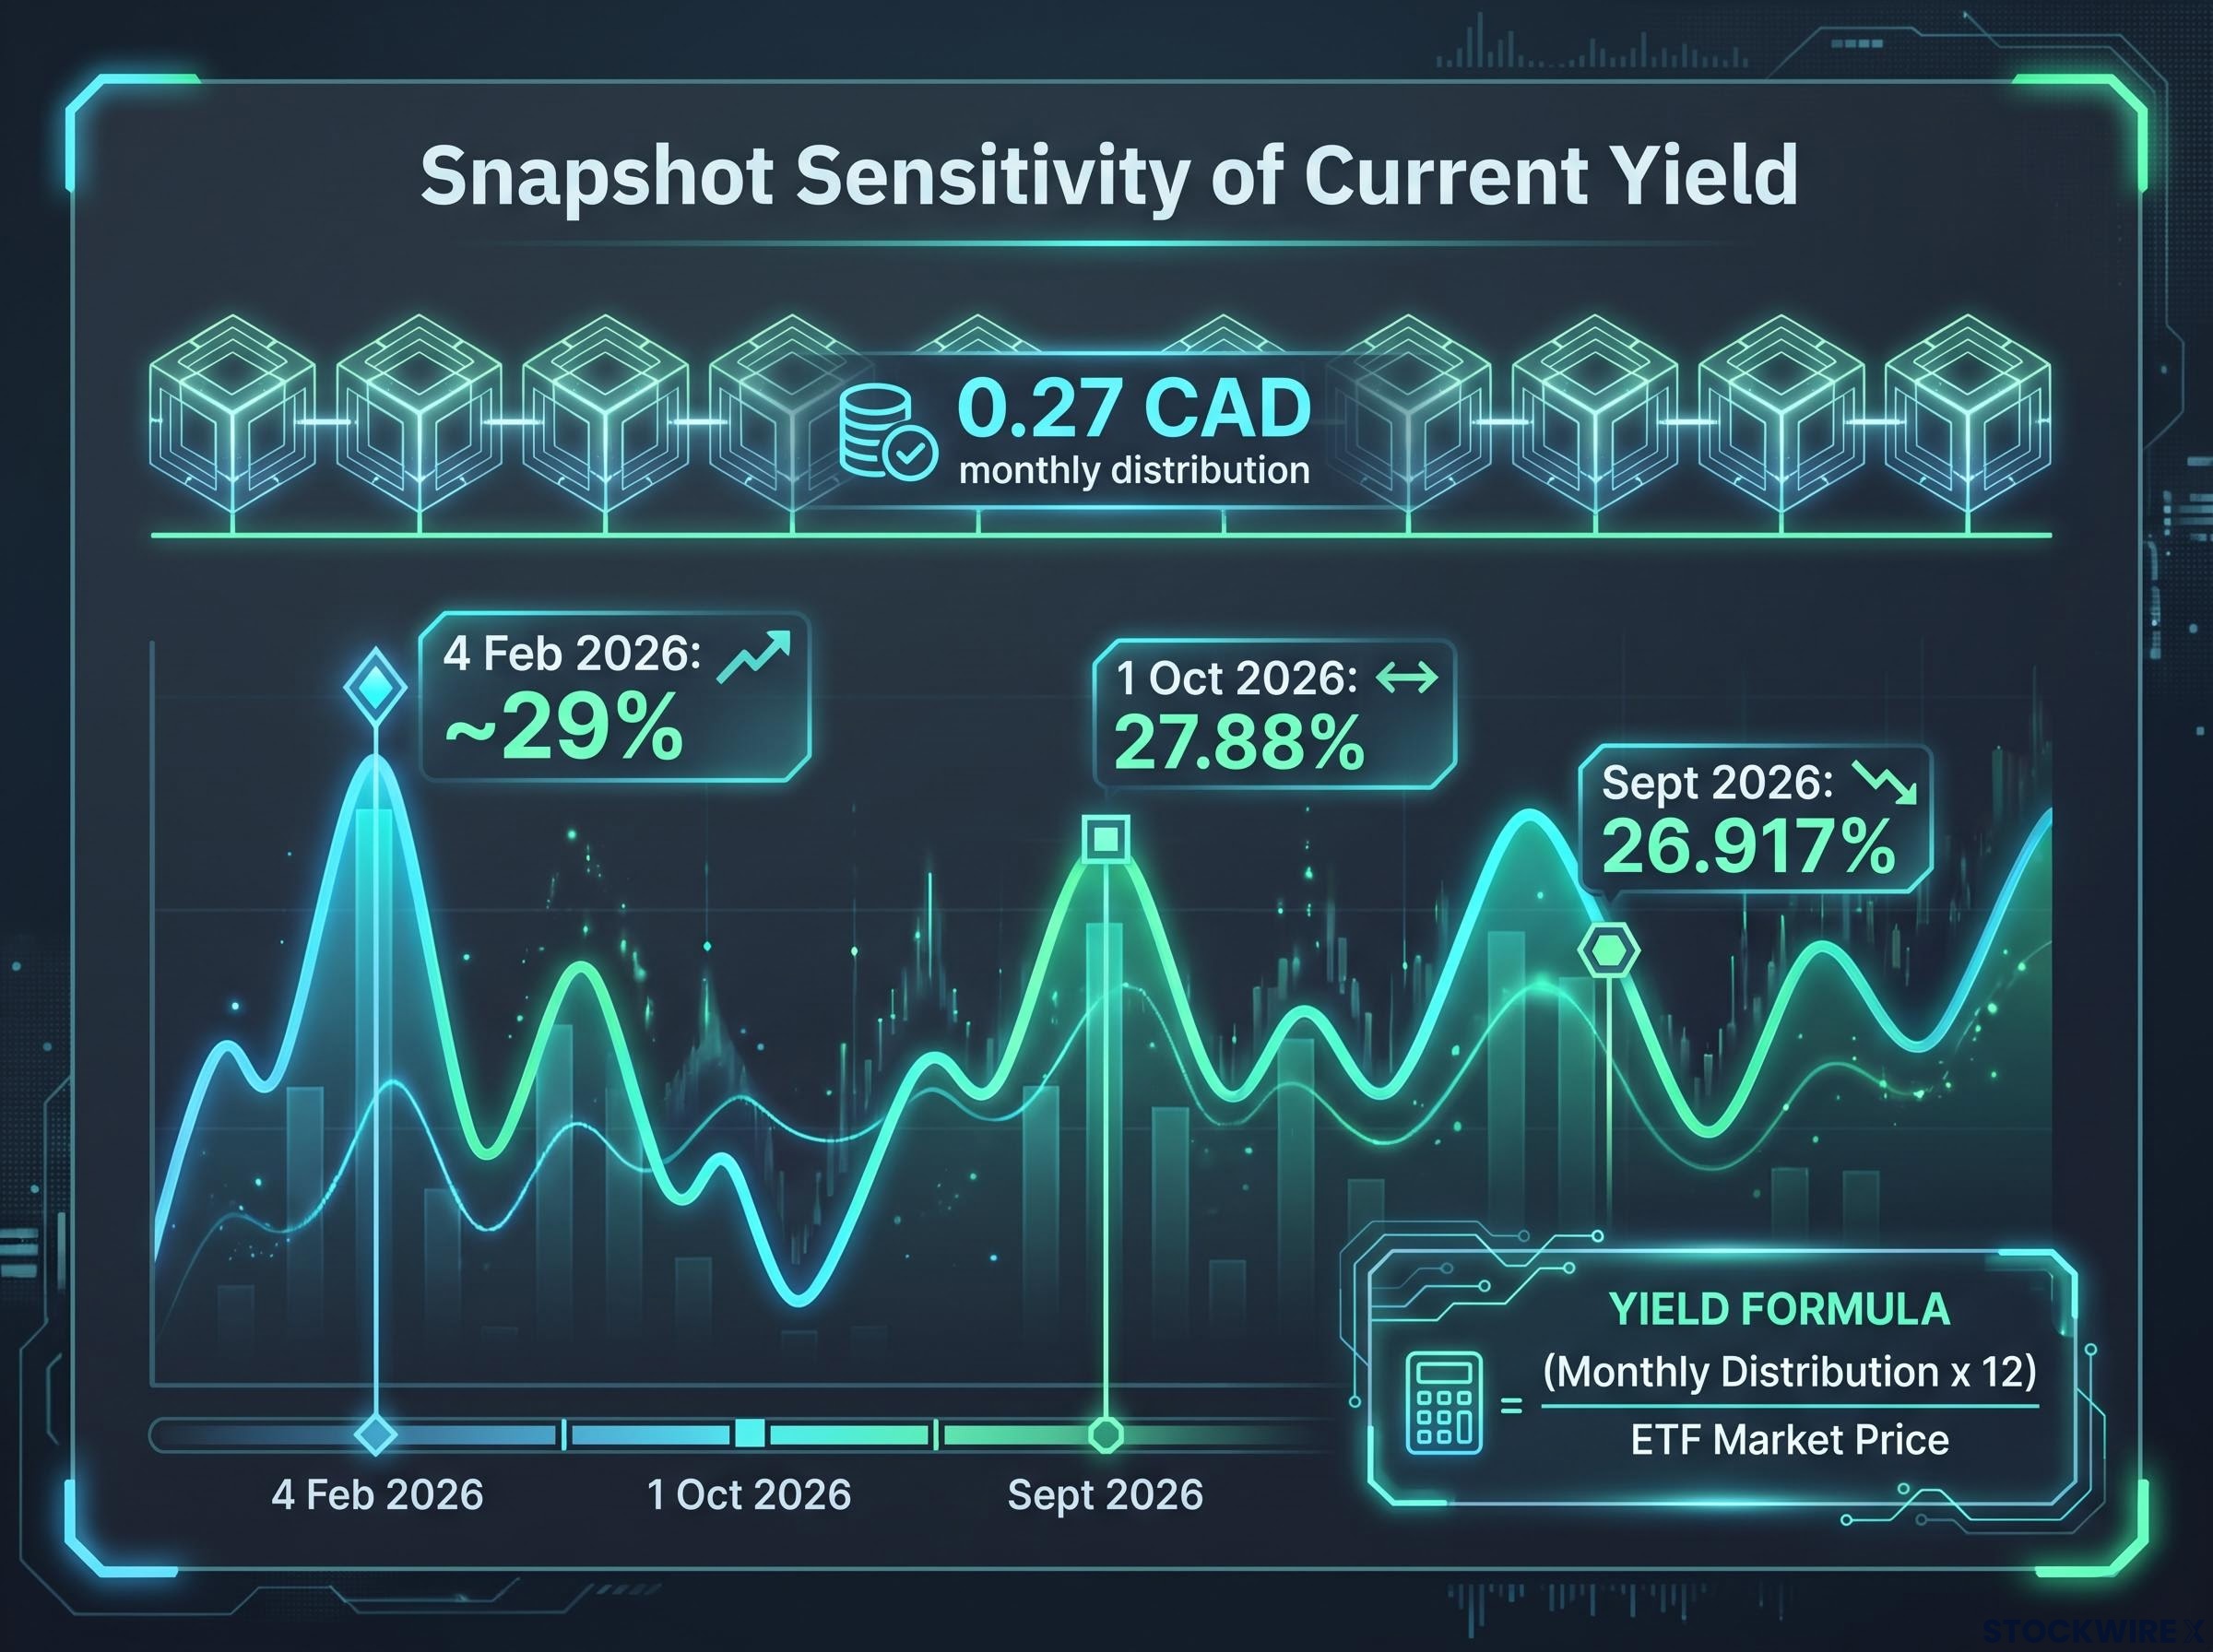
The numbers make this concrete. Harvest’s HHIS began distributing 0.25 CAD per unit in February 2025, lifted to 0.26 CAD in October 2025, and to 0.27 CAD in November 2025, where it has held through to September 2026. Yet the reported current yield wandered across that period purely on price movement.
| Snapshot date | Monthly distribution | Current yield shown |
|---|---|---|
| 4 February 2026 | 0.27 CAD | ~29% |
| 1 October 2026 | 0.27 CAD | 27.88% |
| September 2026 (TMX trailing) | 0.27 CAD | 26.917% |
Same distribution, three different yields. That spread from roughly 26.9% to 29% is not a discrepancy to wave away. It is a demonstration of exactly how snapshot-sensitive the metric is, which is why Harvest itself cautions that the current yield figure does not represent historical returns or guaranteed future distributions.
Distribution timing and ex-date mechanics add a further layer of complexity: the unit price typically drops on the ex-distribution date by approximately the distribution amount, meaning the monthly cheque does not represent a net gain to holders who buy just before the date and sell just after.
Three misunderstandings trip people up most often: treating the current yield as a guaranteed rate, conflating premium income with dividend income, and ignoring the capital-base erosion that ROC-heavy distributions can cause.
Before buying, work through four questions:
- What is the distribution history, and has it been stable or volatile?
- What proportion of past distributions has been return of capital versus realised income?
- What is the coverage ratio and strike price strategy, and does the manager publish it?
- Does your investment timeline suit prioritising income over capital growth?
A declining unit price that inflates the headline yield is not an improving income outlook. Once you internalise how the figure is constructed, distribution changes stop surprising you.
What the mechanics tell you about where this strategy fits
Pull the threads together and the placement decision makes itself. The point is not a recommendation. It is a framework that makes the right answer for your own situation visible from the variables you now understand.
Carry these four realities forward as a checklist for evaluating any covered call fund, not just Harvest’s:
For readers wanting to understand how the choice between equity-linked note structures and FLEX options structures affects after-tax outcomes, our dedicated guide to covered call ETF structural differences covers the specific tax treatment each architecture produces and what it means for taxable-account investors.
- Distributions are option-premium-driven and therefore variable
- Tax character is determined annually and may include substantial return of capital
- Upside participation is capped by the writing strategy
- Yield figures are snapshots, sensitive to both distribution changes and unit price moves
A covered call writing strategy is a tool with a specific, rational use case. It is neither universally beneficial nor universally flawed. Income-phase investors have legitimate reasons to accept its trade-offs, and growth-focused investors have equally legitimate reasons to look elsewhere.
The scale here is real. HHIS holds roughly 2.085 billion CAD in assets, which means the misunderstandings covered in this piece play out across a large base of actual investors. For those wanting a gentler profile, Harvest also runs lower-volatility alternatives, including a Canadian equity fund offering around 6% yield across 30 dividend-paying stocks, which sits at the opposite end of the yield-versus-stability spectrum.
The investor who understands these mechanics stands in a fundamentally different position from one who does not. You can assess distribution changes in context, read coverage ratio disclosures, and position the strategy correctly inside a broader portfolio rather than treating its yield as an isolated headline. The complexity is manageable once the mechanics are clear, and the investors most likely to be disappointed are those who bought on the yield figure alone without understanding what produces it or what it costs them.
This article is for informational purposes only and should not be considered financial advice. Investors should conduct their own research and consult with financial professionals before making investment decisions. Past performance does not guarantee future results. Financial projections are subject to market conditions and various risk factors.