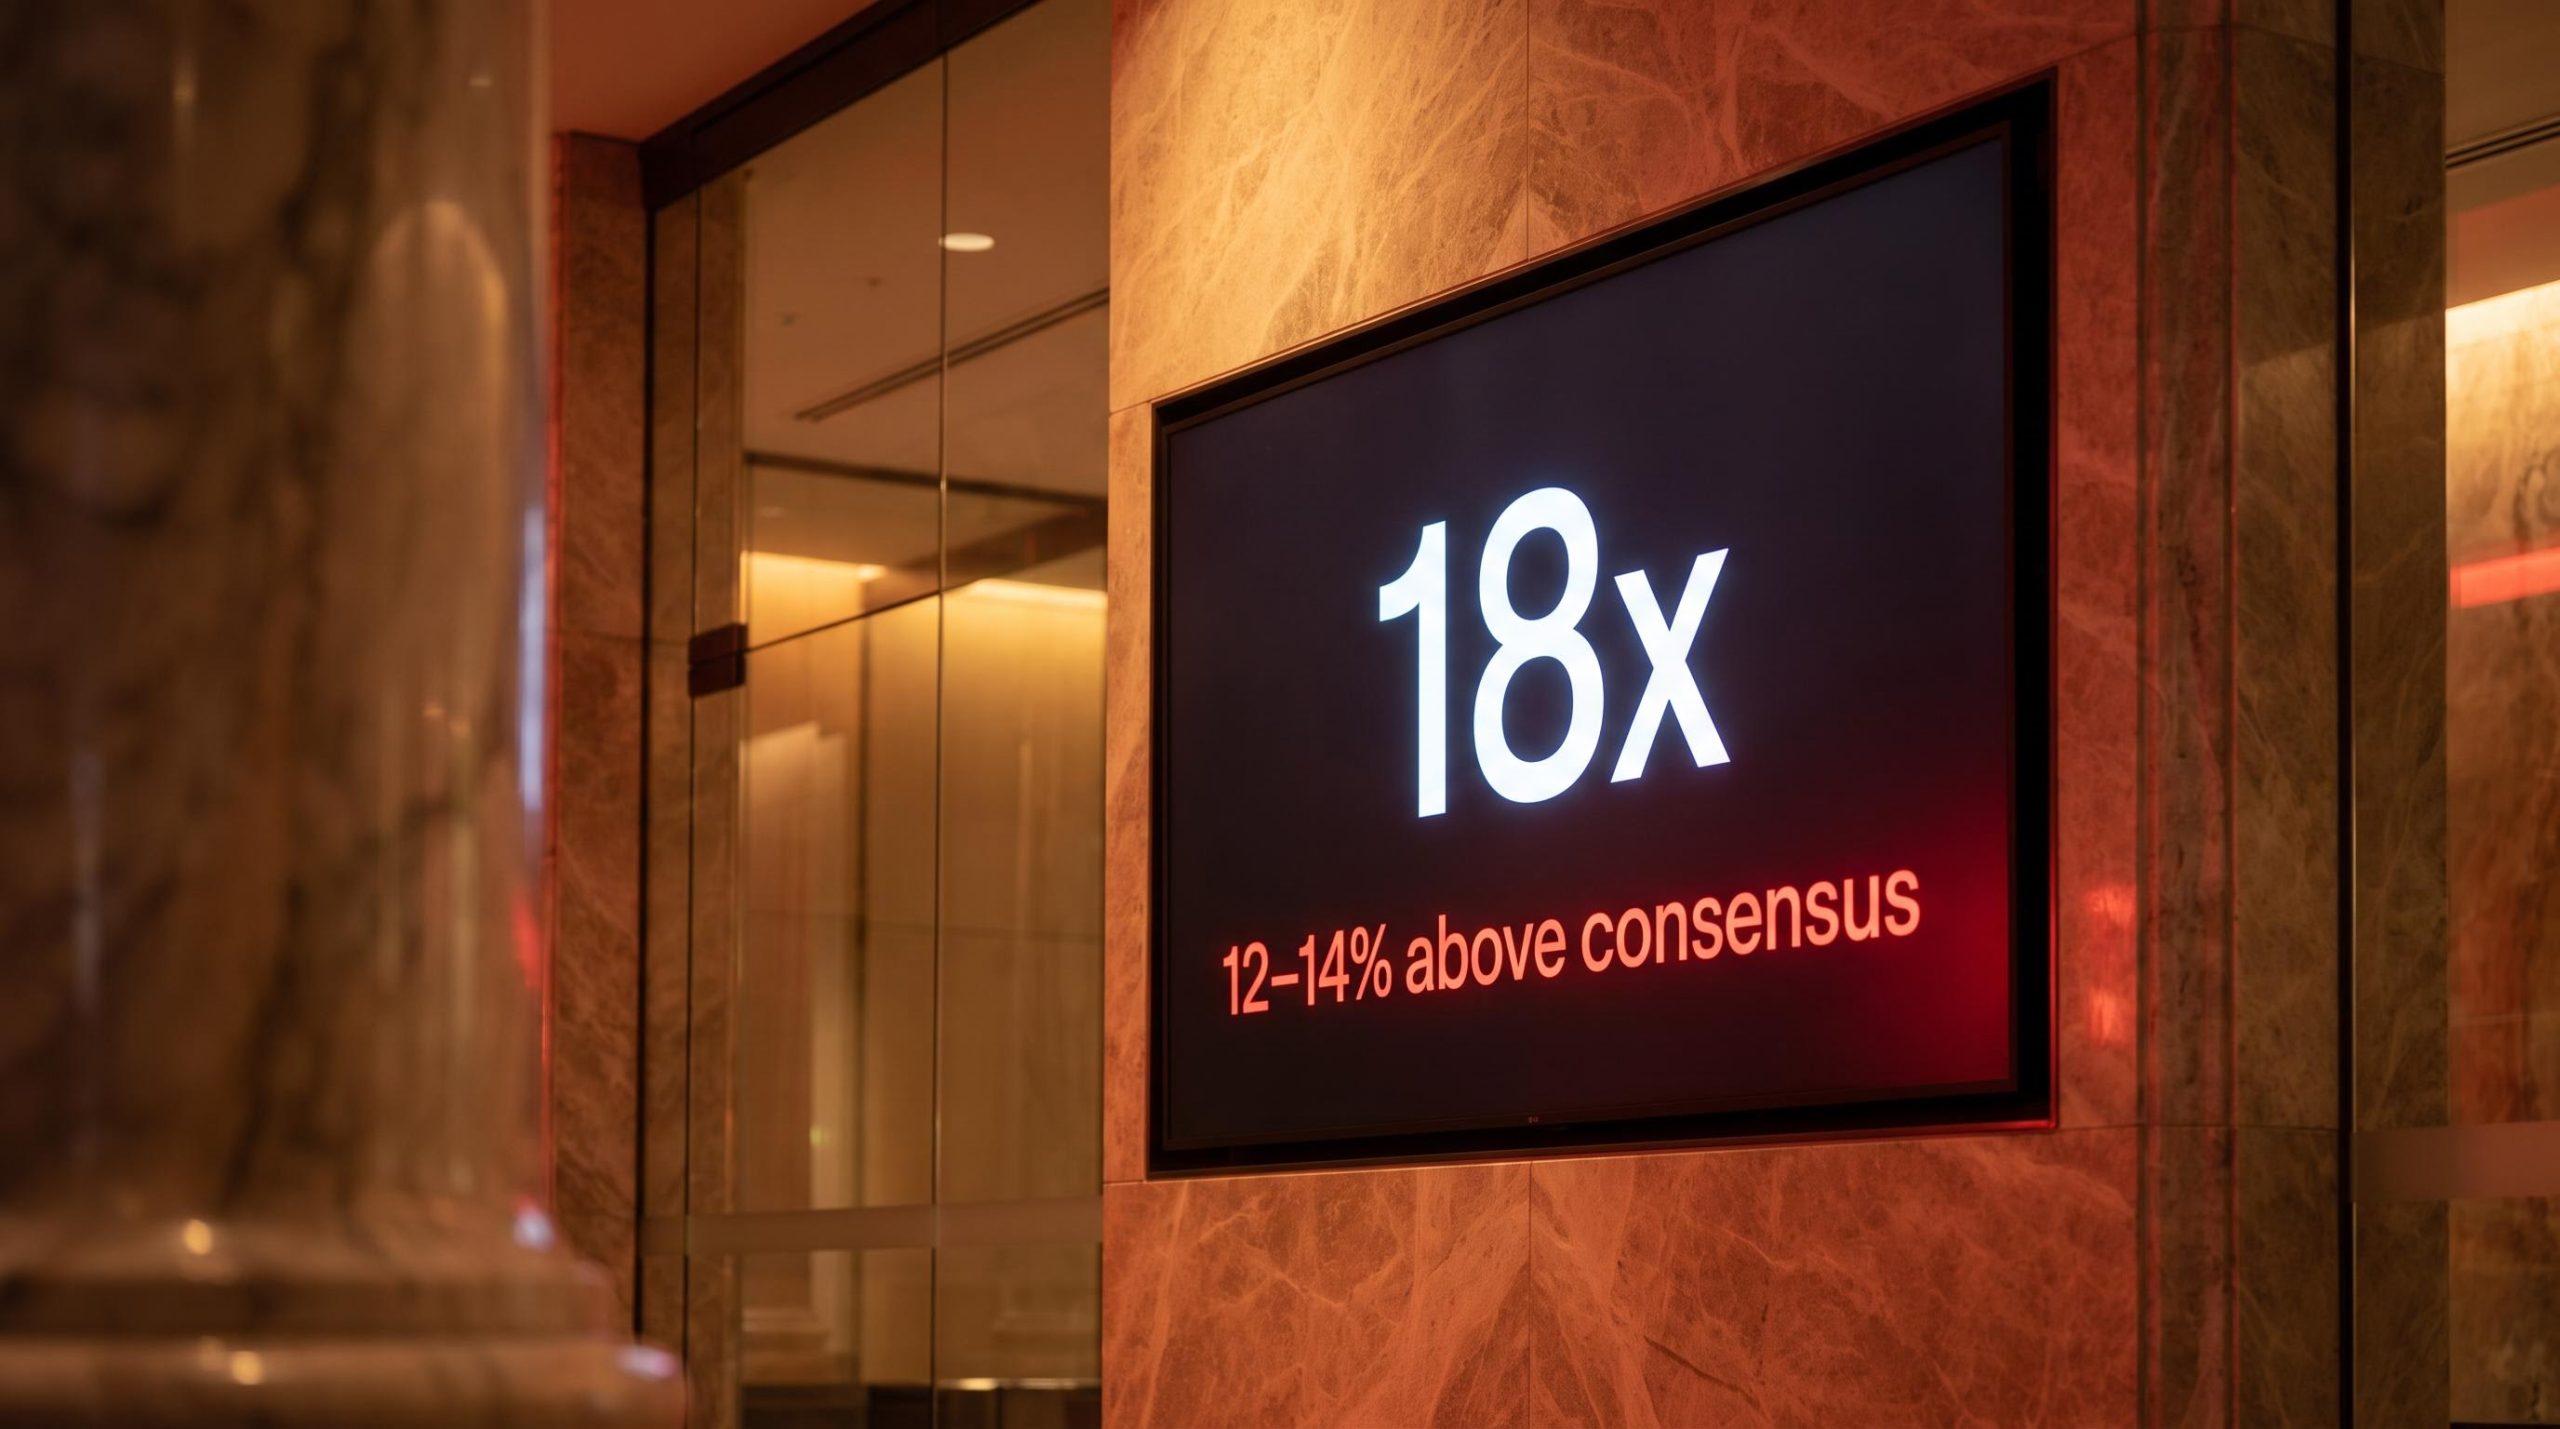
The Big Four Australian banks are trading at roughly 18x earnings. Morgan Stanley thinks the market has the risk wrong by a wide margin, forecasting FY2027 impairment charges that could land 12-14% above what consensus is currently pricing in.
That gap between the price and the risk is the story. After two years in which a brutal tightening cycle produced almost no bank losses, the RBA’s September 2026 rate rise to 4.60% has pulled an old question back onto the table: are the banks entering a genuine loan loss cycle, or will the same buffers that held last time hold again?
Morgan Stanley says the buffers are gone and the market has not noticed. The RBA, in its October 2026 Financial Stability Review, says banks remain resilient even under a severe stress scenario. This piece lays out both sides in full, with the data points and historical benchmarks you need to decide for yourself whether the Australian banks loan loss risk is already priced in or still waiting to be discovered.
Why this tightening cycle may land differently than the last
The previous tightening cycle should have hurt. Between May 2022 and November 2023 the RBA lifted the cash rate by 4.25 percentage points, one of the sharpest moves in its history. Yet non-housing loan losses across the majors during FY2023 and FY2024 reached only about 20-25 basis points.
Morgan Stanley credits four economic buffers for that containment. The question now is whether any of them are still standing.
- Household savings: previously inflated by pandemic-era cash, now roughly halved.
- Property values: previously appreciating and protecting collateral, now in a six-month decline.
- Government expenditure: previously elevated and supportive, now normalised.
- Employment: previously expanding rapidly, now growing more slowly.
What has since changed
The savings buffer tells the clearest story. According to ABS data, the household saving ratio stood at 6.5% in the June quarter of 2026, a figure that is less than half the 13.5% posted in FY2021-22, the period in which the RBA began its rate-hiking campaign.
Corporate insolvency trends were already flashing warnings well before the October 2026 RBA move, with insolvencies setting an all-time record in 2025 and the construction sector accounting for 21% of all national failures, a concentration that sits directly within the SME and business loan books Morgan Stanley identifies as the primary impairment exposure.
The savings buffer, then and now Household saving ratio: 6.5% (June quarter 2026) versus 13.5% at the start of the prior cycle.
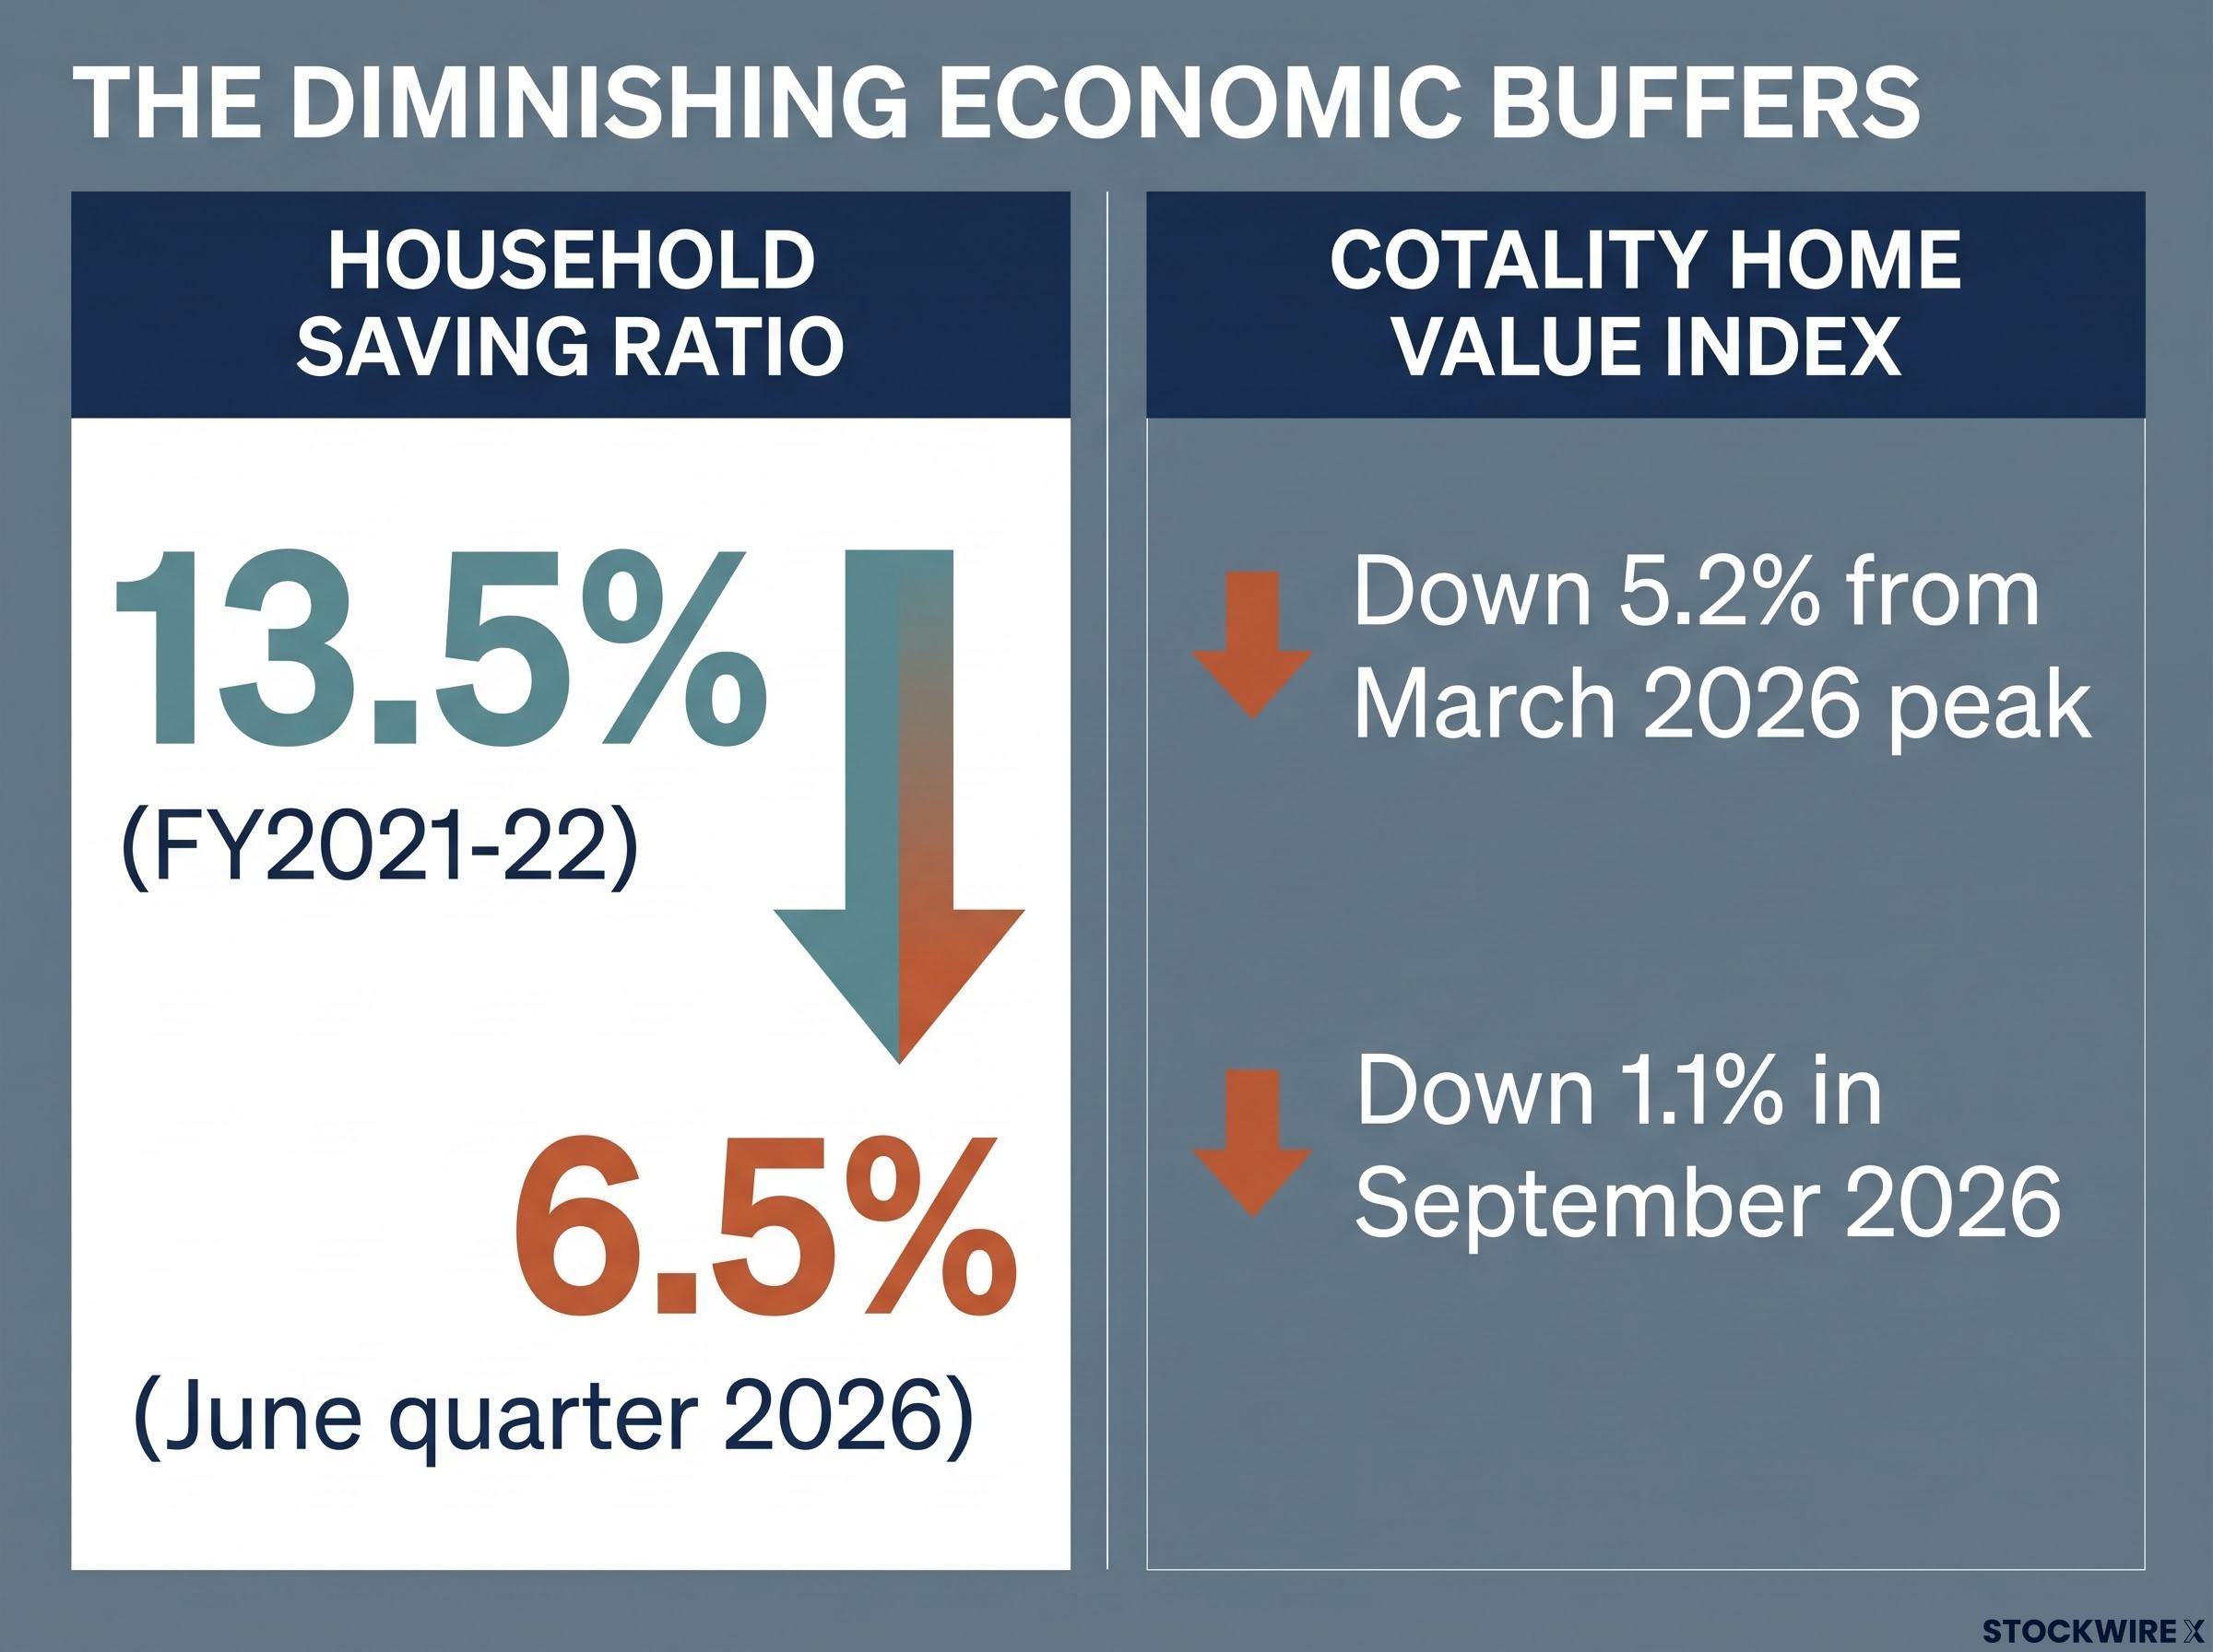
Property is softening at the same time. Cotality’s national Home Value Index recorded a 1.1% drop in September 2026, marking six straight months of falls and leaving prices around 5.2% under their March 2026 peak, with declines spread across almost all capital city suburbs.
Here is what this asymmetry means for you. The sector is entering this phase of tightening with materially less shock-absorption capacity than it had in 2022. If you are weighing bank equity exposure, treat that as the starting premise, not a footnote. The cushion that made the last cycle benign has largely been spent.
When big ASX news breaks, our subscribers know first
What the historical record says loan losses could look like
Before judging any forecast, it helps to know where the numbers sit on the historical map. Non-housing loan losses have ranged from barely noticeable to genuinely severe, and each level attaches to a recognisable economic episode.
| Episode | Period | Non-Housing Loss Rate (bps) | Context |
|---|---|---|---|
| GFC peak | FY2008-FY2010 | ~120 | Global financial crisis |
| COVID peak | 2020 | ~115 | Pandemic shock |
| Post-GFC rate stress | Cash rate above 4.5% | ~70 | Comparable rate setting to now |
| Pre-COVID average | Five years to 2019 | ~41 | Normal conditions |
| Prior tightening cycle | FY2023-FY2024 | ~20-25 | Buffers intact |
| Market consensus | FY2027 (projected) | ~30 | Current expectation |
The consensus figure is the one to sit with. At roughly 30 basis points, the market’s FY2027 projection falls below the pre-COVID five-year average of about 41 basis points, and well below the roughly 70 basis points the majors averaged when the cash rate was last above 4.5%.
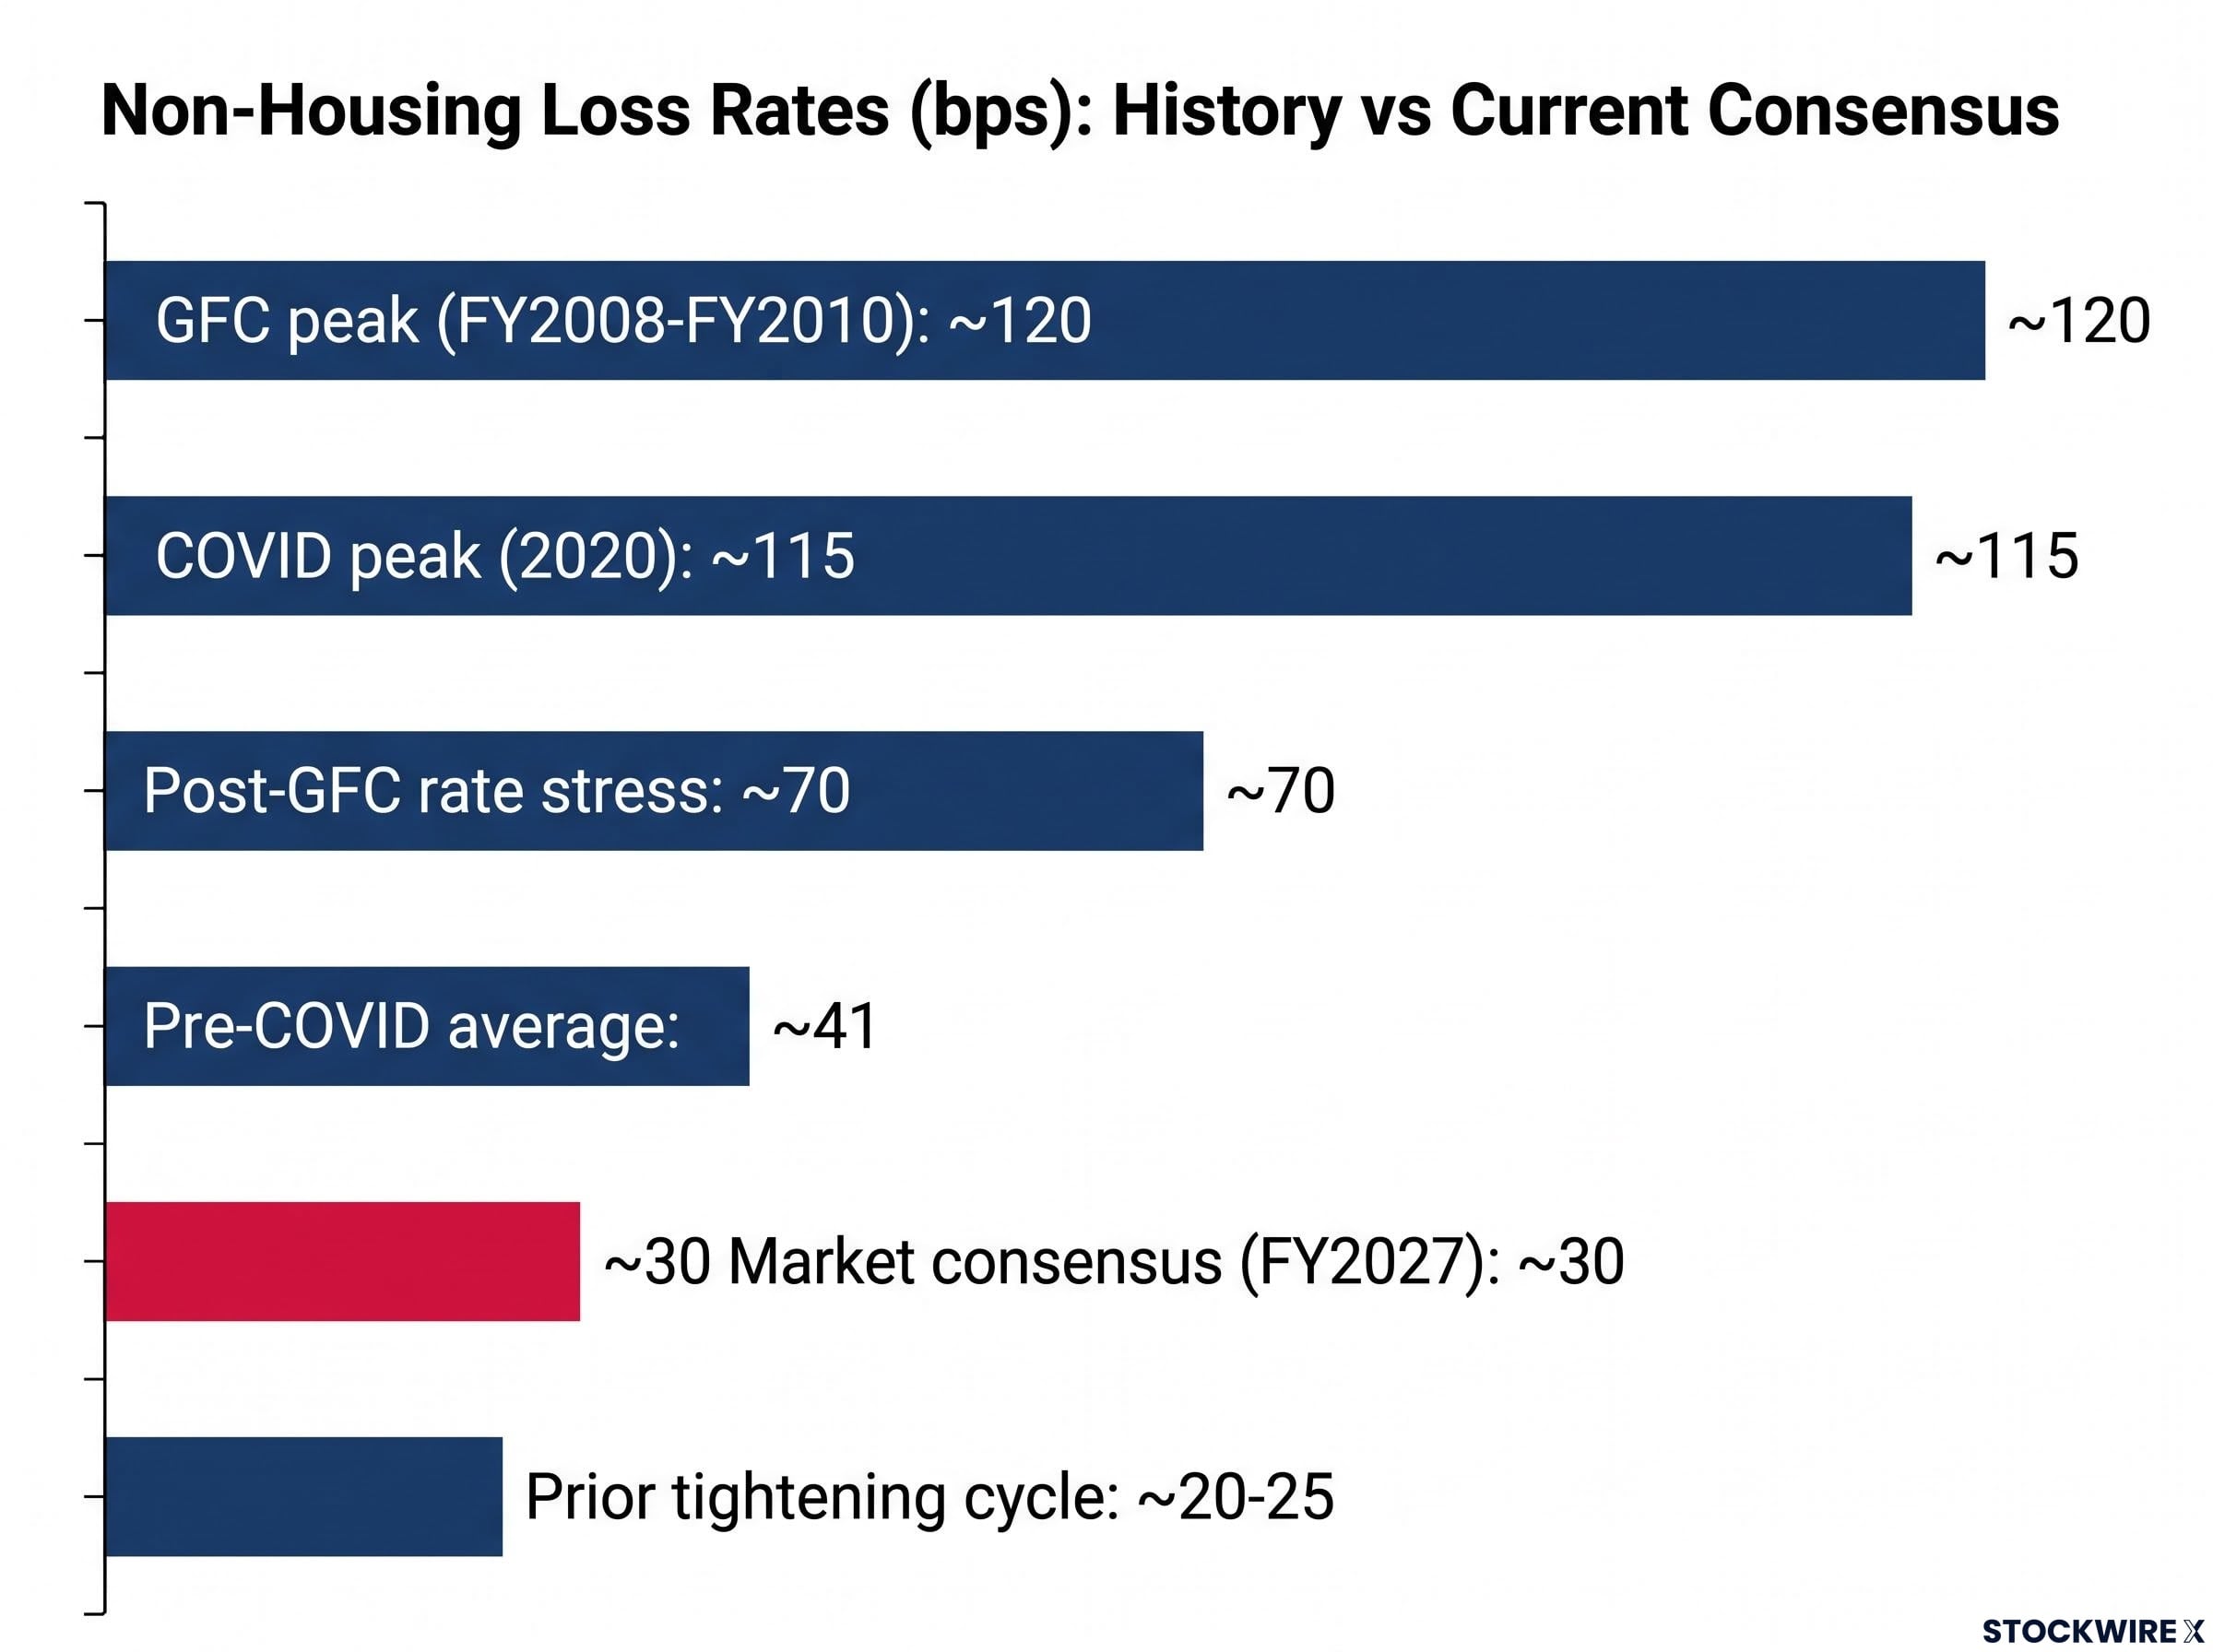
It also sits below the 35-40 basis points recorded in past episodes where unemployment pushed above 5%, excluding COVID.
Morgan Stanley’s own forecast is more cautious still in one sense and more alarming in another. The broker projects an FY2027 non-housing loss rate of 28 basis points and a total loan loss rate of 10 basis points, numbers that look modest in isolation but imply impairment charges well above what current consensus assumes.
A cycle Australia has not seen in a generation According to Morgan Stanley, roughly 35 years have passed since Australia last went through a loan loss cycle rooted in domestic economic conditions rather than an external global shock.
That observation is the point. A consensus of 30 basis points sits below every relevant benchmark for a period of rate stress. The market is implicitly assuming this cycle will be milder than any comparable episode on record. Before you hold bank equity at current prices, the honest question is whether you share that assumption, because the forecast quietly depends on it.
Morgan Stanley’s bank-by-bank breakdown and valuation concern
Morgan Stanley does not treat the majors as a single block. Its 1 October 2026 research note assigns each bank a distinct earnings downgrade scenario, calibrated to its specific impairment exposure.
| Bank | MS Rating | FY2027 Earnings Downgrade Range | Impairment vs Consensus |
|---|---|---|---|
| NAB | Underweight | 9.5-14.5% | ~14% above |
| CBA | Underweight | 6-9% | ~12% above |
| Westpac | Underweight | 5.5-9.5% | ~12% above |
| ANZ | Overweight | 5.5-10% | ~9% above |
The ratings matter as much as the ranges. Morgan Stanley holds ANZ as its sole positively rated large bank at Overweight, while rating CBA, NAB, and Westpac as Underweight, a split that reflects its view on relative earnings resilience under the impairment scenario. Collectively, the broker forecasts major-bank impairment charges roughly 12% above market consensus.
The sensitivity rule to apply yourself Morgan Stanley estimates that a 10 basis point rise in loan loss rates would reduce each major bank’s FY2027 earnings by roughly 7% to 10%.
That rule lets you stress-test your own view. If your own loss assumption differs from consensus by even a few basis points, you can translate it directly into an earnings impact.
Why the valuation makes it worse
The pricing is where the risk compounds. The Big Four trade at an average of roughly 18x earnings, or about 15.8x excluding CBA, against a post-COVID five-year average of 16x (13.5x ex-CBA).
Compare that to the last episode of serious loan loss concern. During 2023, major-bank multiples fell to between 12x and 15x, or 10.5x to 13x excluding CBA.
ASX bank valuations were already under scrutiny heading into August 2026 results, with CBA trading at approximately 27-28x earnings against a long-term average of 18x and the sector’s weighted average price-to-fair-value sitting around 1.14 according to Morningstar, providing a useful benchmark for the compression risk now embedded in current multiples.
Here is the read for your portfolio. Elevated valuations and unpriced impairment risk do not simply add together. If Morgan Stanley is even partly right, the earnings downgrade and a compression in the multiple could feed each other, producing share price falls larger than the earnings change alone would suggest.
The RBA’s counter-case and what the bears need to be right
The RBA’s October 2026 Financial Stability Review presents a coherent institutional position, and it deserves to be read as one rather than dismissed as a reflex.
- Capital: The CET1 capital ratio, a measure of the highest-quality capital banks hold against risk, stood at 12.4% in June 2026.
- Provisions: Banks hold loss provisions of around 0.7% of total credit outstanding, which the RBA describes as a substantial buffer.
- Collateral: More than 50% of business non-performing loans are well secured, meaning collateral sales should cover many troubled exposures.
- Stress test: Even in its most adverse scenario, the RBA concludes banks are well placed to absorb losses while continuing to lend.
- Insolvency containment: Financial stability risks from company insolvencies remain contained, because most insolvent firms are small and carry little bank debt.
The stress scenario is worth stating in full, because it shows how severe a test the regulator applied.
The RBA’s adverse scenario A 3% fall in GDP, a 20% decline in housing and commercial property prices, unemployment rising to 6.3%, and the cash rate rising to 5.6%. The RBA still concluded banks remain resilient.
For the bear case to play out, three conditions need to hold at once.
- Loan losses must exceed what the 0.7% provisioning buffer can absorb.
- Property values must keep falling long enough to erode the collateral quality the RBA is relying on.
- Corporate insolvencies must grow large enough to carry meaningful bank debt, not just the small firms that have dominated recent insolvency data.
The housing market risk to bank collateral quality extends beyond month-to-month price movements; Morgan Stanley’s June 2026 analysis projected residential prices could fall up to 10% by end-2027, a scenario that, if realised, would erode the secured collateral buffer the RBA is relying on to contain business non-performing loan losses.
Here is the part the stress test does not settle. Capital adequacy and share price returns are different questions. Even if banks absorb losses without systemic stress, multiple compression from today’s elevated price-to-earnings levels could still hand equity holders significant negative returns. The RBA is answering whether the banks survive. It is not answering whether the shares hold their price.
What the November results will and will not resolve
The core tension is now clear. Morgan Stanley’s impairment forecasts run 12% above consensus while the banks trade above their long-run valuation averages, yet the RBA’s stress-testing concludes capital buffers are sufficient even under severe conditions. Both views are backed by data, and the gap between them is genuine.
The November 2026 full-year results from ANZ, NAB, and Westpac will narrow that gap, though not close it. They will show how management teams read current credit conditions and whether provisioning is being lifted, but FY2027 impairments will not appear in full-year FY2026 accounts. The results are a partial test, not a verdict.
Three data points will speak most directly to the Morgan Stanley thesis.
- Provision movement: whether banks build or release provisions, since releases at the onset of a cycle can themselves signal deteriorating credit.
- Non-performing loan trends across business and SME books.
- Management commentary on forward credit quality.
Alongside the results, Morgan Stanley tracks a set of leading indicators for non-housing loan quality that you can watch too.
- Property values
- Fuel prices
- Business conditions
- Employment levels
- Corporate insolvencies
- Business deposit growth
- Loans placed on watch
The RBA’s next scheduled rate announcement lands on 3 November 2026, into the same window.
For anyone holding bank equity, the honest frame is this. The debate is between a valuation risk, multiple compression if Morgan Stanley is right, and a timing risk, the opportunity cost of selling if the thesis is wrong but prices stay elevated. The November results will not settle which risk wins, but they will narrow the range of plausible outcomes. That makes the weeks ahead a period where position sizing matters more than conviction.
Framing the current environment correctly depends on distinguishing cyclical versus systemic bank risk: a cyclical drawdown historically rewarded accumulation in Australian bank shares, while a systemic event, as seen during the GFC, produced a 56% peak-to-trough collapse with recovery taking nearly 11 years, two outcomes that demand opposite portfolio responses.
This article is for informational purposes only and should not be considered financial advice. Investors should conduct their own research and consult with financial professionals before making investment decisions. Past performance does not guarantee future results. Financial projections are subject to market conditions and various risk factors, and forward-looking scenarios are speculative and subject to change based on market developments.