The market dropped. Your read on direction was right. And your put still lost money.
If that has happened to you, it is not bad luck and it is not an edge case. It is a documented, repeatable pattern with a precise mechanical cause, and it comes down to the fact that direction is only one of several forces acting on the value of a put at the same time.
Delta is the Greek most traders watch, but theta and vega can quietly work against the buyer even when the underlying cooperates. The scale of the damage is real: academic research puts aggregate retail options losses at roughly $3 billion across one studied period, much of it driven by volatility mispricing rather than wrong directional calls.
What follows gives you the mechanical framework to diagnose your next put trade before the market does it for you: a Greek-by-Greek breakdown of the forces eroding your position, the specific conditions that make a loss most likely, the evidence that this happens systematically, and the structural adjustments that shift the odds.
What each Greek is actually doing to your put
Here is the uncomfortable truth about a long put. From the moment you buy it, four forces start acting on its price at once, and most buyers are only watching one of them.
The mechanics described here build on options basics that many traders treat as settled but that contain the seeds of the losses detailed in the research: a put’s total premium is the maximum loss, yet that maximum is routinely reached by traders who called direction correctly.
Delta is the one you already know. It measures how much the put’s price moves for a $1 move in the underlying. Buy a 30-delta put on a $100 stock, and if the stock falls $1, your put gains roughly $0.30 in value. Simple, intuitive, and the reason most people enter the trade.
Theta is the one running against you in the background. It is the daily cost of holding the position, the erosion of time value that happens whether the stock moves or not. Theta is always negative for a long option, and it accelerates as expiry approaches. Think of it as a timer that starts the instant you buy.
Vega is the one that catches people out. It measures how much the put’s price responds to changes in implied volatility, the market’s expectation of how much the underlying will move. If implied volatility rises 1 percentage point and your option gains $0.10, vega equals 0.10. The catch: if you buy when volatility is already elevated, you are paying a premium that can collapse even as the stock falls.
Gamma measures how fast delta itself changes, and it spikes near expiry. That acceleration is why very short-dated puts behave erratically, swinging in value on small moves.
Rho, sensitivity to interest rates, is the least relevant Greek for a typical put buyer. You can set it aside.
How Cboe frames the Greeks Cboe describes the Greeks as “risk management tools that measure sensitivities impacting the price (theoretical value) of an option.” In other words, each one is a dial showing where your money is exposed.
| Greek | What it measures | Sign for long put | Plain-English meaning |
|---|---|---|---|
| Delta | Sensitivity to a $1 move in the underlying | Negative | Your put gains as the stock falls |
| Theta | Daily time decay | Negative | You lose value every day you hold |
| Vega | Sensitivity to implied volatility | Positive | You gain if volatility rises, lose if it falls |
| Gamma | Rate of change of delta | Positive | Your delta accelerates near expiry |
| Rho | Sensitivity to interest rates | Minor | Largely irrelevant for put buyers |
Why Greeks interact rather than operate in isolation
Here is where it gets costly. Delta, theta and vega all act on the same premium simultaneously, so a gain from one can be fully wiped out by losses from the other two.
Picture a slow decline. Delta is adding value as the stock drifts lower, but theta is subtracting value every single day, and if implied volatility is also falling, vega is subtracting on top of that. Your put can be losing ground on three fronts while you are watching only the one that is helping.
Understanding that interaction is what separates an informed put buyer from one who is blindsided by the result.
When big ASX news breaks, our subscribers know first
The theta-vega trap: why a slow decline is the worst-case scenario for put buyers
Here is the signal that tells you something structural is wrong: the market is falling, your put is in the money on direction, and the position is still bleeding. To understand why, you have to compare two very different kinds of decline.
A fast, crash-style drop is the put buyer’s ideal environment. Delta delivers large gains quickly, and panic drives implied volatility sharply higher, so vega compounds the profit on top of the directional move. Both forces pull in your favour at once.
Now take the slow, choppy grind lower. Delta gains come in small, incremental pieces. Theta erodes premium every day you wait. And crucially, implied volatility may actually fall as the market slides without panic, because there is no fear catalyst to drive it up.
That last point is the heart of what practitioners call a volatility crush. Implied volatility tends to peak before or during a catalyst event and then mean-reverts as the event passes. Buy a put when volatility is elevated, and you can lose that entire volatility premium even while the underlying keeps declining exactly as you predicted.
The relationship between vega and premium magnitude is nonlinear: the same 10% OTM put is worth roughly $3 at 15% implied volatility and roughly $120 at 35.5% implied volatility, which is why buying after a volatility spike means paying a premium that is structurally likely to contract even when the directional move continues.
The break-even maths makes the problem concrete.
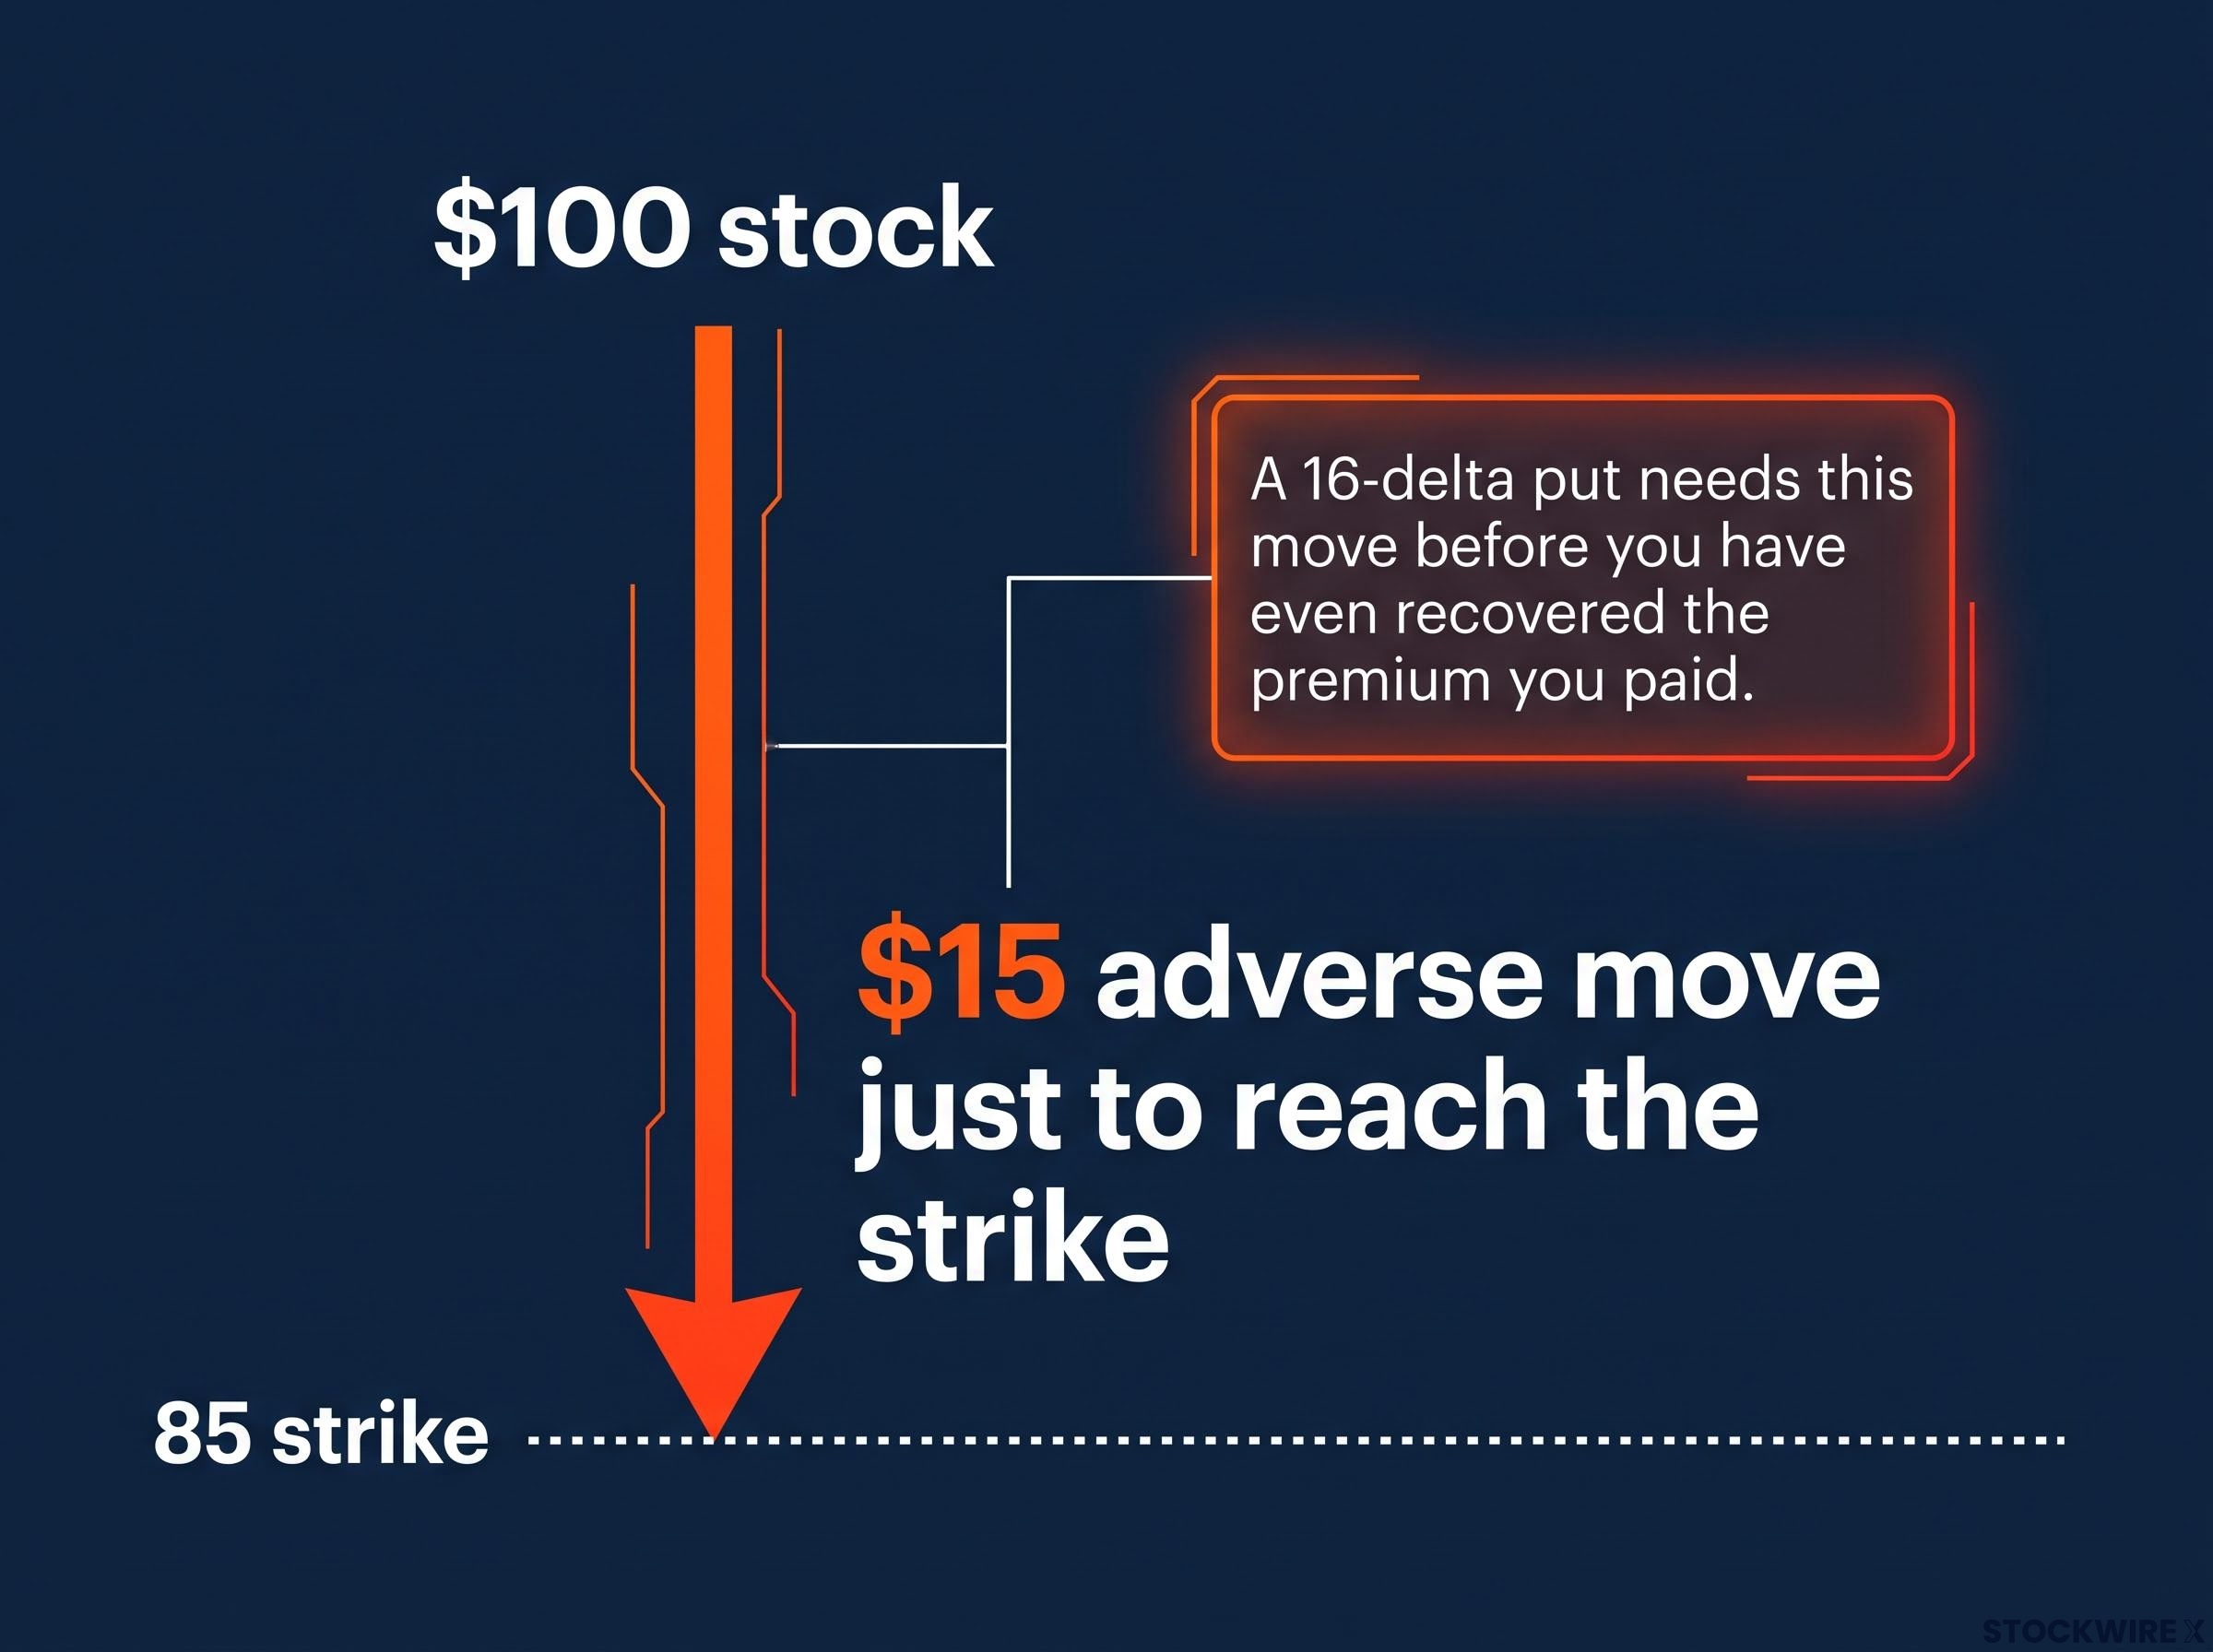
The break-even reality A 16-delta put on a $100 stock at the 85 strike needs roughly a $15 adverse move just to reach the strike, before you have even recovered the premium you paid. Far out-of-the-money, near-expiry puts demand large, fast moves simply to break even.
Certain conditions make this trap far more punishing:
- Buying after implied volatility has already spiked, so you overpay for the volatility component
- Holding far out-of-the-money puts whose value is almost entirely time and volatility premium, with little or no intrinsic value
- Using very short maturities where theta is large per day
- Continuing to hold after the main catalyst has passed, when decay and volatility normalisation erode value together
This dynamic is most extreme in ultra-short-dated contracts. OIC instructor Mat Cashman has warned that in 0DTE (zero days to expiration) options, gamma and theta play a heightened role, and the contracts can lose value rapidly even when the underlying moves exactly as expected. Practitioner commentary from a live session captured the same thing in real time: with the S&P 500 down around 20 points and bouncing off its lows, theta and vega were offsetting delta gains in the choppy tape.
For your put to win in a slow decline, the underlying has to fall far enough and fast enough to overcome both the daily theta charge and any compression in implied volatility. That is a far harder bar to clear than simply being right about which way the market goes.
What the data shows about retail put buyers getting direction right but losing anyway
If this feels like it is just you, the numbers say otherwise. Across tens of millions of trades globally, the same pattern keeps surfacing: traders get the direction broadly right and lose anyway.
Start with the MIT study “Losing is Optional” by de Silva, Smith and So, now published in the Review of Finance. Its central finding is that retail investors overpay for options relative to realised volatility, then hold through post-event decay. Losses averaged 250 basis points per day on long option positions over the announcement day and the following 10 days. Around announcements, retail traders lost 5-9% on average, rising to 10-14% on high expected-volatility events.
The Losing is Optional research on retail option losses, published in the Review of Finance, finds that retail investors overpay for options relative to realised volatility and then hold through post-event decay, with losses averaging 250 basis points per day over the announcement day and the following ten trading days.
The scale of the aggregate damage comes from Bryzgalova, Pavlova and Sikorskaya, published in the Journal of Finance in 2023.
The counterintuitive finding Bryzgalova et al. document retail options losses of $2.1 billion from November 2019 through June 2021, an average gross monthly loss of 1.81%. The authors attribute much of the drag to volatility mispricing and trading costs, not to incorrect directional calls. You can be right about market risk and still lose.
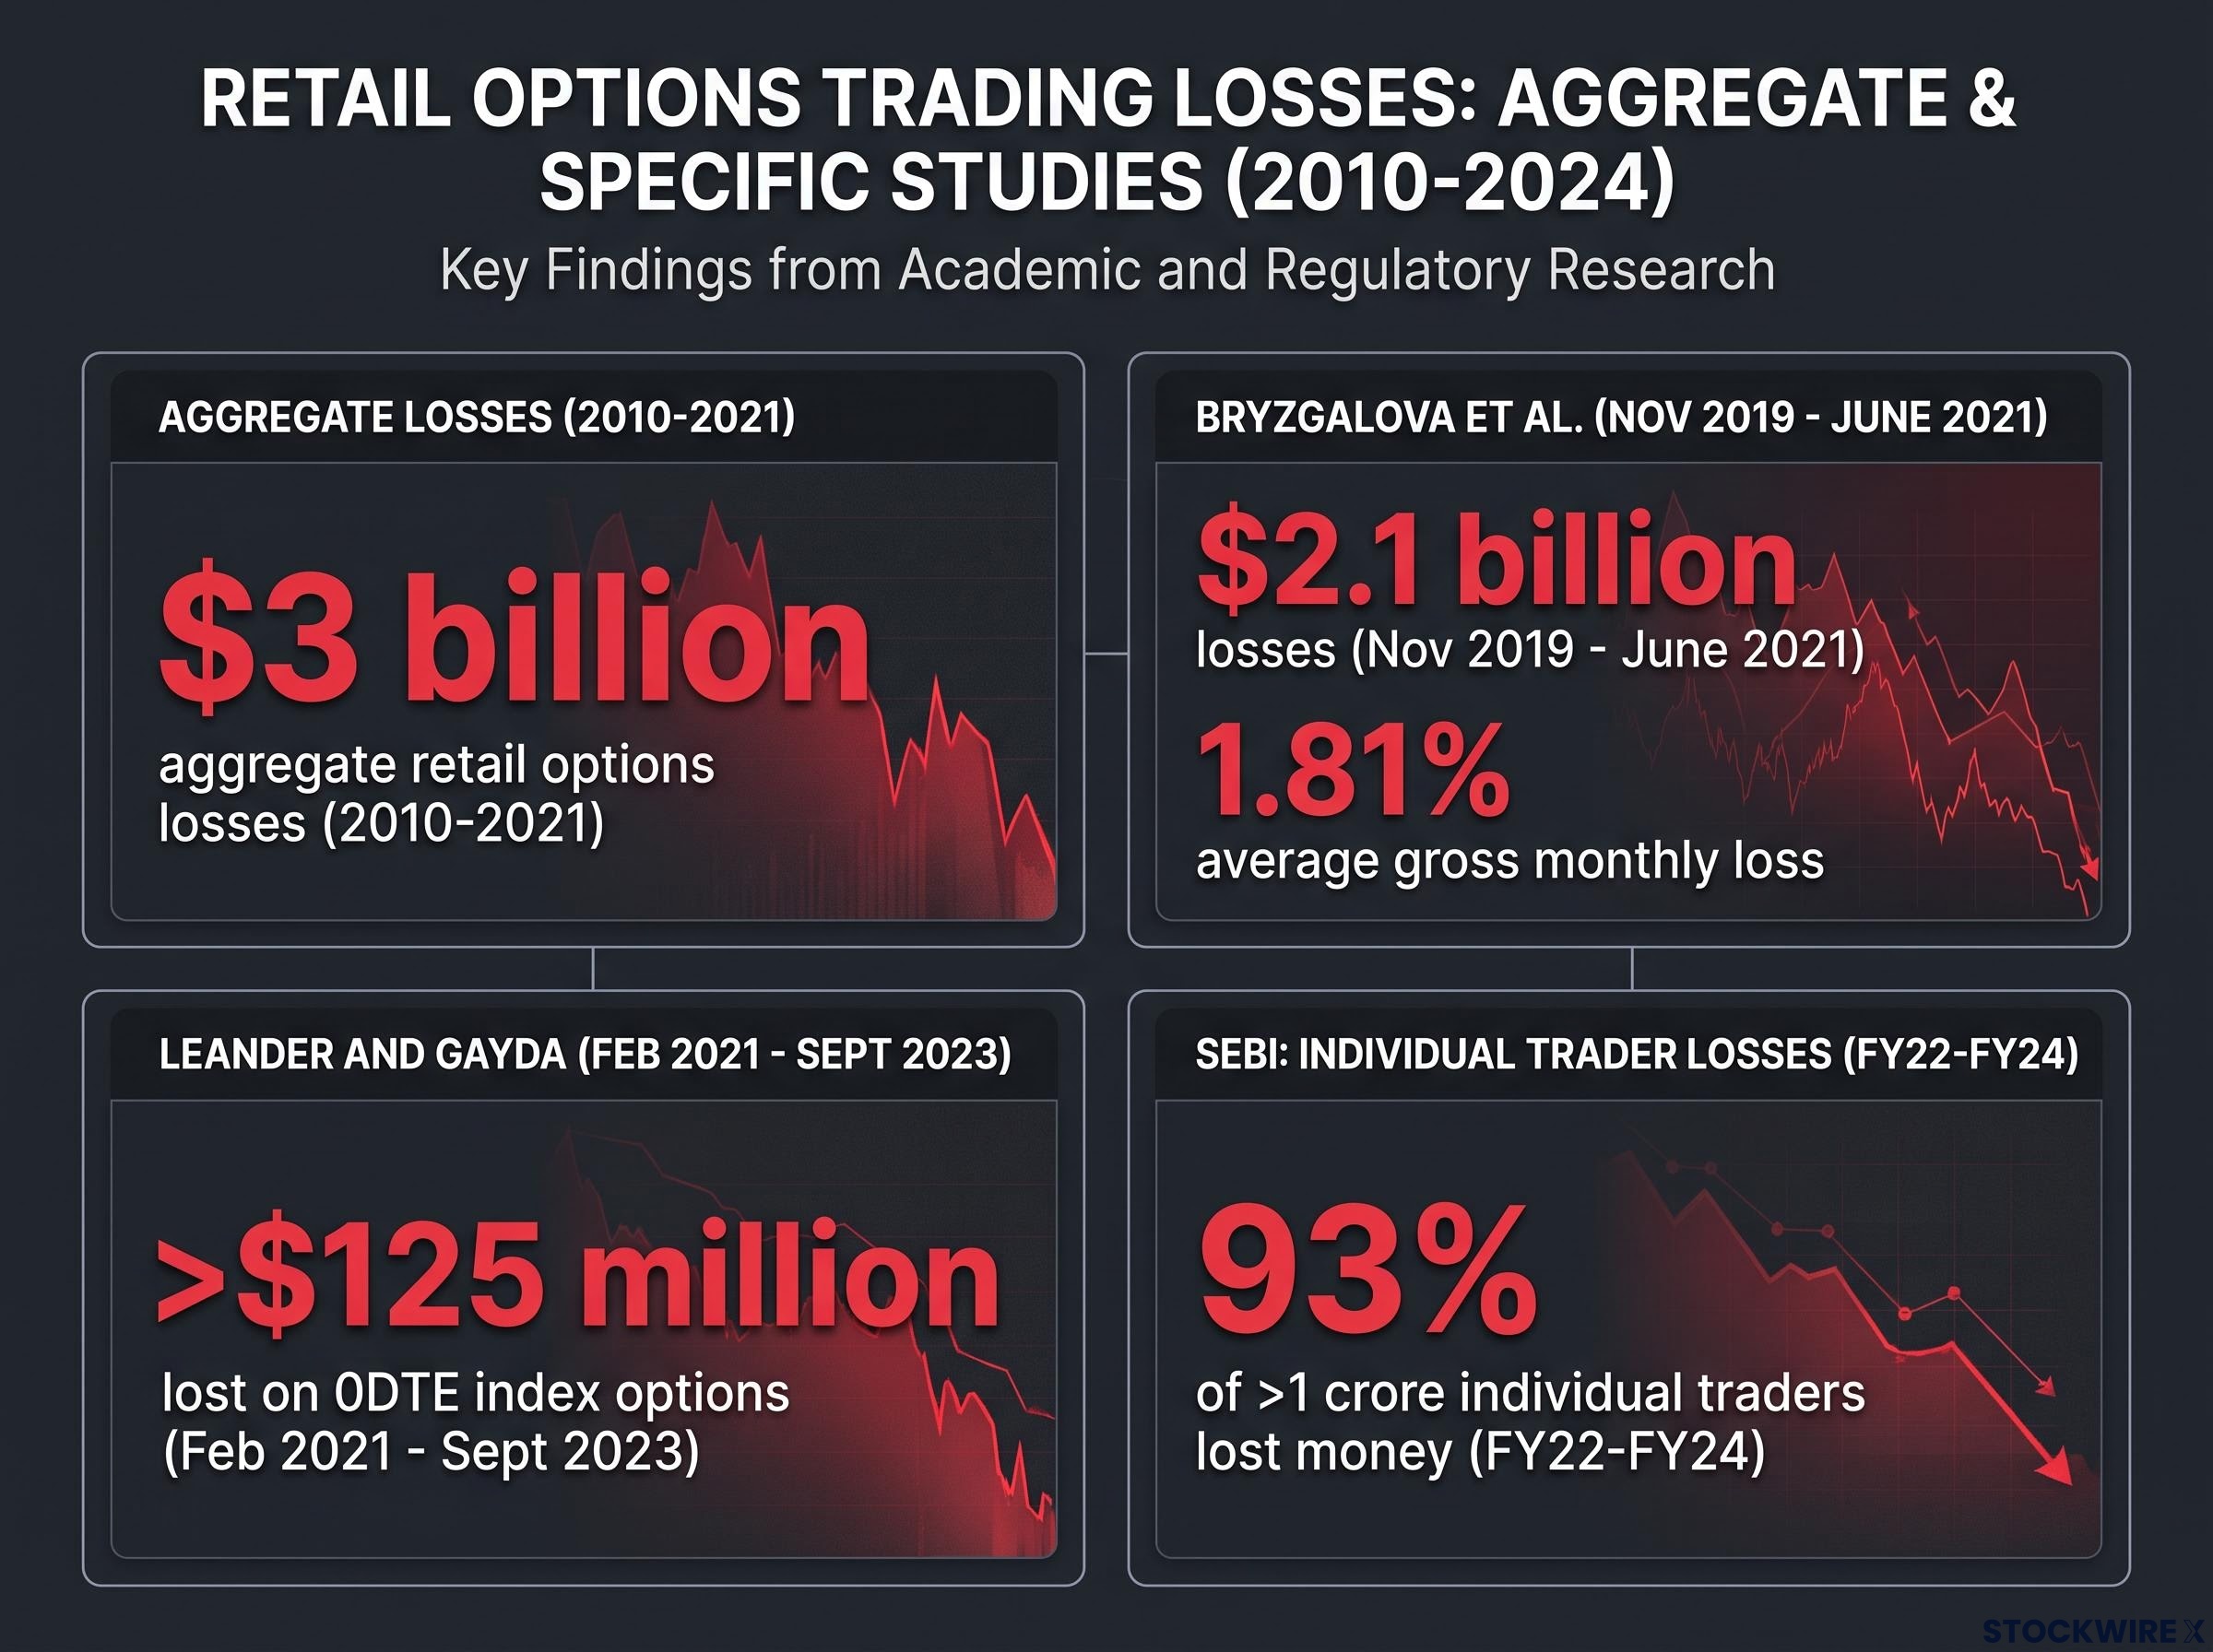
Across the longer 2010-2021 window, aggregate retail options losses run to roughly $3 billion.
The damage concentrates most severely in the shortest-dated contracts. Research by Leander and Gayda found retail traders lost more than $125 million on 0DTE index options between February 2021 and September 2023, with average daily debit losses of around $364,000 against just $122,000 of gains on credit orders. The “Anatomy of Retail Option Trading” paper reinforces it: average retail 0DTE per-trade loss of 4.6%, while longer-dated retail option trades earn close to zero.
This is not a Western quirk. A SEBI study published in September 2024 found 93% of over 1 crore individual traders lost money in equity derivatives across FY22-FY24, at an average loss of roughly Rs 2 lakh per trader.
Two structural costs sit underneath the Greek-driven losses:
- Bid-ask spreads average roughly 8% of an option’s value per round trip, implying about a 9-10% drag on capital before any directional bet can pay off
- The SEBI figures confirm the pattern holds across an enormous retail population, not just a small or unusual sample
The read for you is direct. Being right about direction is necessary but not sufficient for a long put to profit. The entry conditions, meaning the volatility level, the maturity and the strike you choose, matter as much as the call itself.
Five structural adjustments that change the odds for put buyers
None of this eliminates the Greek headwinds. But each adjustment below reduces how much the market has to cooperate for your put to reach profitability, and each one answers directly to a force identified earlier.
Practitioners evaluating a long put in real time tend to work through a short checklist before committing.
The five-question pre-trade check Does the put’s time horizon match the expected duration of the decline? How big a move is needed to clear break-even, including premium? Is implied volatility elevated or compressed, and which way is it likely to go? Is the decline likely to be fast and directional, or slow and choppy? Would a spread reduce your theta and vega exposure?
Here are the five adjustments, in order of priority.
- Buy longer-dated puts to blunt theta. More time means lower daily decay. The trade-off is explicit: you give up leverage and pay a higher nominal premium in exchange for less erosion while you wait.
- Time your entry against implied volatility. Buying after a volatility spike means paying for a premium that is likely to mean-revert against you. The discipline is to avoid overpaying for the volatility component in the first place.
- Exit after the catalyst. Both the practitioner and academic evidence point the same way: the bulk of retail losses accumulate after the event, during the holding period, as decay and volatility normalisation combine. Getting out once the catalyst has passed removes the worst of it.
- Use a bear put spread instead of a single long put. Buying one put and selling a lower-strike put against it reduces net cost and volatility sensitivity. The trade-offs:
Bear put spread construction reduces not only the net debit paid but also the vega sensitivity of the position, because the short leg partly offsets the long leg’s volatility exposure; over a full market cycle including the April 2025 drawdown, spreads outperformed single-leg put positions on a per-dollar-of-capital basis even though the naked structure produced larger nominal bull-market gains.
- Your downside participation is capped at the lower strike
- Theta cost is reduced because the short leg decays in your favour
- Vega exposure is reduced because the two legs partly offset
- Be disciplined on strike and maturity. Remember the break-even maths: far out-of-the-money, near-expiry puts demand large, fast moves just to overcome time and volatility decay. Mat Cashman’s warning on 0DTE sizing applies here, because small timing errors on ultra-short contracts can mean total premium loss.
Each of these is a direct response to a Greek force. Together they convert the theory from the earlier sections into decisions you can make before placing the next order.
What the Greeks are telling you before you place the next put trade
You now have the language to evaluate a put across every active force, not just delta. That is the real shift. A put is not simply a bet on direction; it is a bet on direction happening fast enough and with enough volatility behind it to outrun theta and vega.
Long puts absolutely have their place. A fast, crash-style decline rewards them handsomely, rising volatility environments amplify the gains, and a well-timed catalyst play with a disciplined exit can work exactly as intended. The caution is not that puts are bad, it is that the conditions have to fit the structure.
So the better question is no longer “will the market fall?” It is whether you are facing a fast-crash environment or a slow-grind one, and whether the structure of your position actually matches the conditions you expect.
The reader who came in asking why a put is not making money should leave asking something sharper: did the conditions at entry give this put a reasonable structural chance in the first place? A better question before the trade is worth more than any post-mortem after it.
For readers who want to understand why the psychological and structural forces that end options accounts often arrive together, our full explainer on options drawdowns details how emotional loss aversion, broker margin calls, and systemic de-leveraging converge during volatility spikes to force exits at the worst possible moment.
This article is for informational purposes only and should not be considered financial advice. Investors should conduct their own research and consult with financial professionals before making investment decisions. Past performance does not guarantee future results, and options trading carries substantial risk of loss.